OK, so the primary season is not over yet, and even McCain doesn’t have it wrapped up officially, let alone the Democrats. But I am going to start looking at the Electoral College anyway. Since I think Obama is going to come out the winner on the Democratic side, and McCain will be the Republican nominee barring something catastrophic, I will be assuming a McCain vs Obama general election. If something happens to change this, then I will revise things.
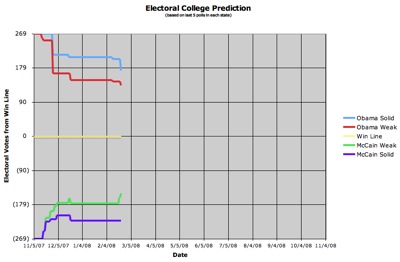
As before, I have started a wiki page to track this. The link on the image goes to the full page, including a larger image of the graph and explanations of my methodology and a breakdown of the numbers by state. Basically I’m looking at the last five McCain vs Obama polls in each state, and then classifying them as Strong or Weak Obama or McCain states, with the lead needing to be at least 10% to be considered “Strong”.
At the moment there are actually not that many state polls of this sort. I don’t actually yet have five polls in any state. And many of those polls are more than a month old, which is forever in terms of how things are moving. And the states for which there are no polls at all still account for more than 50% of the electoral votes. Presumably as the nominations become final on both sides, this will rapidly change and we will get polls in more states. Hopefully eventually all of them.
As I start this project I have:
- Strong McCain: Ohio (20), Alabama (9), Kentucky (8), Kansas (6), New Mexico (5)
- Weak McCain: Pennsylvania (21), North Carolina (15), Virginia (13), Massachusetts (12), Minnesota (10)
- Weak Obama: Missouri (11), Washington (11), Wisconsin (10), Oregon (7)
- Strong Obama: California (55), New York (31), Iowa (7), Rhode Island (4)
Unless I missed some (which is possible) there have been no other states with McCain/Obama general election matchup polls (since 5 Nov 2007) yet.
So to start with we stand at 283 electoral votes with no polls, 136 electoral votes leaning Obama, 119 electoral votes leaning McCain counting both strong and weak states. With only strong states we have 97 Obama, 48 McCain. Of course, the huge number of states with no polls yet makes it very hard to tell anything from this yet. And I am refraining for putting states in one category or another based on 2004 results or any such. I’ll wait for actual polls in those states.
I will of course continue to update the 2008 Presidential Delegate Graphs when there are changes there. But I will now also be updating this general election prediction page whenever there are new polls that change the category of any state.
And of course, if either Obama or McCain ends up not being the nominee, then I’ll have to redo the whole page. But that’s OK. I can do that.
I should also note that the way I am representing the overall race in the one chart only applies if there are only two candidates with an actual shot of getting electoral votes. If some third party candidate enters and looks like they are actually strong enough to potentially get electoral votes, I will have to revisit how to represent things.
Leave a Reply
You must be logged in to post a comment.