Chris Weigant once again uses some graphs I made for him, and some quotes from me, in an article on his site Wednesday.
A Surprise In Obama’s Poll Numbers
(Chris Weigant, 18 Mar 2009)
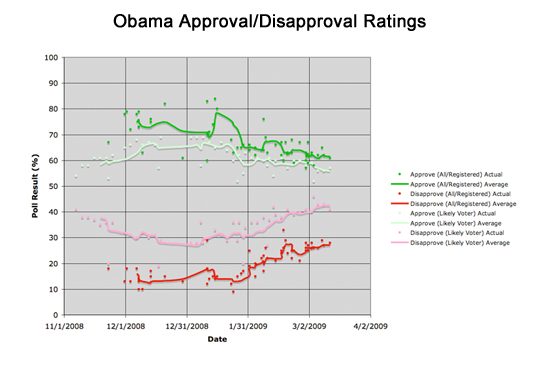
It really is a bit early to focus on President Obama’s approval ratings in the polls, I know. But, rather than looking at the overall picture of how he’s doing, I have been noticing something interesting which I don’t believe others have picked up on — Obama’s numbers dramatically improve depending on the sample used by the pollsters. When “likely voters” (LV) are polled, the numbers they give are different from when either “registered voters” (RV) or “all adults” (A) are polled. Obama’s LV approval rating is about five points lower than the RV/A numbers. The difference is more pronounced in the disapproval ratings, where LV numbers are fully ten points higher than RV/A numbers.
(Also cross posted at Huffington Post)
Chris draws some tentative conclusions from this about there (at least potentially) being a reservoir of extra strong support for Obama among the folks who are in the “All” or “Registered Voter” samples but who are not in the “Likely Voter” samples… perhaps tied to people who were not traditional voters who were “energized” by the Obama campaign and are retaining their excitement.
Maybe. But as Chris quotes me in his article, I have my doubts and think it is highly likely that there is a much more pedestrian explanation. The quote of mine Chris gives does hit on the crux of this, but for completeness to get my own thoughts on this out there, let me quote here a bit more of my comments to Chris which he excerpted. (I’ve made some minor edits to fix some wording issues with the original, and to remove other comments not directly relevant.)
Date: 15 March 2009 04:10:58 GMT
I can’t do fancy loess regression like Pollster does. The lines are simple “last five poll” averages. But for these purposes that is probably fine.
My gut feel here is that these differences are actually somewhat tied to how undecideds or non-responders are taken into account. If you take my “average” lines for approve and disapprove and sum them at each point, for All/Registered you will see that the sum varies from 79.2% to 92.4% with an average of 87.5%. Meanwhile, for likely voter the sum varies from 88.6% to 99.0% with an average of 95.1%.
This means that the “all” group has a much higher undecided rate… which could either be a real effect or just that the likely voter polls push harder for an answer. It actually makes sense though that people who are less likely to vote are more undecided though, so lets assume it is a real effect.
What would more undecided people result in? Hmmm… well at first you’d think that it would lower BOTH the approve and disapprove numbers. But what we are seeing here is lower disapprove, but HIGHER approve. So what does this get you? Maybe there is a real effect here… something along the lines of the less-likely voters being more willing to give the benefit of the doubt and give an “Approves” rating and less likely to take a leap and say “Disapprove”.
I think this also makes sense for the less-likely voter. Less likely voters are also most likely less in tune and in touch with what is going on… generally less informed. So they are giving the benefit of the doubt on approval, and less likely to disapprove, because they don’t feel they know enough to pass a negative judgement.
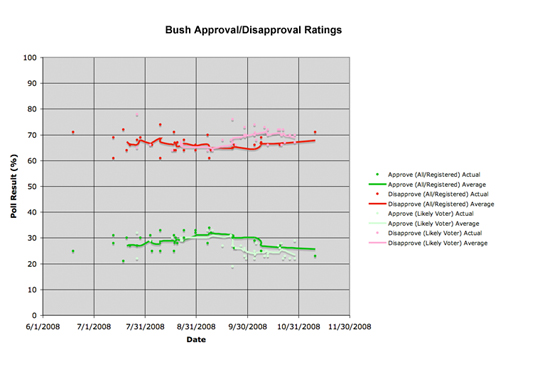
I haven’t tried this, but I’m guessing if you broke the polls up in a similar way for the last few years of the Bush administration, you’d see the same pattern… with the broader sample generally being less negative (more likely to approve, less likely to disapprove). This just seems like the natural tendency you would get from less informed people, which is who you are adding when you move from Likely Voters to the broader sample.
That is my guess anyway.
But you are right, the differences are quite clear between these groups.
Date: 15 March 2009 04:52:57 GMT
OK, before July or so, the polls were not identified as likely/registered/all, so there was no way to differentiate. So this only shows those polls that were in fact broken up that way.
So yes, with Bush in his last few months we do see the same pattern… the wider sample is more likely to be positive, and less likely to be negative. The differences are MUCH smaller though, and at certain points (back in August and September) the lines are almost indistinguishable. But I still think this does hold with the general principal that the people who are less likely to be engaged (and therefore not likely voters) are more likely to approve “by default” and less likely to give a negative (disapprove) rating. Basically, if you don’t pay attention to what is going on, you give the benefit of the doubt.
If one does the same exercise as I did last time looking at the sum of approve and disapprove, we see that the number of “undecideds” is almost identical between the two groups (rather than being larger in the wider sample). This actually makes some sense too… after 8 years, almost everybody felt they had enough information to make a judgement about Bush, and the percentage of people who felt like they didn’t know enough and therefore did that benefit of the doubt thing was much smaller.
At least, I think that explanation is a good tentative explanation of both the Bush and Obama results.
Date: 18 March 2009 06:49:08 GMT
I hypothesized that what is going on here is simply that non-likely voters… which are likely to also be people who are less informed about what is going on, and generally pay a little less attention to what is going on, are just more willing to “give the benefit of the doubt” and therefore are more likely to give a positive rating AND less likely to give a negative rating… they just generally are a little bit more positive than the people who actually pay attention.
And the Bush number seem to also follow this pattern… with the addition that after 8 years, even the people who pay less attention had a lot more information and were more likely to have an opinion, so the degree to which they are more positive than the likely voters is a lot less.
Now, all of the above is just a hypothesis. To actually test it, you’d actually have to run some polls specifically designed to investigate this and to control for other effects. This is just my guess as to a plausible interpretation of the data.
…
I would hesitate to attribute this as actual SUPPORT of Obama. The non-likely voters are almost by definition people who are less politically engaged. So what “approval” means is a softer concept in this group. It is kind of like asking me, as someone who doesn’t follow sports at all, if I approve of how my local sports team is doing. I honestly have no idea how they are doing. So, while perhaps I would pick a neutral position if I’m given the choice, I’m still pretty likely to say I approve of how they are doing… the default position is to assume they are doing OK… it is the position that causes the least friction. If I said I disapprove, I feel like I need to have reasons… maybe even good reasons… for saying I disapprove. But if I really don’t pay much attention, and don’t have a strong opinion, I’ll be reluctant to pass the negative judgement.
…
In the end, my thoughts about the undecideds may have been tangential. Basically, if there was no difference in behavior on these polls between Likely voters and non-Likely voters, other than there being a greater undecided rate among non-likely voters, one would expect that BOTH approve and disapprove would be LESS in the non-likely voter group… but that is NOT what you see. Disapprove is less as expected, but approve is unexpectedly higher. This indicates that there is indeed a behavioral difference other than just a higher tendency to be undecided. The bit about the “benefit of the doubt” is my stab at explaining that behavioral difference.
And that is that. :-)
Sam –
Thanks for posting this! And thanks, as always, for the charts!
I’ve added a link to this blog so others can read it.
:-)
-CW
Thanks Chris!