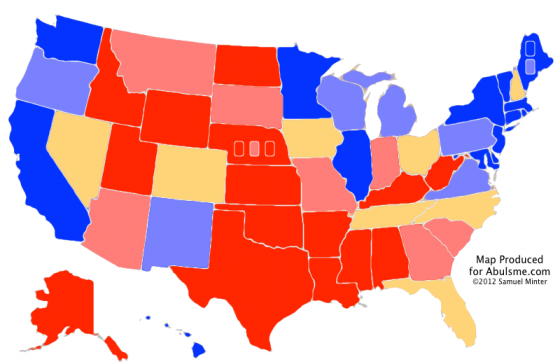
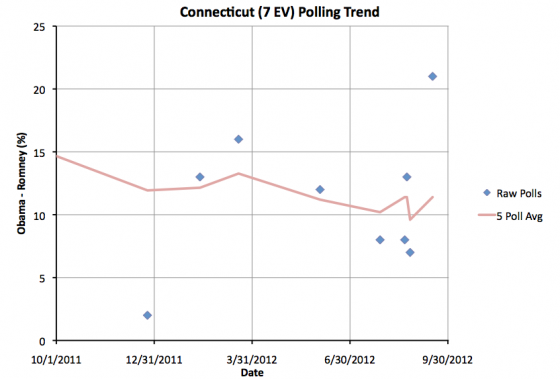
Only one status change today, as Obama’s lead in Connecticut tops 10% in the five poll average.
On August 30th Obama’s lead in Connecticut dipped slightly below 10% in my five poll average. With the first new poll in the state since then, the average pops back above 10% to 11.4%. So I once again classify Connecticut as “Strong Obama”. While the last poll is quite a bit higher than anything seen before and may be an outlier, the five poll average has been over 10% for almost all of the last year, so this is probably more representative of the “normal” status for Connecticut.
Of course, no matter if Obama’s lead in the state is a little more than 10%, or a little less than 10%, Connecticut isn’t even close to being a state that could go either way. Connecticut is not in contention. It is going to be an Obama state this cycle. So the model summary does not change:
| Romney | Obama | |
|---|---|---|
| Romney Best Case | 278 | 260 |
| Current Status | 206 | 332 |
| Obama Best Case | 180 | 358 |
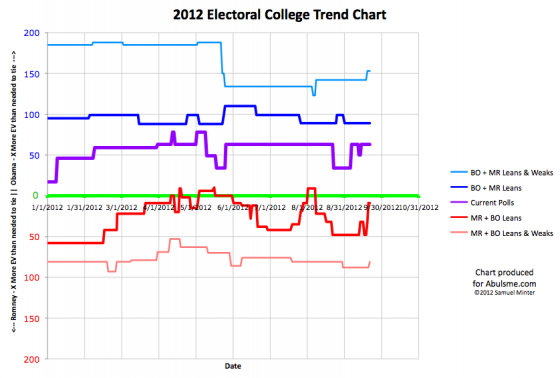
Not much else to say this time around. Obama increasing his lead in Connecticut doesn’t change the state of the race. There are now tons of new polls every day though, so keep tuned, there will undoubtidly be more changes to the core “Lean” and “Weak” states soon enough.
Most polls are still of the Lean Obama and Weak Obama states though. This is natural, as these are the states that will end up closest to the 269 electoral vote line if you ordered them by support levels, but it would be nice to get a few more polls on the Weak Romney states to see if Obama is gaining ground there too, or if those states are consolidating for Romney.
Maybe there will be some of those polls soon.
Note: Chart and map from the Abulsme.com 2012 Electoral College Prediction page. Both assume Obama vs Romney with no strong third party candidate and show polling as it currently exists. Things will change before election day. On the map red is Romney, blue is Obama, gold states are too close to call. Lines on the chart represent how many more electoral votes a candidate would have than is needed to tie under several different scenarios. Up is good for Obama, Down is good for Romney.
Edit 2012 Sep 22 23:51 to add final note.


Leave a Reply
You must be logged in to post a comment.