In my update today I added polling data from Quinnipiac (7 candidate combinations in Florida, Ohio and Pennsylvania), Gravis (5 candidate combinations in Nevada), and Saint Leo (5 candidate combinations in Florida). This resulted in a variety of status changes, but only a handful that meet my threshold for talking about here, which is that either the electoral college summary or the tipping point needs to change for one of the five best polled candidate pairs.
First off, there has been very little polling in Nevada thus far, but the new polling in Nevada moved both Clinton vs Paul and Clinton vs Christie from “Weak Clinton” to “Strong Clinton” as the polling average moved to a greater than 5% Clinton lead. They join Clinton vs Bush, which was already in that zone. (Clinton vs Huckabee and Ryan, the other two of the top five best polled candidate combinations, have not been polled at all in Nevada.)
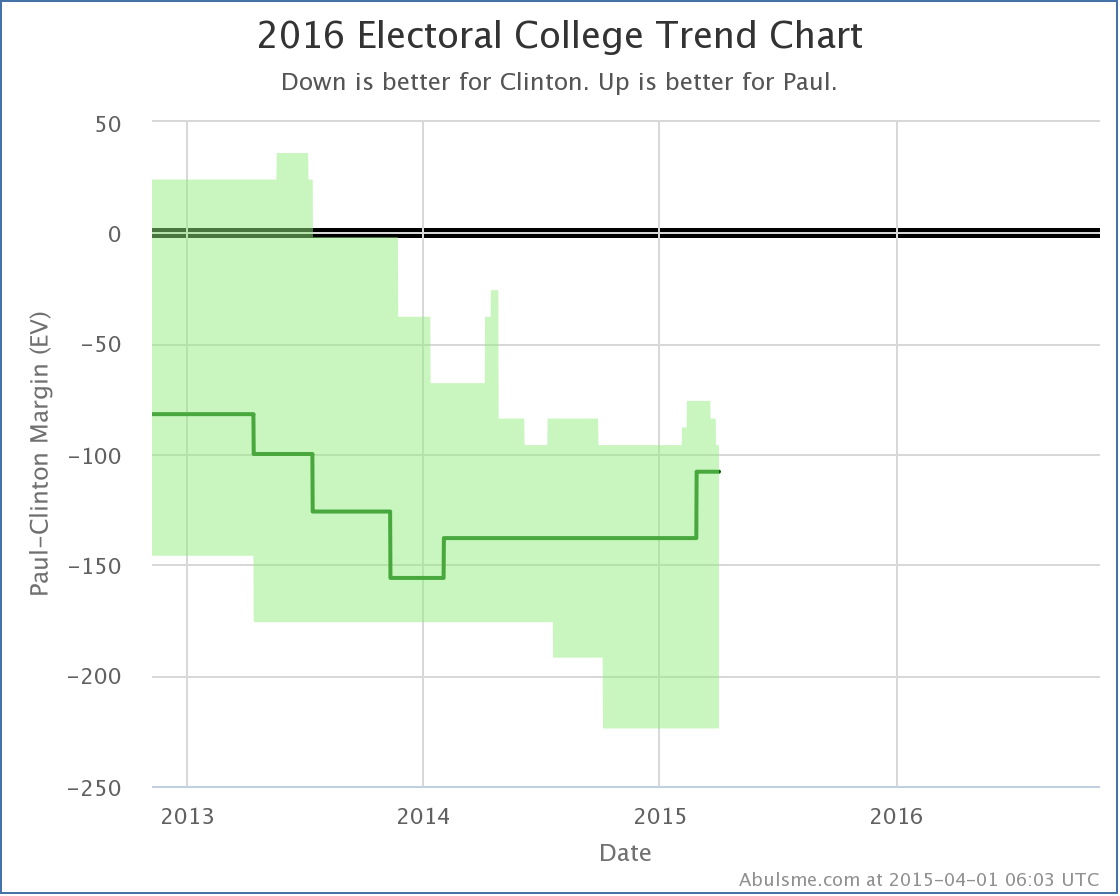
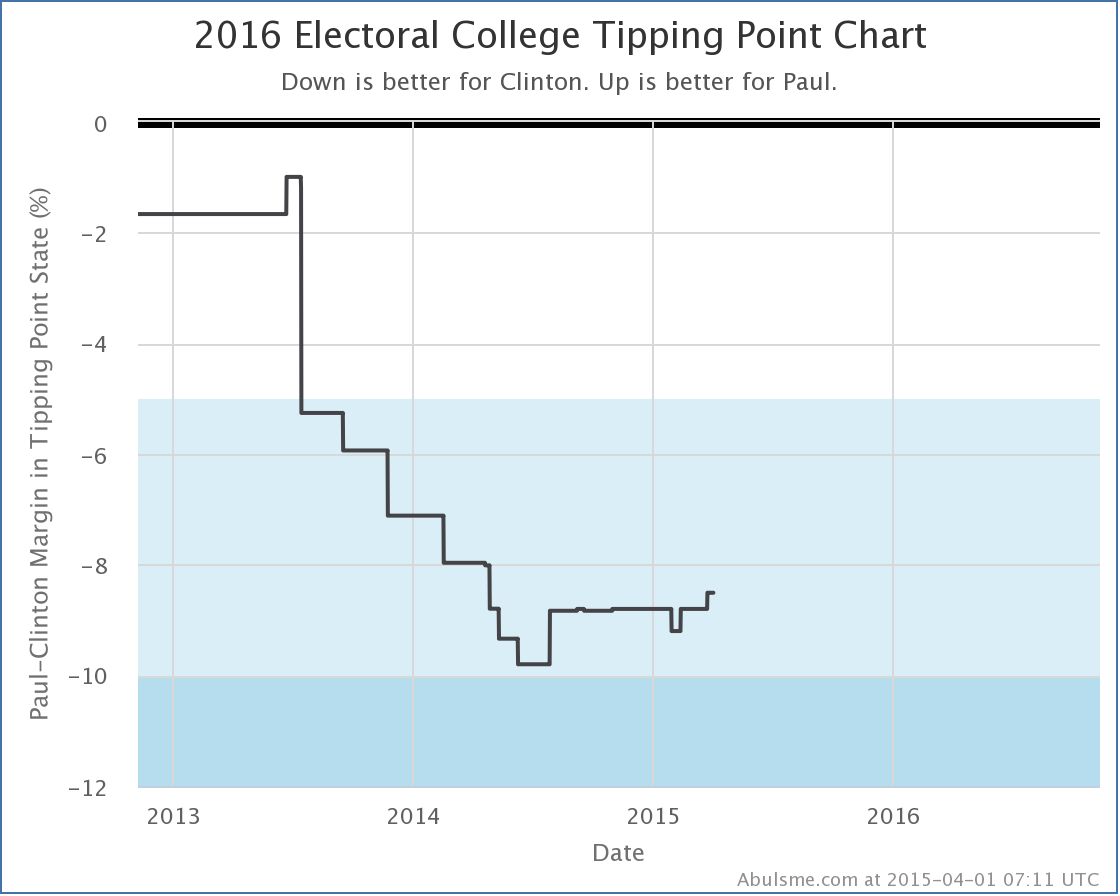
So here’s what Paul’s electoral college trends look like at the moment vs Clinton:
And here’s Christie vs Clinton:
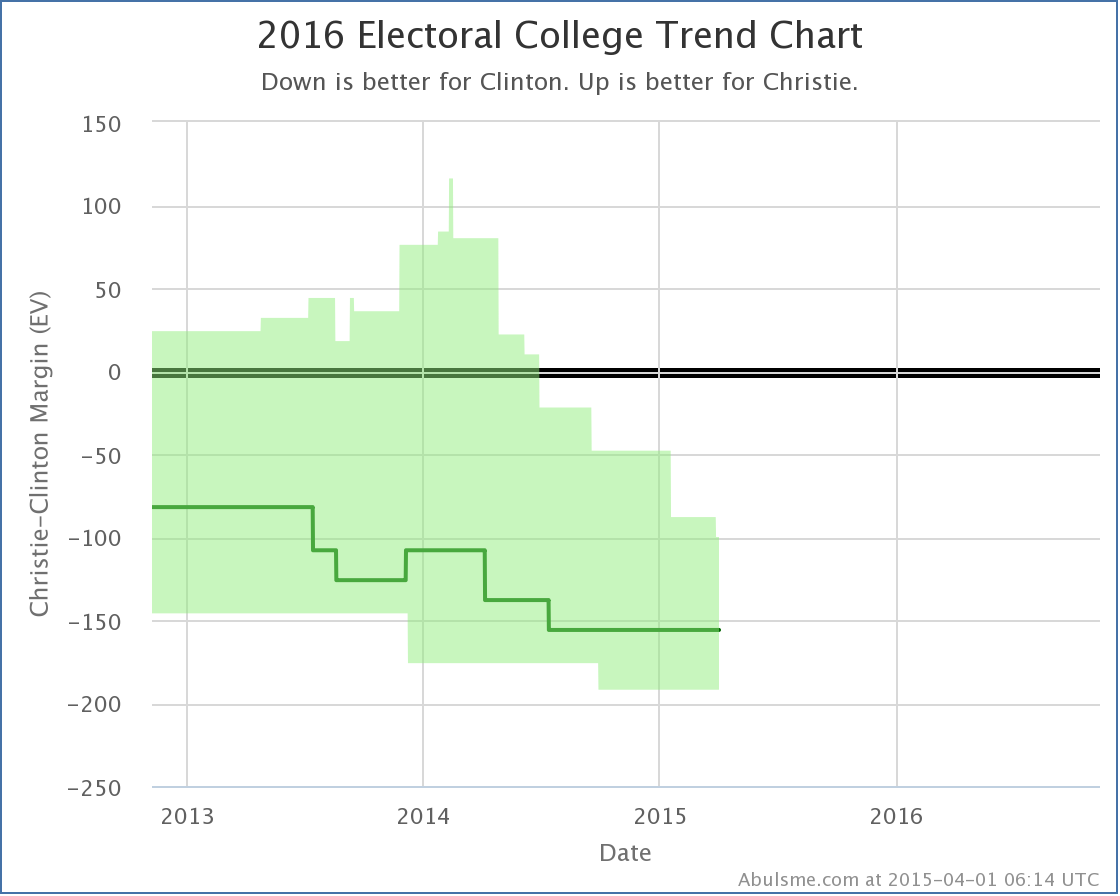
In both of these, you can see the slight dip at the top right of the “envelope of possibility” representing Nevada no longer being included in the “best case” for the Republican.
The moves mentioned above for Nevada are the only two cases in today’s updates where the actual electoral college summaries changed. (Well, of the top five best polled candidate combinations anyway.)
But we’ll also mention it here if there are changes to the tipping point margin. As a reminder, the tipping point margin is basically how much you would have to shift the results in ALL states in order to change the electoral college winner. Basically, it is like looking at the national popular vote, but taking into account the structure of the electoral college, so you’re looking at how much things have to move to change the electoral college outcome, not just the winner of the popular vote. (Which as 2000 showed, do not necessarily go together.)
So, those changes…
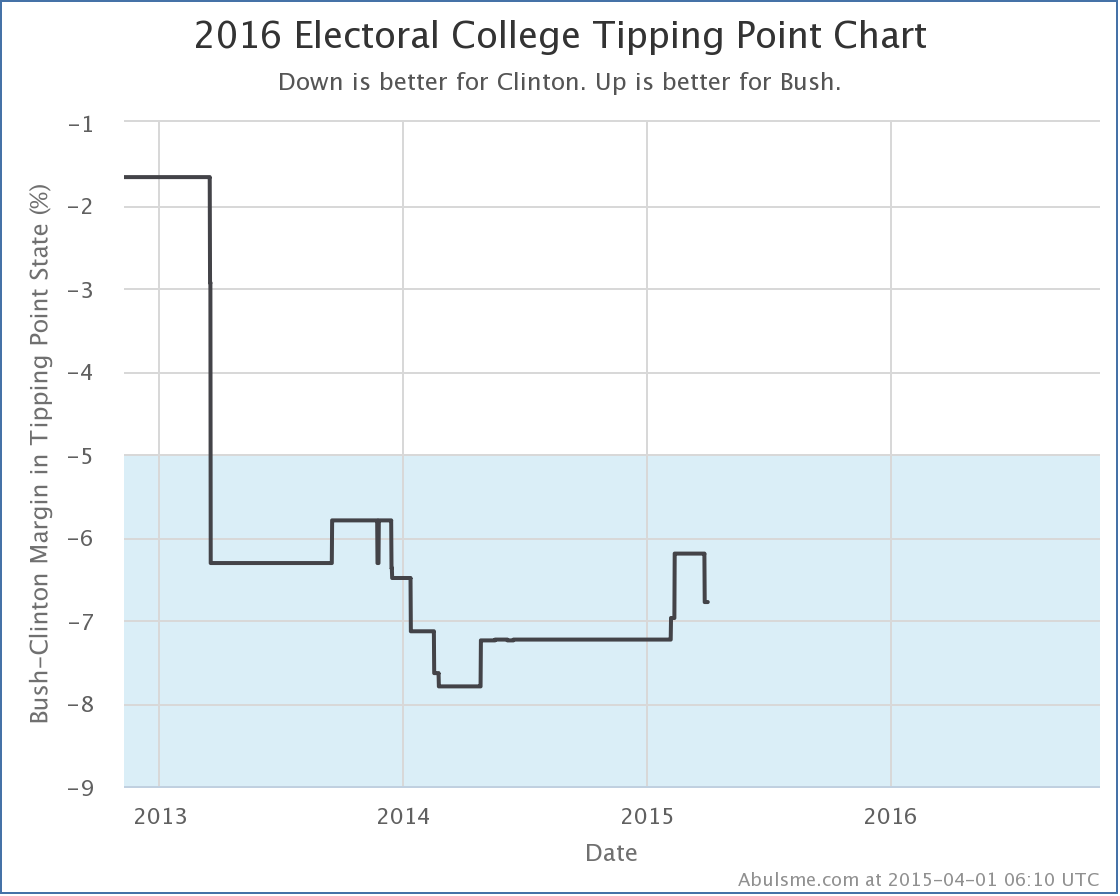
First off Clinton vs Bush. With today’s added polling and Nevada getting bluer, the tipping point moves from Clinton by 6.2% in Virginia, to Clinton by 6.8% in Minnesota.
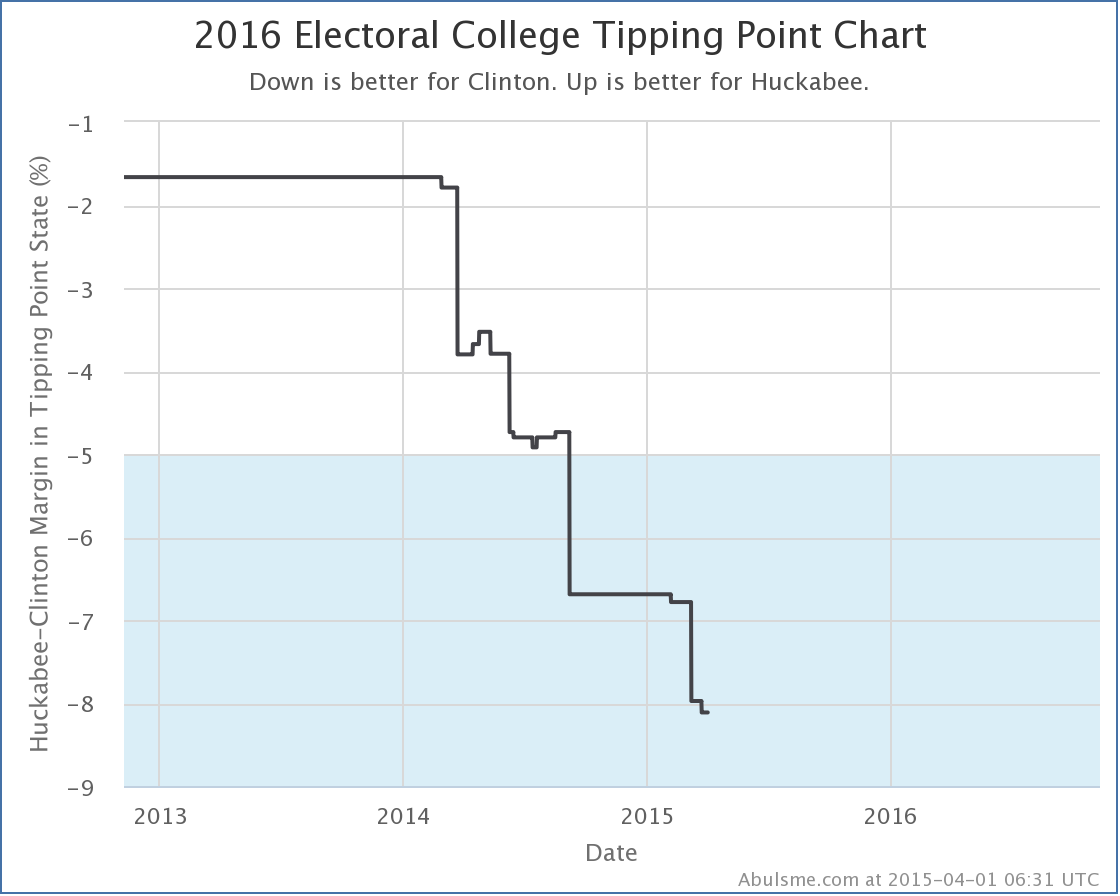
Then Clinton vs Huckabee. Ohio moves further toward Clinton, and the topping point shifts from Clinton by 8.0% in Virginia, to Clinton by 8.1% in Ohio.
Finally, the one move in the directions of the Republicans today. Ohio moved in Paul’s direction with todays update… the poll average went from a 9.2% Clinton lead to a 7.6% Clinton lead, which was enough to move the tipping point from Clinton by 8.8% in Virginia to Clinton by 8.5% in Wisconsin.
Lets look a second at the comparison of the tipping point for all five of the best polled candidate pairs:
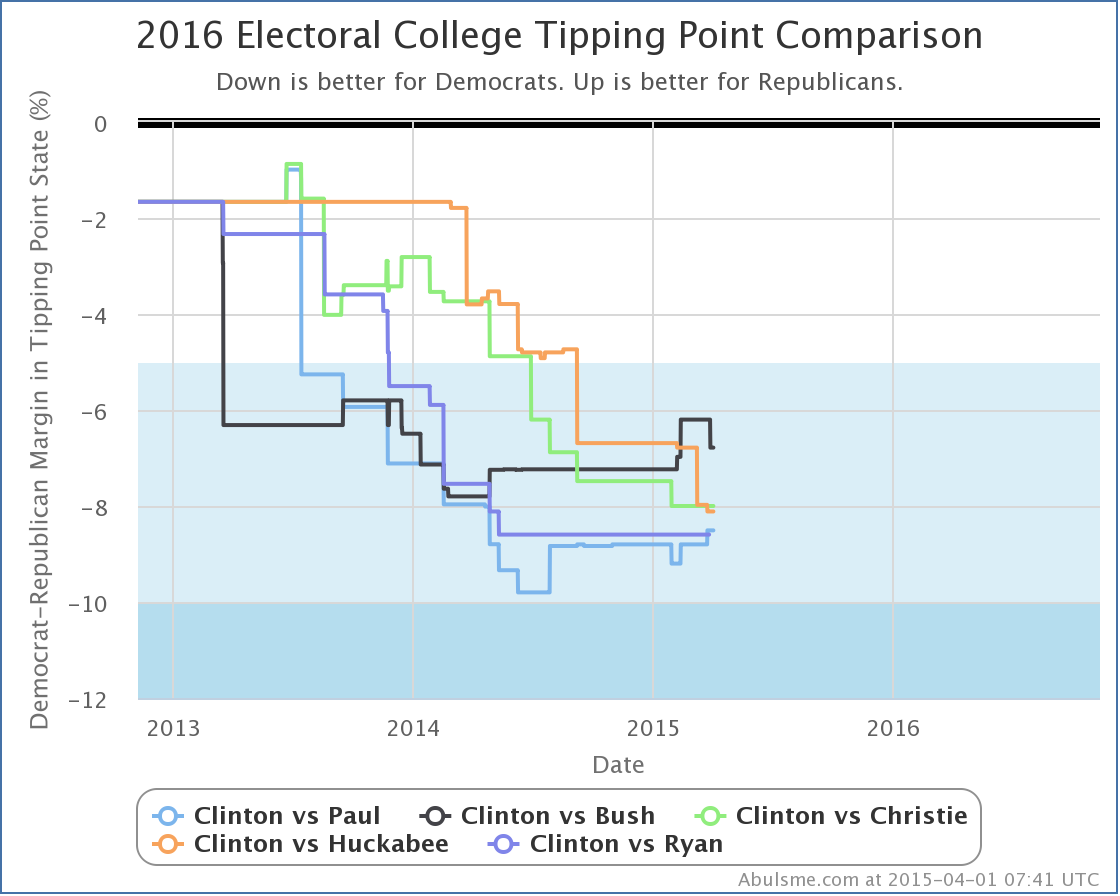
Since the November elections, we have Bush and Paul up while Christie and Huckabee are down. (No movement on Ryan, but there has been sparse polling on him since he said he was not running… we still have better polling on Ryan than on Cruz, Rubio or Walker though.)
So, there has been some press lately on how Clinton’s email issues have hurt her at the polls. There has also been press saying it hasn’t had any significant effect. National polls would of course register short term changes much much more quickly that the state polling I look at here, where even the best polled states only get polled a little more than once a month. It really is too soon for effects of that particular thing to show strongly in the kind of analysis I do here. Until we get to the last few months before the election, you’ll be able to see long term trends here, but not short term reactions to individual events in the news cycle. For the moment, there aren’t any strong trends here to call out. There has been movement, but not a whole lot, and it depends on which Republican you look at.
For the top five candidate pairs, the overall situation now looks like this:
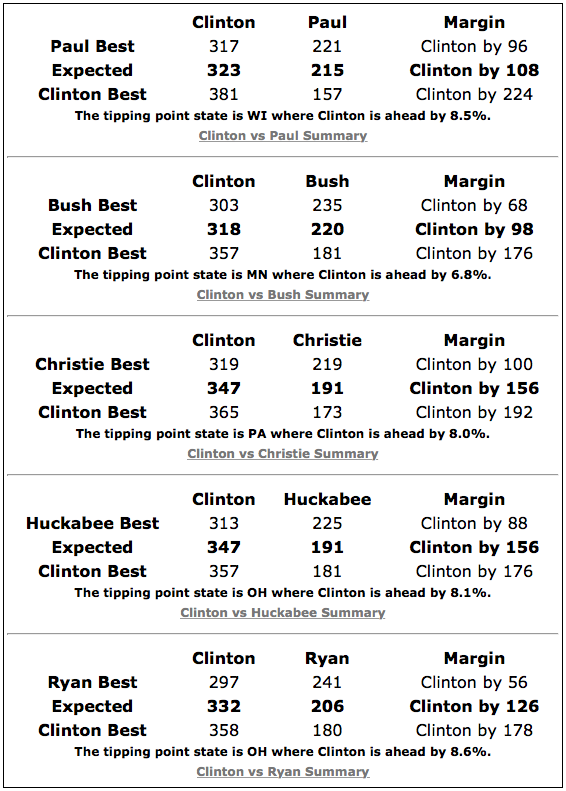
One comparison that I haven’t done in awhile here is looking at these numbers vs 2012. The final result in 2012 was Obama 332 to Romney 206, or Obama by 126.
So while all five Republicans here are currently well behind Clinton in the expected electoral college outcome, both Bush and Paul are doing better against Clinton than Romney did against Obama!!
So while Clinton still has a healthy lead here, we’re nowhere near landslide territory or anything like that. Remember that a 10% tipping point margin (a relatively huge lead) still means the results of the election can be flipped if just 5% of the people change their minds (or don’t turn up to vote, or whatever).
If this was a few days before the election and Clinton had these kinds of numbers, it would be foolish to bet against her winning. But it is 587 days until the election. There is a long long way to go. Polls at this stage are NOT predictive of the results at the end of the process. They are only a snapshot of what things look like TODAY, which gives you an idea how much work the candidate that is behind would have to do to win. (Or alternately, how much the candidate who is ahead can afford to screw up.)
As I mentioned in my last update there is a lot of interest in a few other candidates too. Right now Clinton vs Cruz is the 6th best polled combo, Clinton vs Rubio is at #7, and Clinton vs Walker is at #8. You can click through on those links if you want to see what those look like at the moment. But the amount of state level polling on those guys still isn’t that great (although they are catching up), so take what you see there with a big lump of salt.
Note: This post is an update based on the data on my 2016 Electoral College Analysis Site. All of the charts and graphs seen here are from that site. Graphs, charts and raw data can be found there for the race nationally and in each state for every candidate combination that has been polled at the state level. In addition, comparisons of the best polled candidate combinations both nationally and each in each state are available. All charts above are clickable to go to the current version of the detail page the chart is from, which may contain more up to date information than the snapshots on this page, which were current as of the time of this post.
[Blog Post] “Electoral College: Four moves toward blue, one toward red” http://t.co/noX0p5qwBr
Or . . .
The National Popular Vote bill would guarantee the presidency, to the candidate who receives the most popular votes in the country.
Every vote, everywhere, would be politically relevant and equal in presidential elections. No more distorting and divisive red and blue state maps of pre-determined outcomes. There would no longer be a handful of ‘battleground’ states where voters and policies are more important than those of the voters in 80% of the states that now are just ‘spectators’ and ignored after the conventions.
The bill would take effect when enacted by states with a majority of Electoral College votes—that is, enough to elect a President (270 of 538). The candidate receiving the most popular votes from all 50 states (and DC) would get all the 270+ electoral votes of the enacting states.
The bill has passed 33 state legislative chambers in 22 rural, small, medium, large, red, blue, and purple states with 250 electoral votes. The bill has been enacted by 11 jurisdictions with 165 electoral votes – 61% of the 270 necessary to go into effect.
NationalPopularVote.com