Another day with more Iowa and New Hampshire polls. This time no status changes in the five best polled candidate combinations in New Hampshire, but there were a couple of changes to talk about in Iowa. One of these favors Clinton, the other favors her Republican opponent. Lets take a look.
Clinton vs Trump
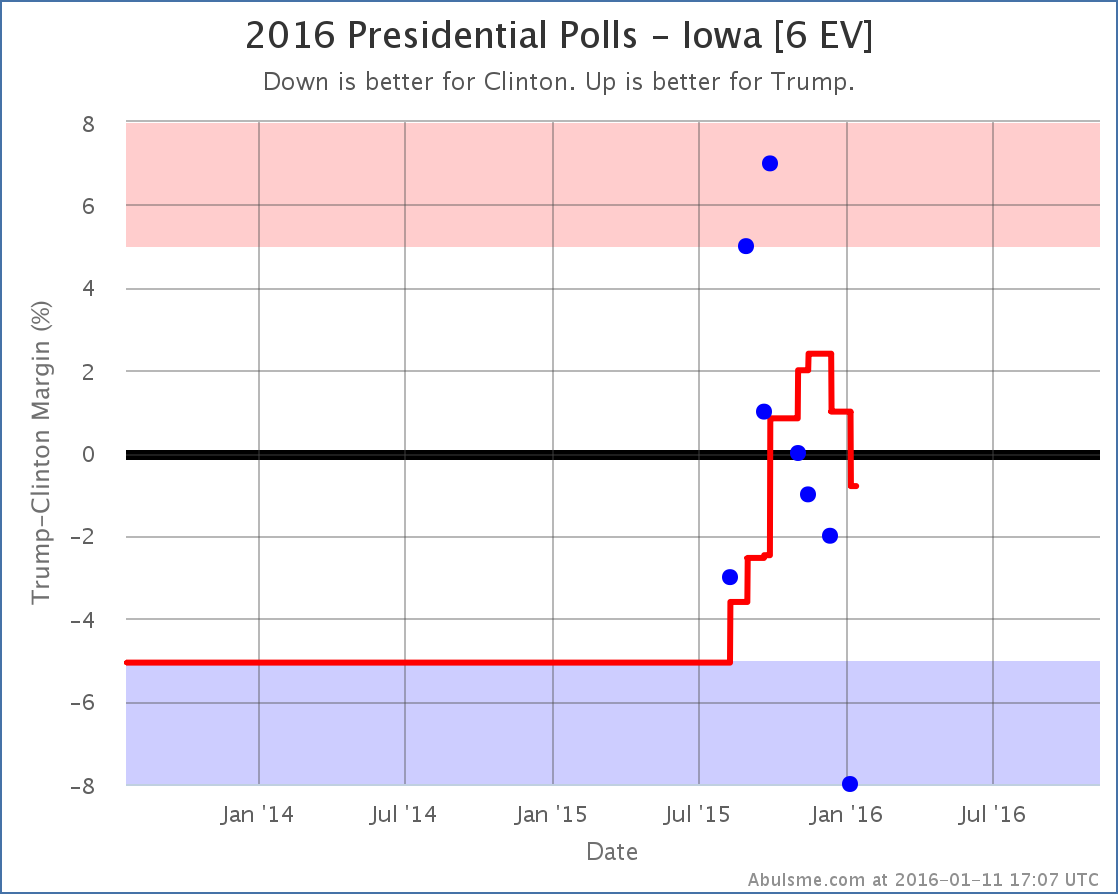
At the end of September after a series of good polls vs Clinton in Iowa, Trump had taken the lead in the Iowa poll average. Since then Trump hasn’t done quite as well, and with today’s addition of a Marist poll showing Clinton with up by 8%, the poll average once again shows a Clinton lead in Iowa.
Clinton’s is only ahead by 0.8%, which means Iowa is still close and could easily go either way. The five polls included in the average range from Clinton up by 8% to Trump up by 7%. That is a pretty big range!
The average puts Iowa in the “Weak Clinton” category though, so we give it to Clinton in the “expected case” for the moment. The updated national electoral college bubble looks like this:
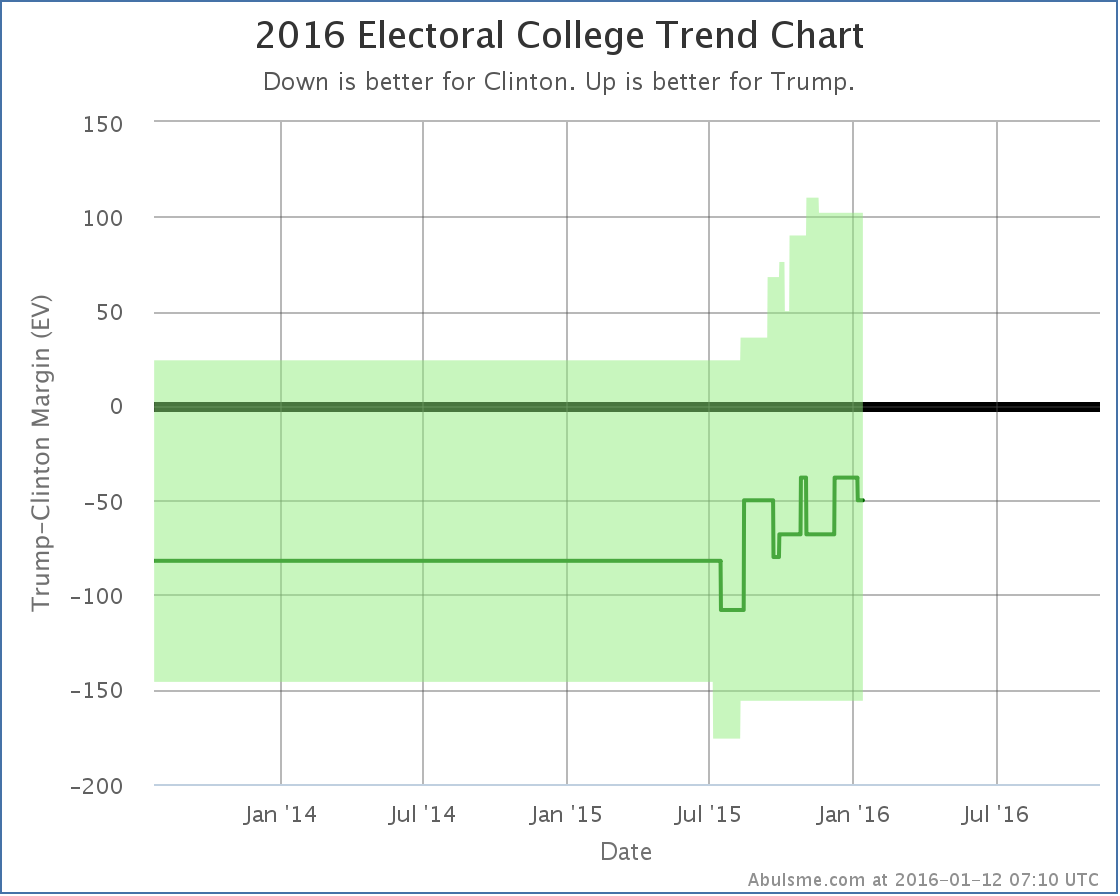
The last tick downward in the green center line is Iowa flipping to Clinton, which puts the “expected” Clinton vs Trump case at a 50 electoral vote Clinton win. But there are many close states still, so anything from a 156 electoral vote Clinton win to a 102 electoral vote Trump win would be within the realm of possibility given current state level polling.
This just goes to reiterate the point I made last month: “Do Not Underestimate Trump“. Conventional wisdom is that if the election comes down to Clinton vs Trump, it would be a Clinton runaway win, but poll data just does not show that right now.
(Insert usual comments here about how far we have until the election and how none of this is predictive yet. It only shows us a bit about how things look NOW, and even then only imperfectly due to the relative sparseness of state level polling.)
Clinton vs Cruz
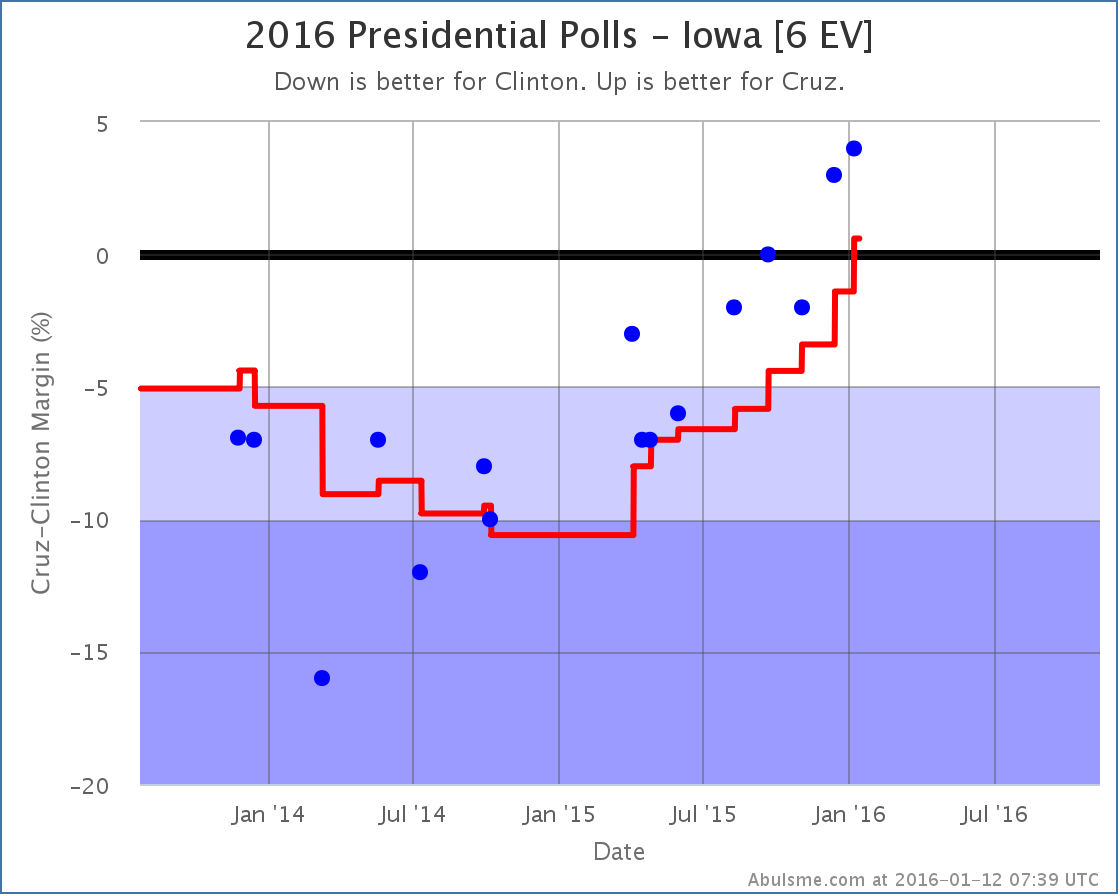
Unlike Trump, who rose for awhile and then has been falling, Cruz has been consistently improving in Iowa for the last year. With today’s update, he takes the lead in the poll average. It is just a 0.6% lead, but it is a lead, and we give him the state for now.
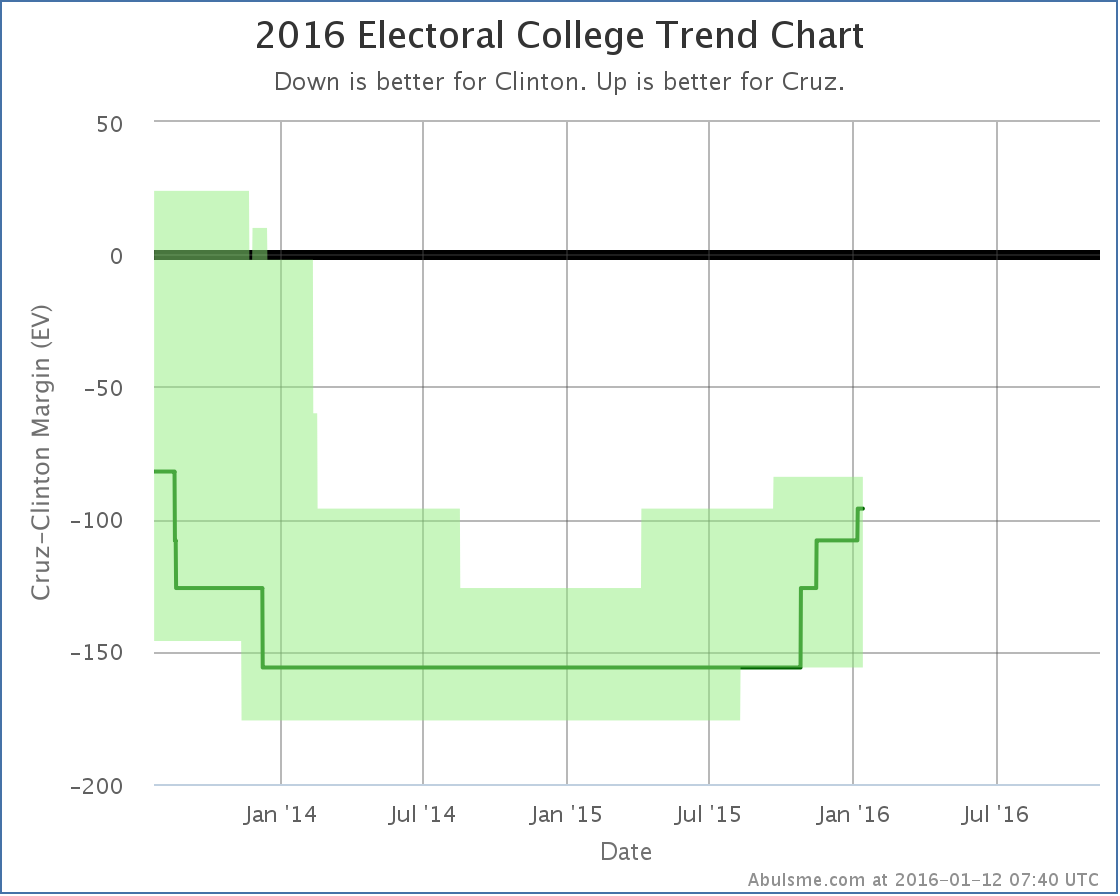
This brings Cruz up to… losing by 96 electoral votes to Clinton. Unlike Trump though, if you give him all the close states as well, it is still a loss to Clinton, just by only 84 electoral votes, which is still a pretty substantial Clinton win. Right now, Cruz is not “within range” of Clinton, while Trump is.
This is based on state level polls though, which at this point in the cycle lag national polls. The RCP average for Clinton vs Cruz shows Cruz ahead at the moment. If there indeed is a big enough move toward Cruz that he starts to be competitive, it will show up in the state level polls soon enough. That isn’t evident from the state data yet, but I can say that Cruz is competitive in Iowa, and currently has a very slight lead there.
Others
I don’t talk much about candidate combinations beyond the top five best polled, as their polling data is generally sparser, but just to note them in passing… Today’s batch of polls also flips New Hampshire from Clinton to Rubio, strengthens the Sanders lead over Cruz in New Hampshire, and moves the national tipping point in Sanders vs Trump further toward Sanders.
We’re going to see the pace of polling increasing dramatically as the primary season gets underway. As soon as we have clear front runners in both parties, we’ll stop seeing any polling at all for the other candidates and it will all be about the final general election match ups. Over the next couple months we’ll get to see just how quick that transition is.
301.7 days until the general election polls start to close.
Note: This post is an update based on the data on ElectionGraphs.com. All of the charts and graphs seen here are from that site. Graphs, charts and raw data can be found there for the race nationally and in each state for every candidate combination that has been polled at the state level. In addition, comparisons of the best polled candidate combinations both nationally and each in each state are available. All charts above are clickable to go to the current version of the detail page the chart is from, which may contain more up to date information than the snapshots on this page, which were current as of the time of this post. Follow @ElecCollPolls on Twitter for specific poll details as I add them. And like Election Graphs on Facebook!