This is the website of Abulsme Noibatno Itramne (also known as Sam Minter). Posts here are rare these days. For current stuff, follow me on Mastodon

Categories

Calendar

Republicans: Still in the contested zone… barely

When I did my last update there hadn’t been any recent polls in either Arizona or Utah, but the results there ended up matching pretty well with the results of the few polls that came out since then. Namely, Trump won Arizona which was straight up winner take all, and Cruz got over 50% in Utah, so he got all of the delegates there.

So the net for the night was Trump +58, Cruz +40.

Adding in other delegate adjustments since the March 15th results we have a net change of:

Trump +62, Cruz +43, Rubio -3

So effectively, Trump got 60.78% of the delegates since the last update. He only needed 53.07% to improve his position.

So what does this look like?

chart-85

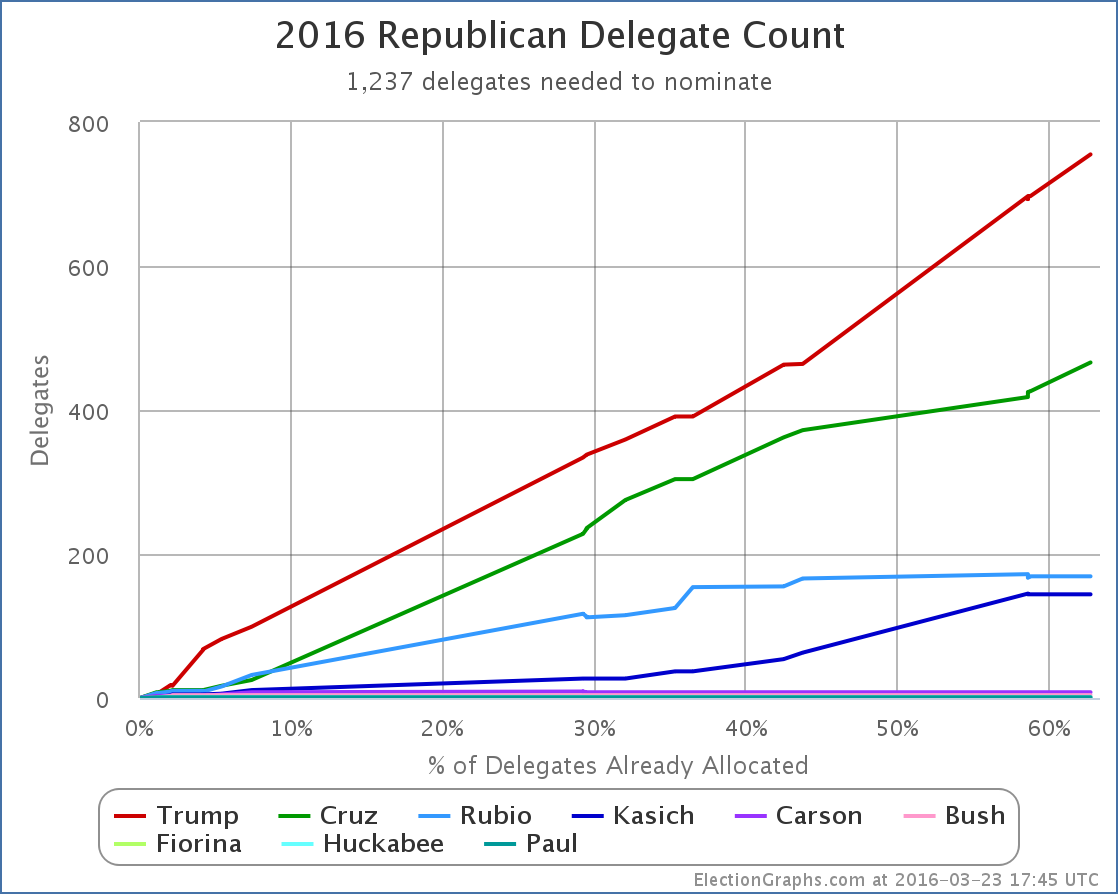
The raw delegate count is now Trump 755, Cruz 466, Rubio 169, Kasich 144, Carson 8, Bush 4, Fiorina 1, Huckabee 1, Paul 1

Trump’s pace of delegate accumulation actually looks like it has accelerated, while everybody else has slowed down.

But the raw delegate counts are not the right thing to look at.

chart-86

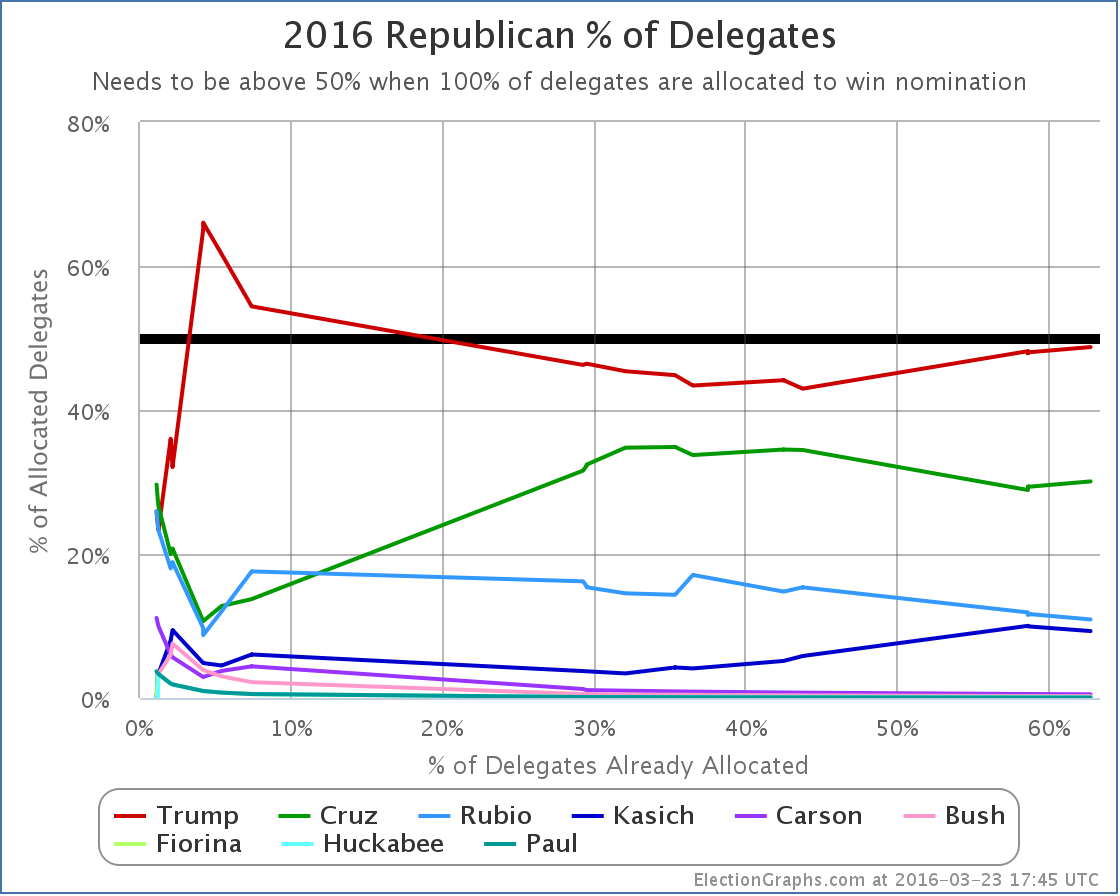
In percentages of the delegates so far, both Trump and Cruz improved. But of course Cruz is nowhere near the 50% line. Trump meanwhile is now at 48.74%. He doesn’t have a majority. Close. Very close. But not quite.

But % of delegates so far isn’t the right thing to look at either.

chart-87

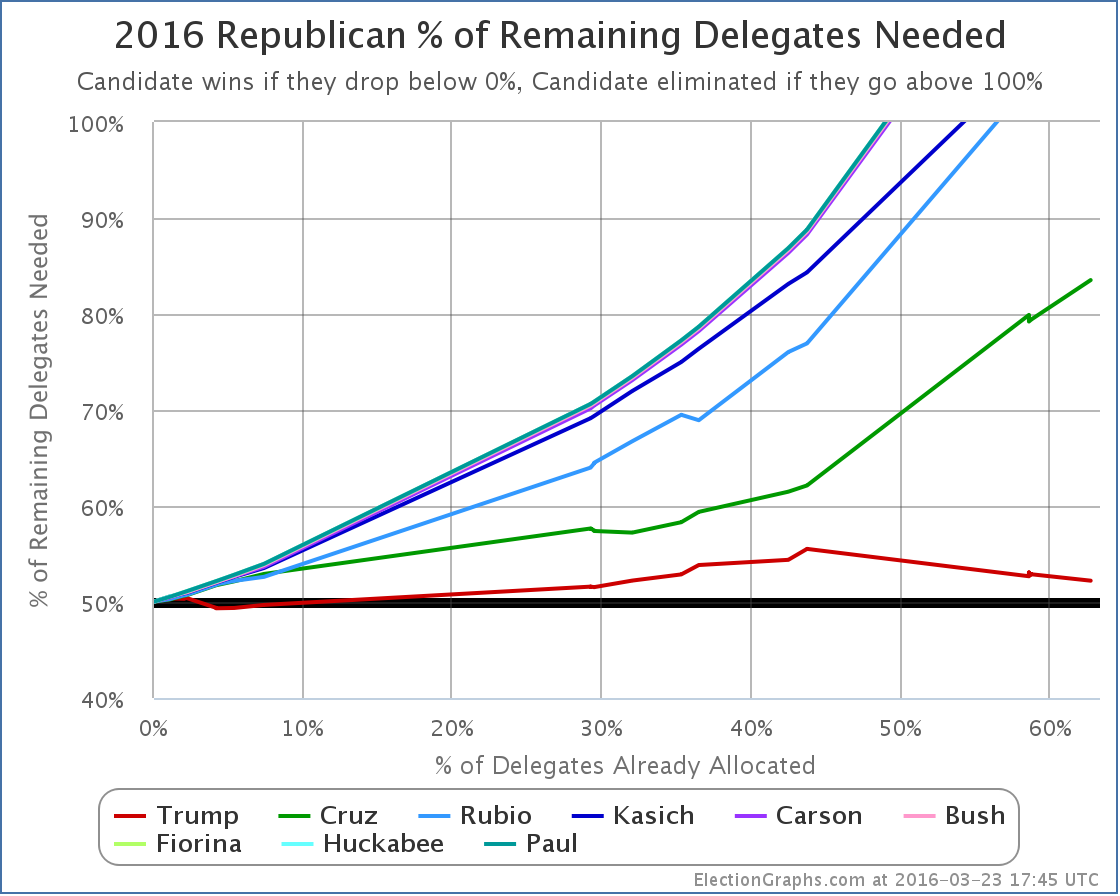
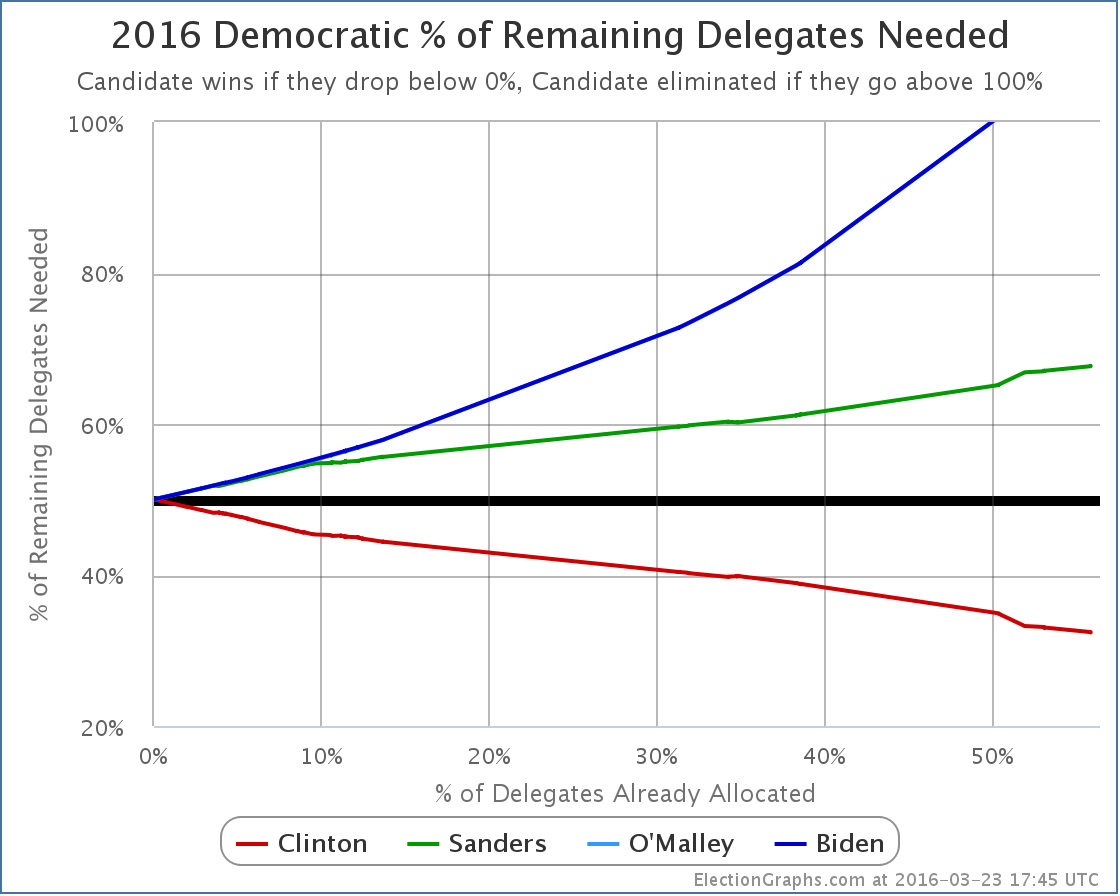
This is the real graph to watch. The percentage of the remaining delegates that Trump needs to win in order to get to the convention with a majority of delegates. This has been dropping in the last couple of contests.

Trump now needs 52.22% of the remaining delegates to win the nomination outright.

Now, some of those “remaining delegates” are 18 delegates who have already been selected as officially “uncommitted” delegates, and there will be more uncommitted delegates coming out of some of the states that have yet to vote. Probably a few dozen to as many as 100. These delegates are essentially like the Democratic superdelegates in that they can vote however they feel like and are not bound to the results of any primaries or caucuses.

If you wanted to calculate the percentage Trump would need without uncommitted delegates, it would be higher. But just like superdelegates are part of the process on the Democratic side, uncommitted delegates are part of the process on the Republican side, and to get a fair picture you need to include them.

You just have to realize that winning not only includes earning pledged delegates, but also convincing uncommitted delegates to vote for you.

It is a real possibility that we could get to the end of the primaries and caucuses in June without knowing if Trump has an outright win, or if he’ll come up short on the first ballot at the convention. It might end up depending on what those uncommitted delegates decide to do.

We are still right on the edge between a Trump win and a convention where nobody wins on the First ballot. And which way that goes may end up depending on the uncommitted delegates. What percentage of the uncommitted delegates Trump would need… if he even needs them at all… will depend on how he continues to do in getting pledged delegates between now and June.

But meanwhile, the pace of primaries and caucuses now slows down quite a bit. So there will be a lot of waiting before we know.

[Update 2016-04-01 17:15 UTC – Alaska gave back Rubio’s delegates after he asked, and Oklahoma finalized their results. Net change: Rubio +4, Cruz -2, Trump -3. This does not substantially change the analysis above.]

[Update 2016-04-04 05:43 UTC – Most of Colorado’s delegates will be determined next weekend, but the 6 representing the 1st and 6th congressional districts were determined this weekend, and all 6 went to Cruz. With this and the change above, Trump’s percentage of remaining needed to win is up to 52.83%. Adding this note here rather than doing a full post on those six delegates.]

[Update 2016-04-04 14:15 UTC – As of April 4th there were 28 “unbound” Republican delegates, with more to come soon. These are free agents like the Democratic superdelegates. I have started to track them individually when there is evidence of a known preference. So far, adding them in nets: Cruz +3, Trump+2.]

[Update 2016-04-06 02:01 UTC – Added in tentative evaluations of the uncommitted delegates from North Dakota. Net: Cruz +7, Trump +1, Kasich +1.]

Note: This post is an update based on the data on ElectionGraphs.com. Election Graphs tracks both a poll based estimate of the Electoral College and a numbers based look at the Delegate Races. All of the charts and graphs seen in this post are from that site. Additional graphs, charts and raw data can be found there. All charts above are clickable to go to the current version of the detail page the chart is from, which may contain more up to date information than the snapshots on this page, which were current as of the time of this post. Follow @ElectionGraphs on Twitter or like Election Graphs on Facebook to see announcements of updates or to join the conversation. For those interested in individual general election poll updates, follow @ElecCollPolls on Twitter for all the polls as they are added.

Democrats: Sanders wins the 22nd by 74 to 57. It isn’t enough.

With Arizona, Idaho and Utah weighing in, Sanders won 74 delegates to Clinton’s 57. That’s a big win for Sanders. But it is only 56.49% of the delegates. To actually improve his overall position, Sanders would have needed 67.06% of the delegates. He didn’t reach that level, so the Sanders path to the nomination gets even harder.

chart-84

Also including an additional Sanders superdelegate that was added to the totals since the last update, Sanders now needs 67.70% of the remaining delegates to catch up and win. Or, as usual, a huge number of Clinton superdelegates changing their minds could change everything. That seems increasingly unlikely the closer Clinton gets to the nomination of course. But if it happens, you’ll see it here.

[Update 3/26 21:14 UTC – Updates in preparation for new results tonight. Superdelegate changes: Sanders +4. Updates from FL/GA/AZ net: Sanders +4, Clinton -4.]

Note: This post is an update based on the data on ElectionGraphs.com. Election Graphs tracks both a poll based estimate of the Electoral College and a numbers based look at the Delegate Races. All of the charts and graphs seen in this post are from that site. Additional graphs, charts and raw data can be found there. All charts above are clickable to go to the current version of the detail page the chart is from, which may contain more up to date information than the snapshots on this page, which were current as of the time of this post. Follow @ElectionGraphs on Twitter or like Election Graphs on Facebook to see announcements of updates or to join the conversation. For those interested in individual general election poll updates, follow @ElecCollPolls on Twitter for all the polls as they are added.

[Edit 18:14 to fix the date in the title.]

Electoral College: Trump expected case vs Clinton hits new low

Since the last electoral college update there have been new polls in New York, Arizona, Utah and North Carolina. But the only notable change is in North Carolina:

chart-82

With the latest polls, North Carolina moves from just barely Trump, to just barely Clinton. Either way, it is very close… and it has been bouncing back and forth since last fall. North Carolina is not necessarily showing any sort of trend here. Bottom line it is just a close state in this race.

But for the moment, this puts North Carolina back in Clinton’s column if everybody just wins all the states they are ahead in. So looking at the national picture:

chart-83

Screen Shot 2016-03-23 at 03.33.03577

The Clinton vs Trump “Expected Case” has been moving toward Clinton since January. With this update, Trump’s expected case is worse than it has been since Clinton vs Trump polling began.

Now, all the states in the “bubble” are by definition close. They could flip back. But this is starting to look like it might be a real trend and not just noise.

Right now, the expected case sits at Clinton 338, Trump 200… a 138 electoral vote margin for Clinton. For comparison, the Obama-Romney margin was 126 electoral votes.

There are eight states that are “close” right now. But seven of these eight are now leaning Clinton. And the one remaining state (Colorado) has only ONE actual Clinton vs Trump poll (from back in November), the average is still based mostly on how the state has gone in previous election years. It is certainly starting to look like most of the “traditional” battleground states are turning blue in this matchup. Again though, these states are close, and they might easily bounce back to Trump.

The range of reasonable possibilities is large here. Allowing all eight states to swing to one side or the other you get a range from Clinton winning by 156 to Trump winning by 70. Anything is still possible here.

But if Clinton vs Trump continues to look like the most likely combination, then we will probably also start getting more polling in the “Strong Trump” group of states. These have been very lightly polled and are still significantly based on previous election results, and the polls we do have tend to be older at this point. Given the trends in other states, perhaps some of these aren’t actually as “Strong Trump” as they initially seem. Or maybe they are. We shall see.

230.8 days until polls start to close. Things will be moving back and forth the whole time. Stay tuned.

Note: This post is an update based on the data on ElectionGraphs.com. Election Graphs tracks both a poll based estimate of the Electoral College and a numbers based look at the Delegate Races. All of the charts and graphs seen in this post are from that site. Additional graphs, charts and raw data can be found there. All charts above are clickable to go to the current version of the detail page the chart is from, which may contain more up to date information than the snapshots on this page, which were current as of the time of this post. Follow @ElectionGraphs on Twitter or like Election Graphs on Facebook to see announcements of updates or to join the conversation. For those interested in individual general election poll updates, follow @ElecCollPolls on Twitter for all the polls as they are added.

[Update 2016-03-23 18:18 to Fix Article title to Electoral College]

@ElectionGraphs tweets from 2016-03-22 (UTC)

@ElecCollPolls tweets from 2016-03-22 (UTC)

@abulsme tweets from 2016-03-22 (UTC)

Democrats: Sanders wins Democrats Abroad

Just a small number of delegates, but we did finally get results from the Democrats Abroad primary that was held earlier in the month:

Sanders 9, Clinton 4.

With this change alone, Sanders did get a high enough percentage of delegates (69.2%) that his “% of remaining delegates needed to win” would have improved. But there were other delegate changes in the six days since the last primary results as well.

The last Democratic post was done while many delegates from Florida and Illinois were still to be determined, because for some reason those states were super slow and it took about two days for everything to be settled. That info was added to that post as an update, but for completeness here, from those final updates, Clinton gained 85 more delegates and Sanders added 43. In addition there were superdelegate updates. Net superdelegate change was Clinton +5, Sanders +0.5. The half delegate is from a Democrats Abroad superdelegate, who only gets a half vote.

With all that, the Democrats Abroad results are actually overwhelmed by the other updates and the new totals are:

Clinton 1644, Sanders 882.5, O’Malley 1

Translating that into the all important “% of remaining delegates needed” graph:

chart-81

As of now, Clinton needs 33.03% of the remaining delegates to win. Sanders needs 67.06%.

That includes superdelegates of course, and superdelegates can change their minds. If Clinton superdelegates defect to Sanders, Clinton would need more and Sanders would need less. Such defections have been very rare so far however. If they do start to happen, you’ll see it in these charts.

Until then though, this is where we sit. Up next: Arizona, Utah and Idaho.

[Update 2016-03-23 01:34 – Superdelegate scan, Net Sanders +1]

Note: This post is an update based on the data on ElectionGraphs.com. Election Graphs tracks both a poll based estimate of the Electoral College and a numbers based look at the Delegate Races. All of the charts and graphs seen in this post are from that site. Additional graphs, charts and raw data can be found there. All charts above are clickable to go to the current version of the detail page the chart is from, which may contain more up to date information than the snapshots on this page, which were current as of the time of this post. Follow @ElectionGraphs on Twitter or like Election Graphs on Facebook to see announcements of updates or to join the conversation. For those interested in individual general election poll updates, follow @ElecCollPolls on Twitter for all the polls as they are added.

@abulsme tweets from 2016-03-21 (UTC)

@ElectionGraphs tweets from 2016-03-20 (UTC)

@ElecCollPolls tweets from 2016-03-20 (UTC)

Edit 2016-03-22 12:29 UTC to remove accidental duplicate tweets of three of the polls.