States with new poll data added since the last update: All 50 states and DC. Multiple times each. Notable changes in Florida, North Carolina, Ohio, Iowa, Pennsylvania, Kansas, Colorado, Wisconsin, Maine (All), and Georgia.
There have been tons of polls, including “50 state” polls from three different sources, one of which had weekly data going back four weeks that needed to be added. There were many shifts caused by this batch of polls. We’ll look at all the charts, but lets start with the headline:
The Romney Barrier
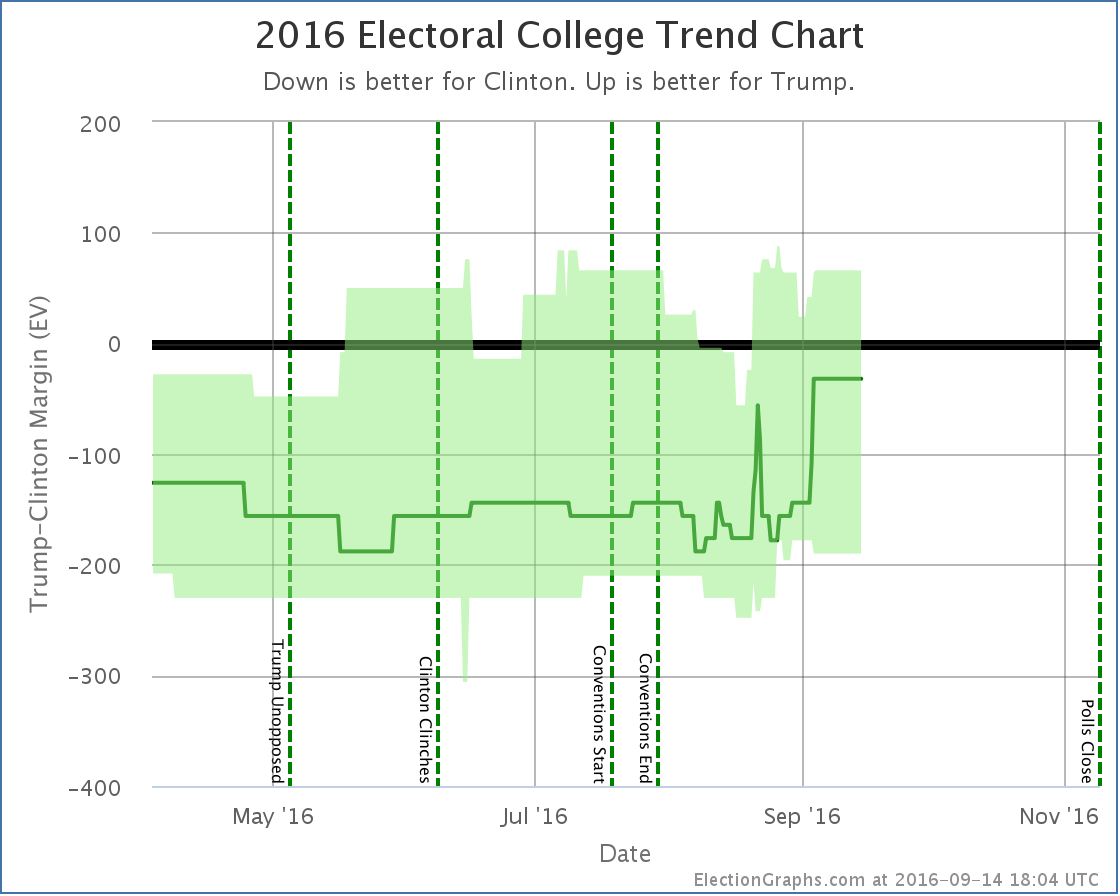
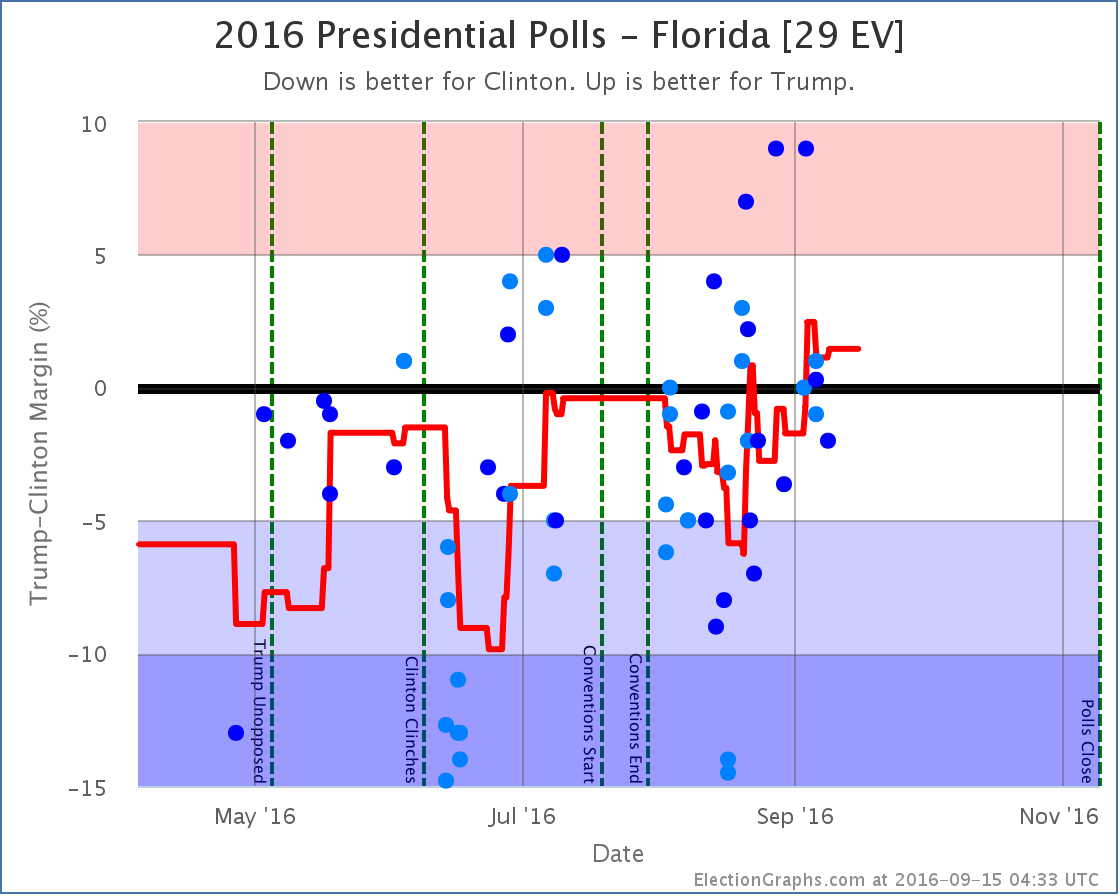
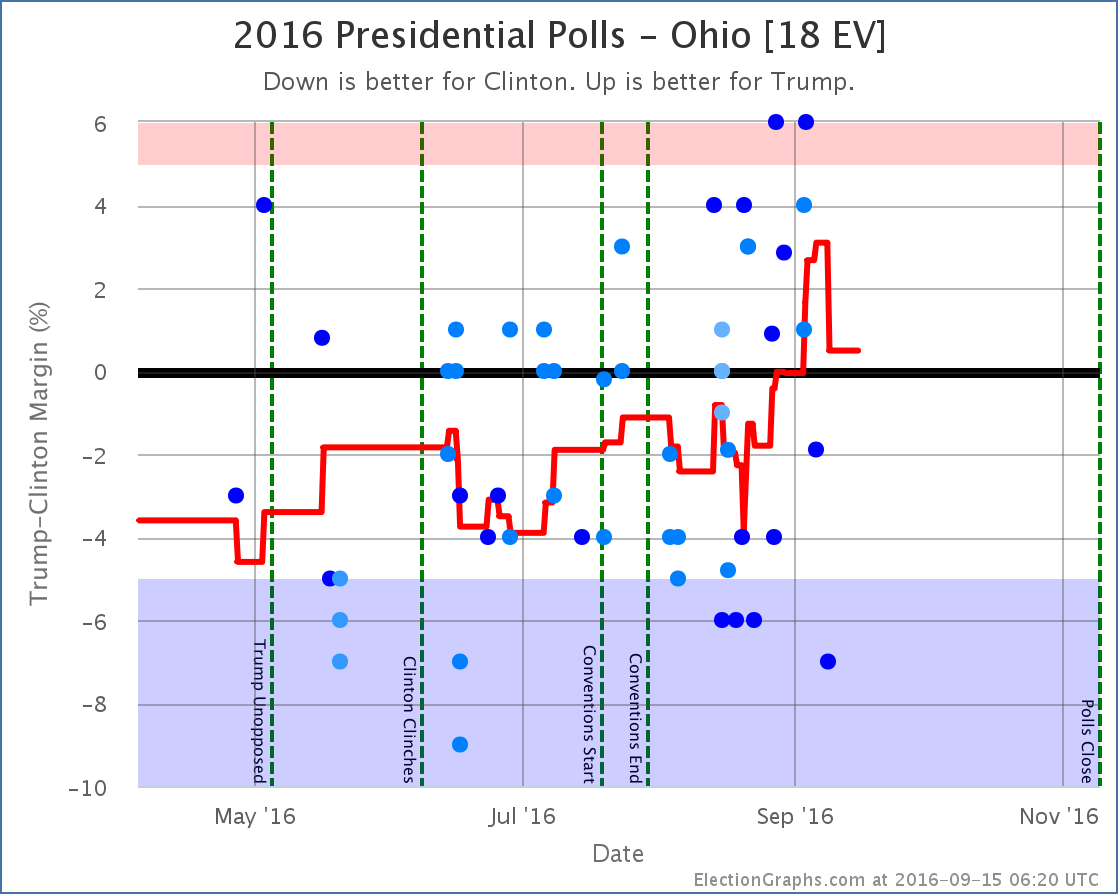
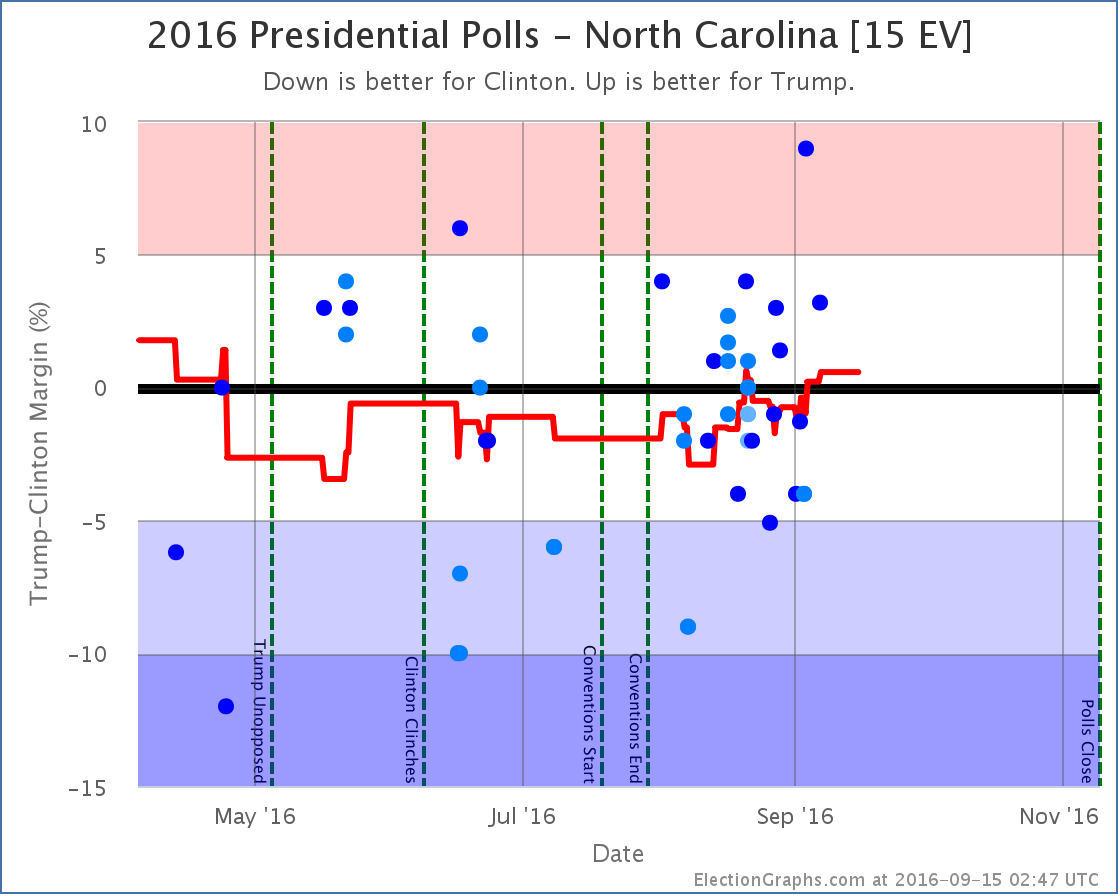
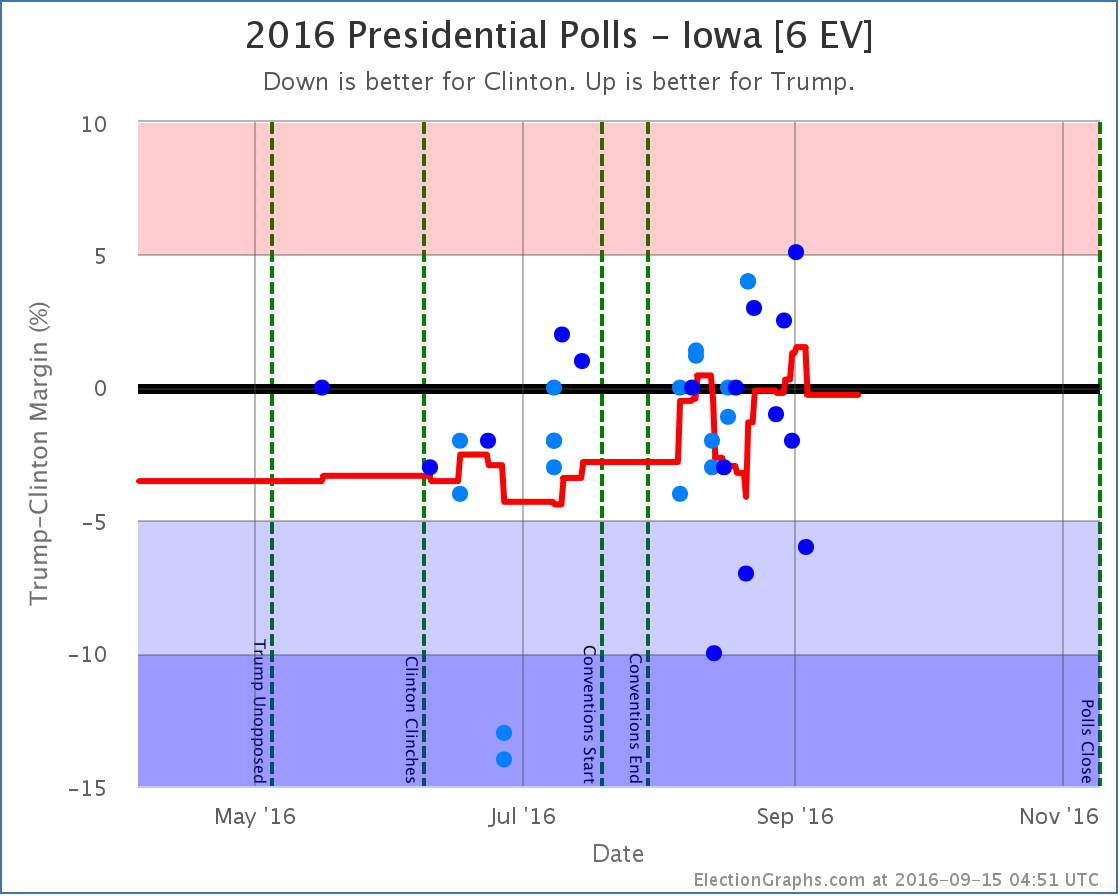
The averages in Florida, Ohio, and North Carolina all moved from Clinton to Trump. Iowa did move in the opposite direction, but it is much smaller, so the net change was dramatically toward Trump.
Before this batch of changes, the “expected” result if everybody won the states they lead was Clinton 341 to Trump 197… a 144 electoral vote win for Clinton.
With this batch of polls, the expected result is now Clinton 285 to Trump 253. This is still a Clinton win, but now by only 32 electoral votes.
From February onward this race had been stuck in the zone with Trump losing by margins between McCain’s loss (192 electoral votes) and Romney’s loss (126 electoral votes).
For the first time since February, Trump is now looking like he would do better than Romney did. Trump now matches Romney’s map, but adds Florida and Ohio. It isn’t quite enough to win, but Trump is now closer than he has ever been… and doing better than the last two Republican candidates.
Some folks were looking at Clinton’s lead in mid-August and were trumpeting the possibility of a Clinton landslide in early August. It was just looking like a solid win for Clinton back then, not a landslide, but things have actually moved in the opposite direction. A 32 electoral college win is more like a squeaker. It would only take Michigan flipping to get us to a 269 to 269 electoral college tie.
(There were also changes in the “best cases” from a lot of states moving in both directions. Trump’s best case went from winning by 68 electoral votes to winning by 66 electoral votes. Clinton’s best case went from winning by 210 electoral votes to winning by 190. So the overall range of possible outcomes reduced.)
Tipping Point
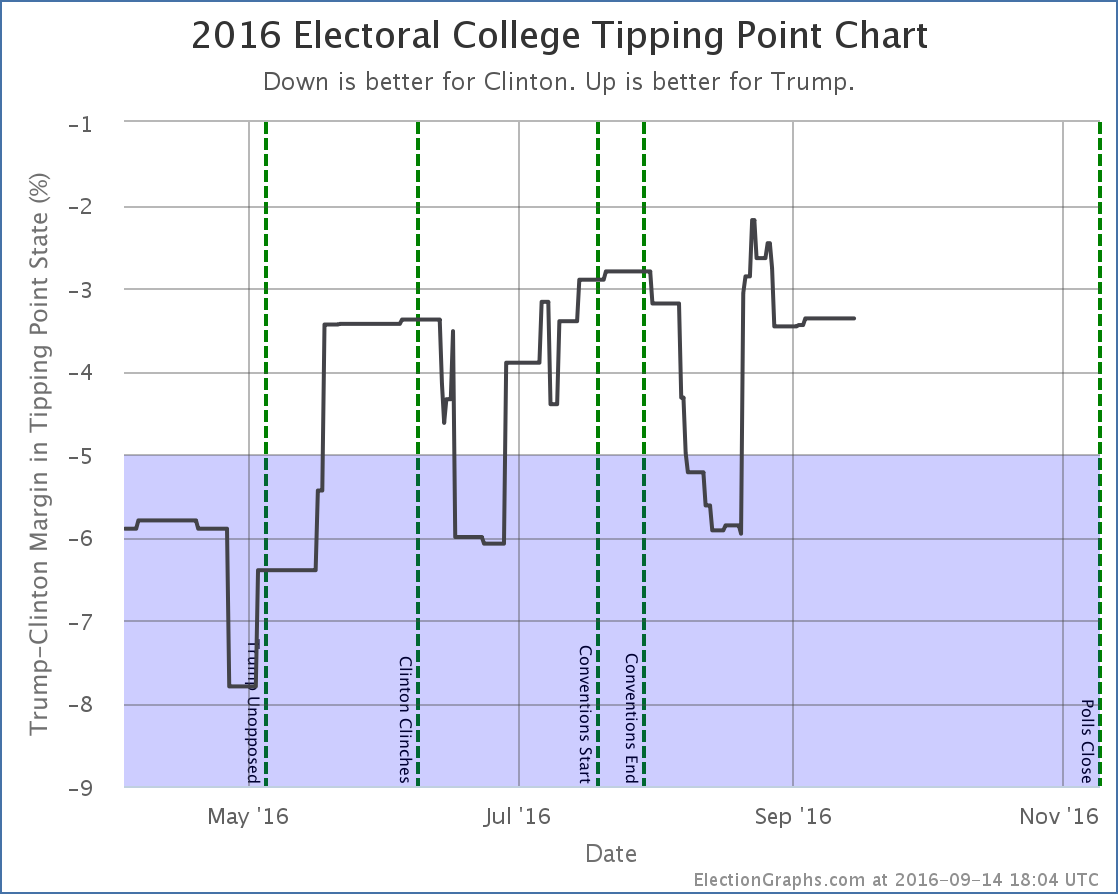
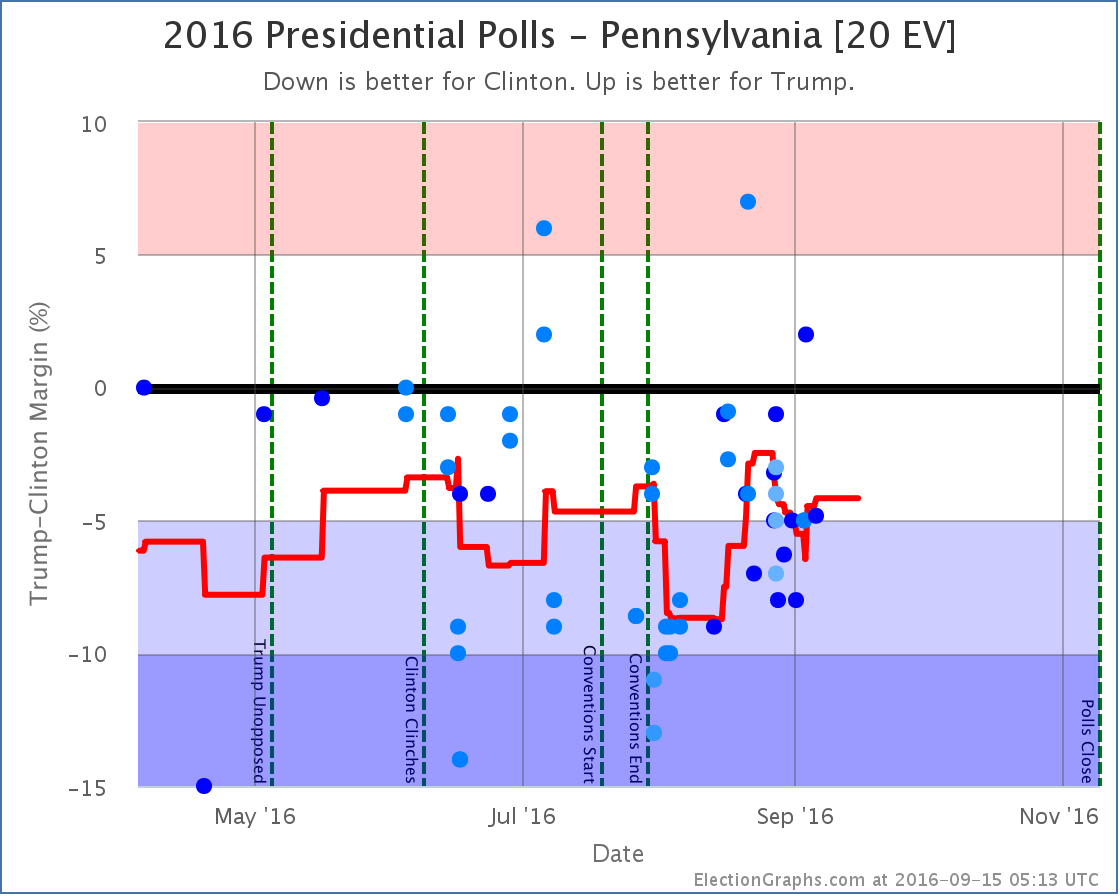
Now, despite the expected case moving in Trump’s direction, changes in Florida, Michigan, Wisconsin and Pennsylvania had the net effect of… zero. Well, to be precise the tipping point changed from a 3.4% Clinton lead in Florida to a 3.4% Clinton lead in Michigan. So the state that holds the balance shifted, but the actual percentage did not.
Looking at the trends though, rather than just the change in this update, while the expected case has clearly been moving in Trumps direction the last few weeks, the tipping point has been trending toward Clinton.
What does this mean?
At a basic level it means that while Trump has made the race closer, pulling over the next few states he needs to win is getting harder.
3.4% is still close, but if Trump is at or near his ceiling, it may be a tough last 3.4% to move.
To be absolutely clear, with all of the above Clinton is still a strong favorite. Trump has made it a lot closer than it was, but he still has a lot of work to do to pull the remaining states he would need past the line to secure an electoral college victory. It isn’t impossible. It is just very hard.
Individual States
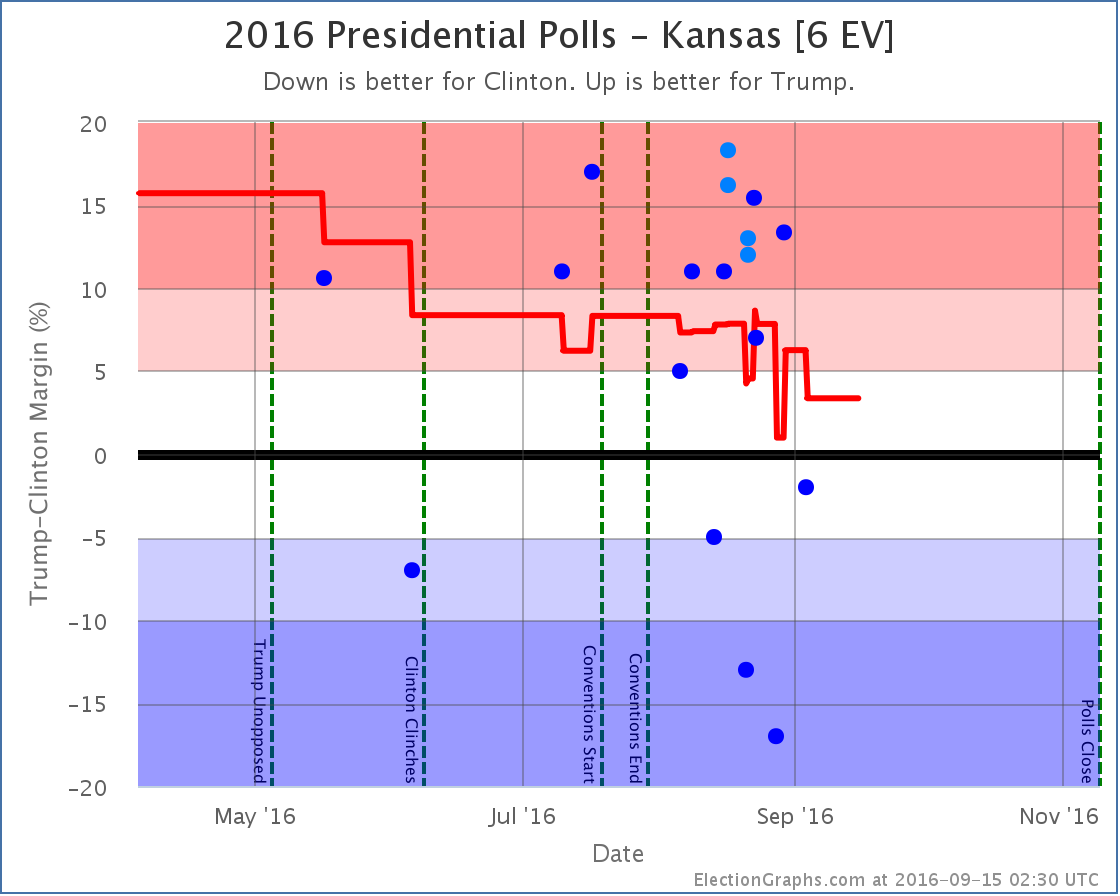
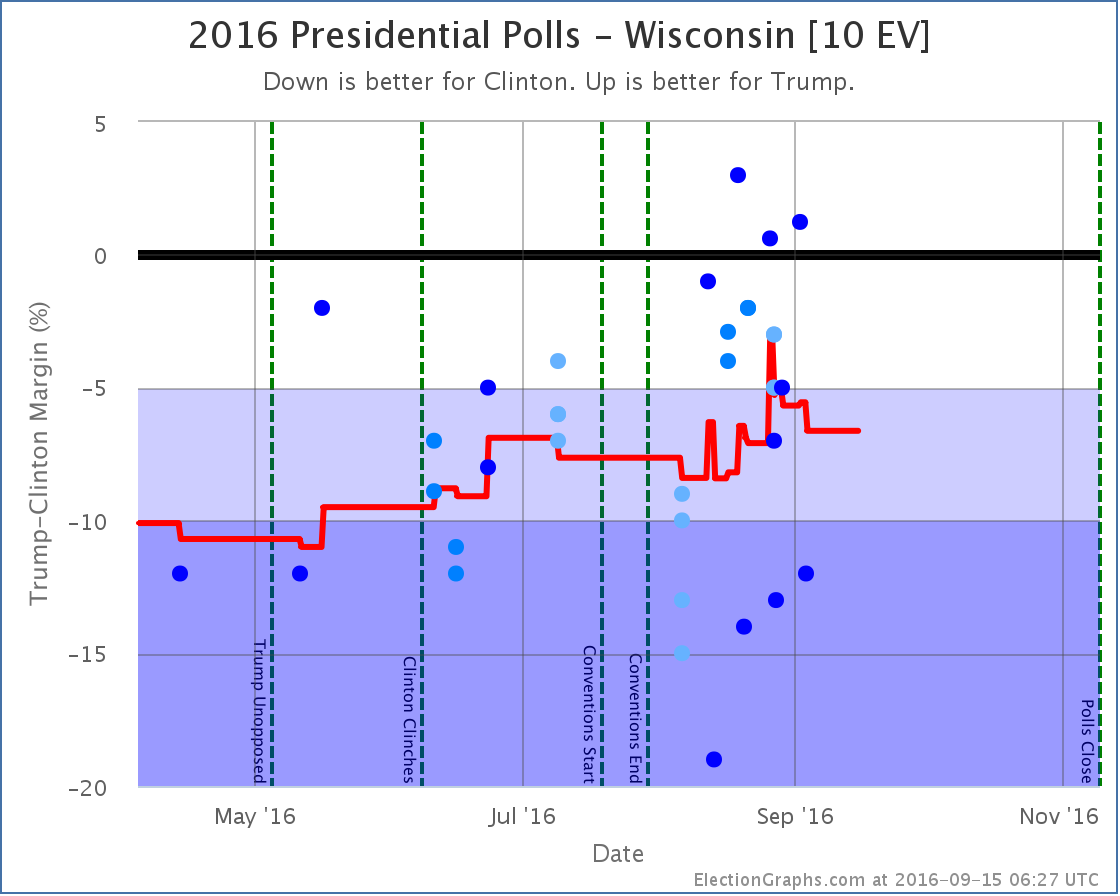
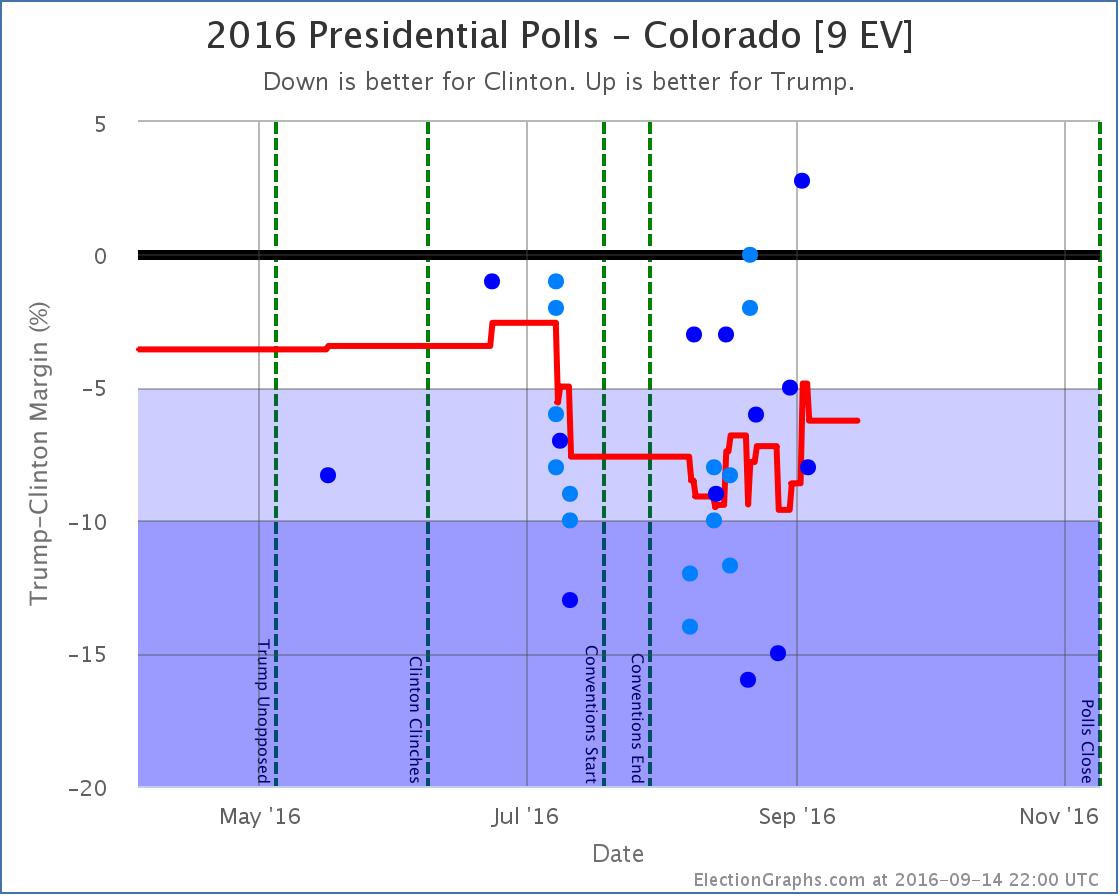
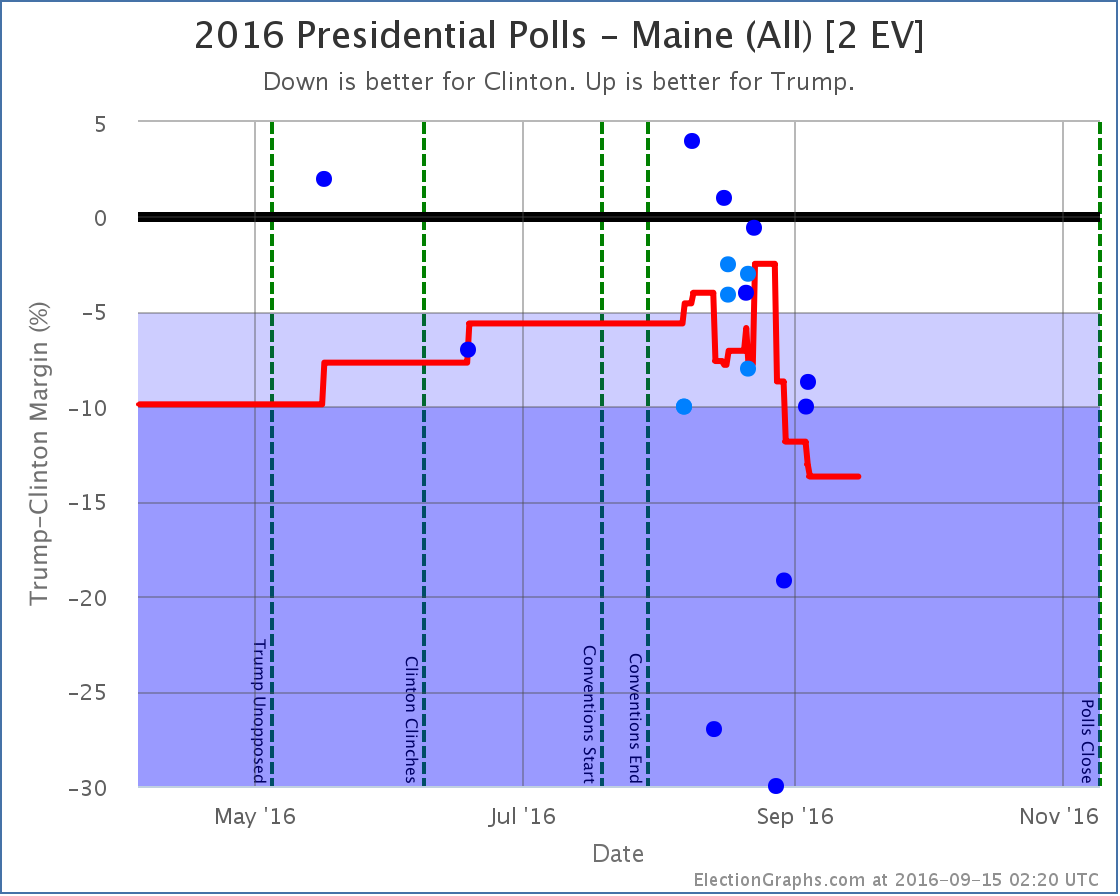
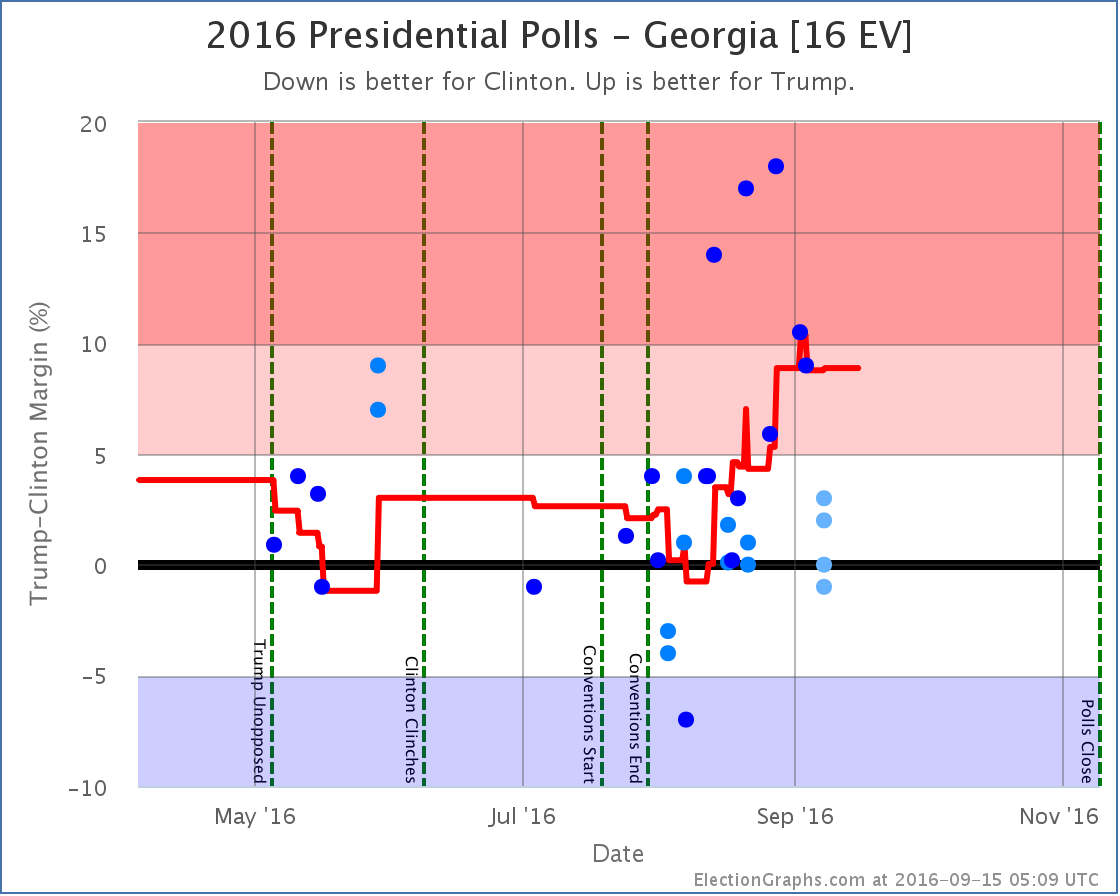
OK, with the two national summaries out of the way, time for a run down of all the states that shifted in ways that caused changes to the expected or best cases. I’ll just do a run down of all the graphs without commentary on each one. For the most part they speak for themselves. Keep an eye out for the polls that look like outliers. In some cases if new polls don’t back those up, the changes described here may reverse themselves quickly as new polls come in.
States moving from Clinton to Trump:
States moving from Trump to Clinton:
States now in play for Trump:
States now in play for Clinton:
States no longer in play for Trump:
States no longer in play for Clinton:
What’s Next
This batch of polls was huge, so in the time it took me to complete it, there have already been a bunch of new polls which I will be adding as soon as I can. Even if those polls don’t change anything, there will be polls soon enough that do. This is a dynamic race, and as I post this we have 54.7 days left until we start getting the actual results. Hang on tight, we’re in for a nice ride before we are done.
Note: This post is an update based on the data on ElectionGraphs.com. Election Graphs tracks both a poll based estimate of the Electoral College and a numbers based look at the Delegate Races. All of the charts and graphs seen in this post are from that site. Additional graphs, charts and raw data can be found there. Follow @ElectionGraphs on Twitter or like Election Graphs on Facebook to see announcements of updates or to join the conversation. For those interested in individual general election poll updates, follow @ElecCollPolls on Twitter for all the polls as they are added. If you find the information in these posts interesting or useful, please consider visiting the tip jar.
[Update 07:16 UTC to add comment about outliers.]
[Updated 07:27 UTC to fix some awkward wording.]
[Blog Post] Electoral College: Trump breaks the Romney barrier https://t.co/l2lhVrAH8O
RT @ElectionGraphs: [Blog Post] Electoral College: Trump breaks the Romney barrier https://t.co/l2lhVrAH8O
RT @ElectionGraphs: [Blog Post] Electoral College: Trump breaks the Romney barrier https://t.co/l2lhVrAH8O
Bruce Morton liked this on Facebook.
RT @ElectionGraphs: [Blog Post] Electoral College: Trump breaks the Romney barrier https://t.co/l2lhVrAH8O