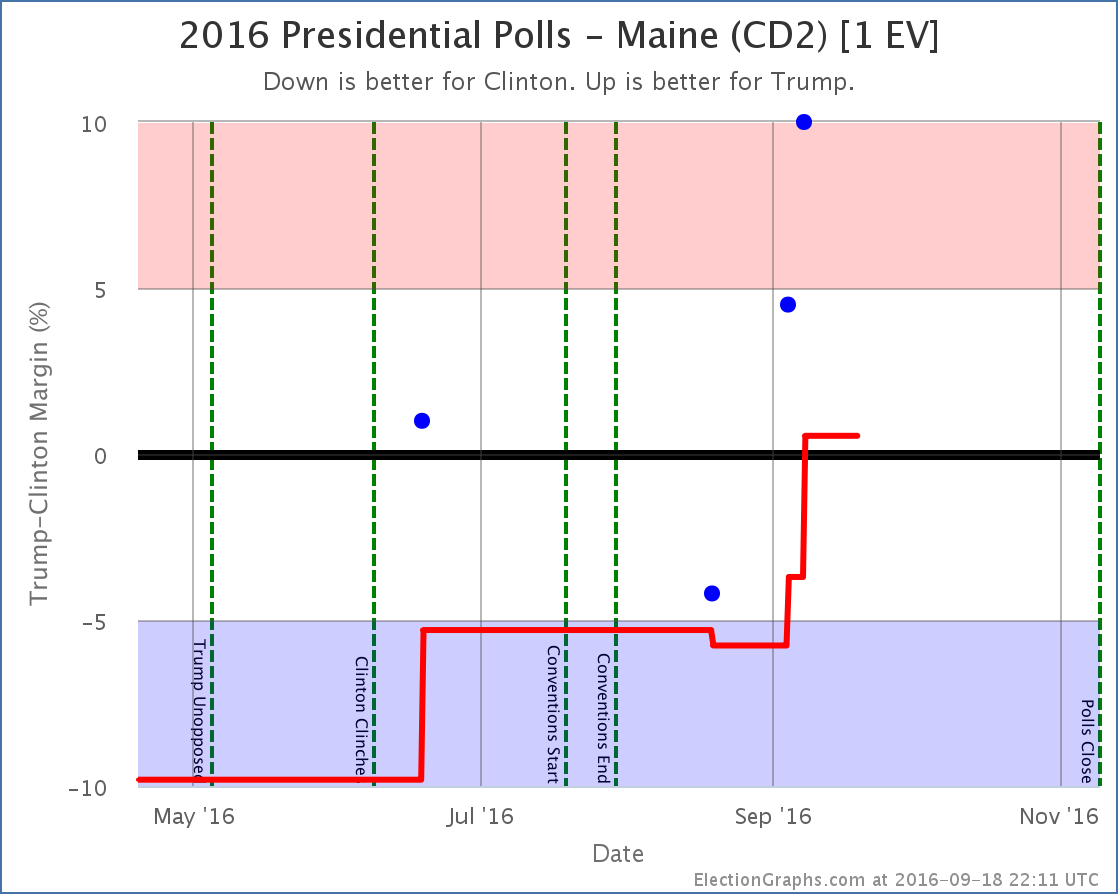
States with new poll data added since the last update: All 50 states, DC, and the Maine congressional districts. Notable changes in Colorado, New Mexico, Iowa, Nevada, Maine (CD2), Kansas, and the tipping point.
National Picture
Trump continues on the upswing, and at this point Clinton only leads by the very narrowest of margins. One more round of polls in his favor could easily put Trump in the lead for the first time this cycle.
With this update, we have the following changes:
- The expected case moves from Clinton by 32 EV to Clinton by only 6 EV
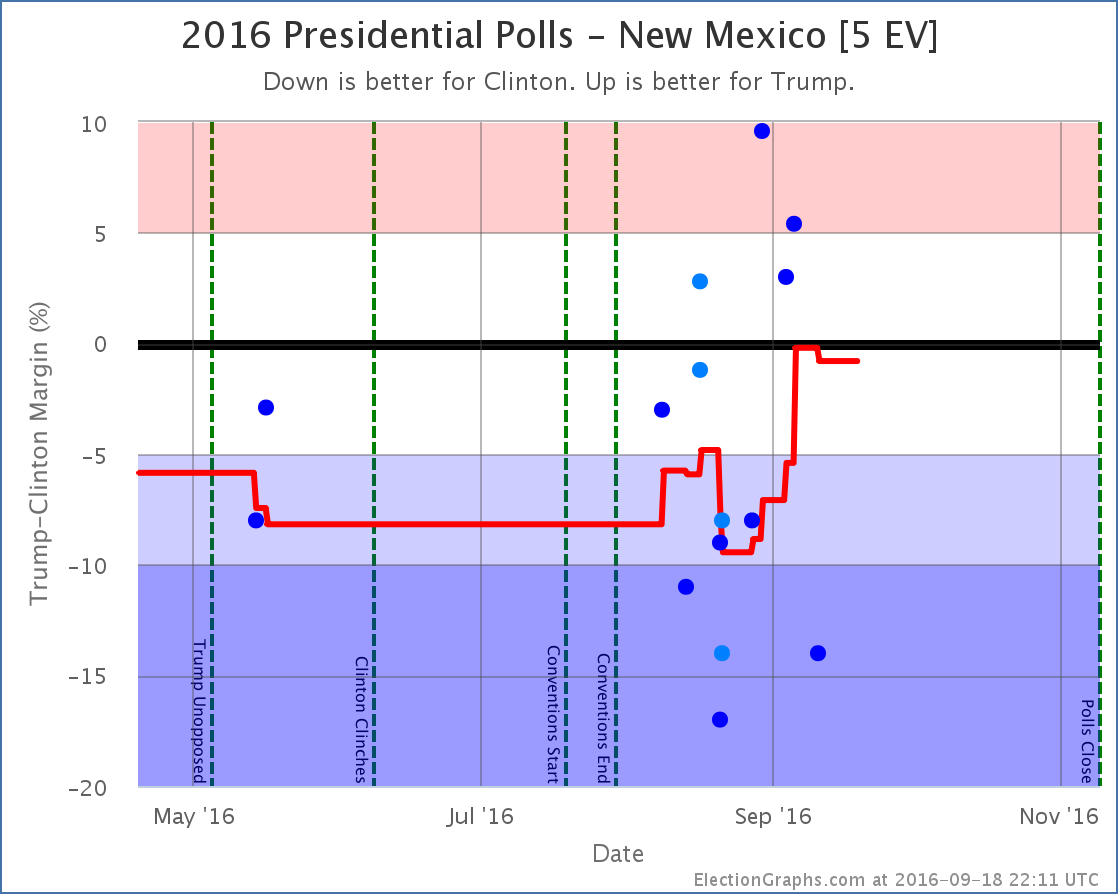
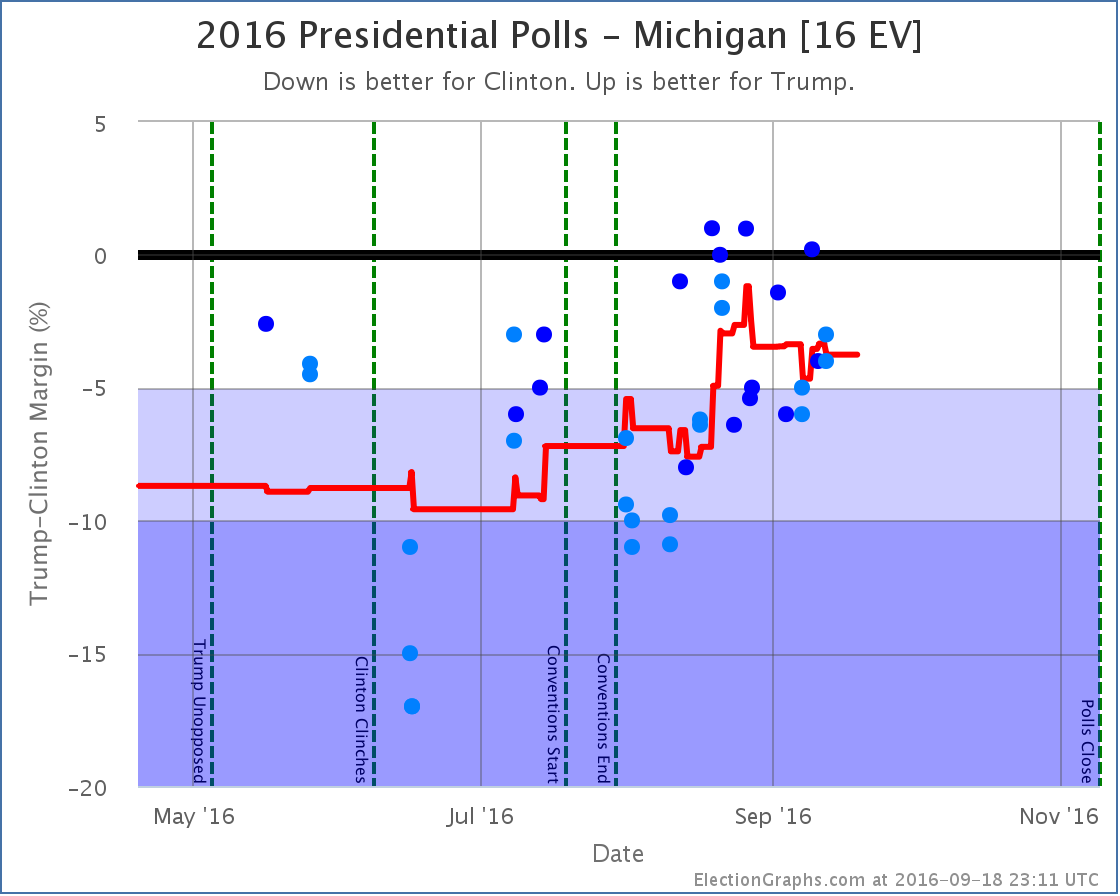
- The tipping point moves from Clinton by 3.4% in MI to Clinton by 0.8% in NM
- Trump’s best case improves from winning by 66 EV to winning by 94 EV
- Clinton’s best case drops from a 190 EV win to a 178 EV win
The full current summary:
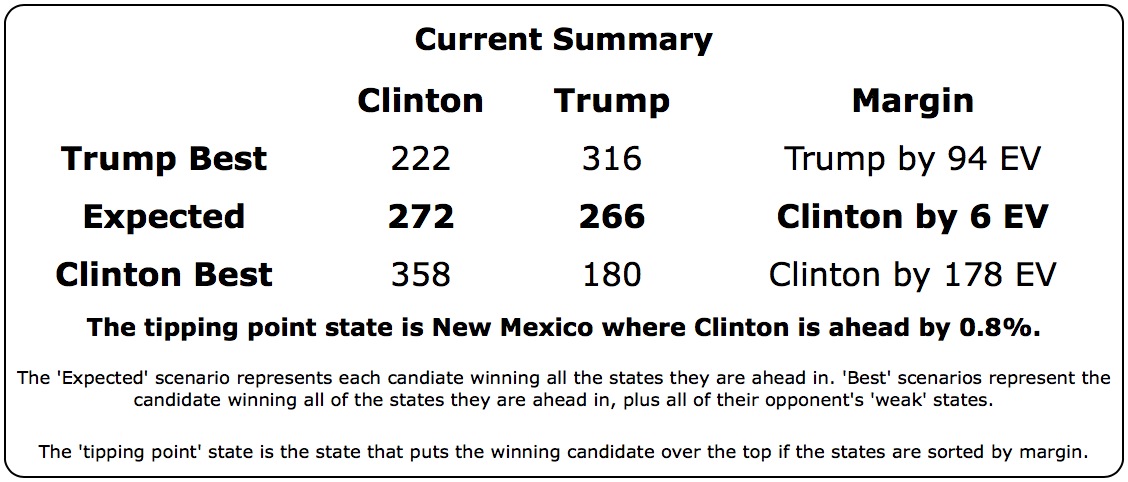
There is no denying this is now a razor thin race. This is close. If the election was held today, it could go either way.
Looking at the trends:
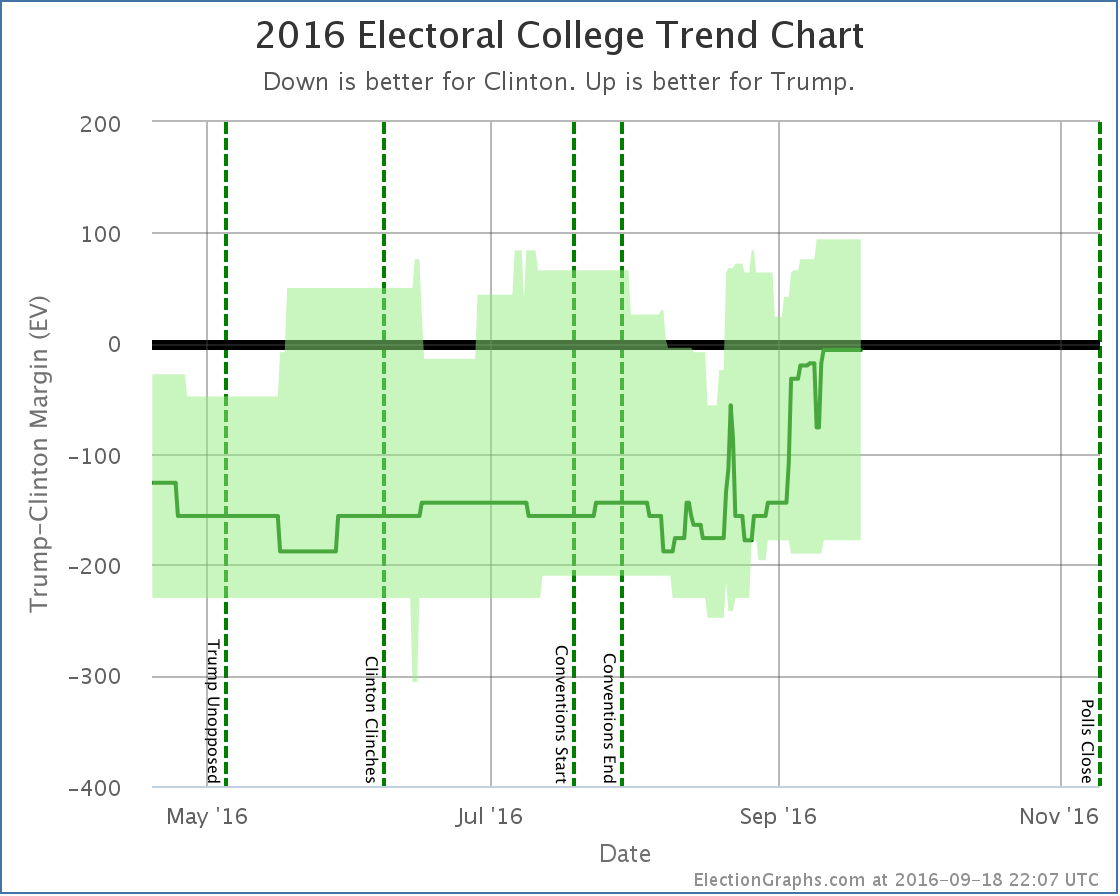
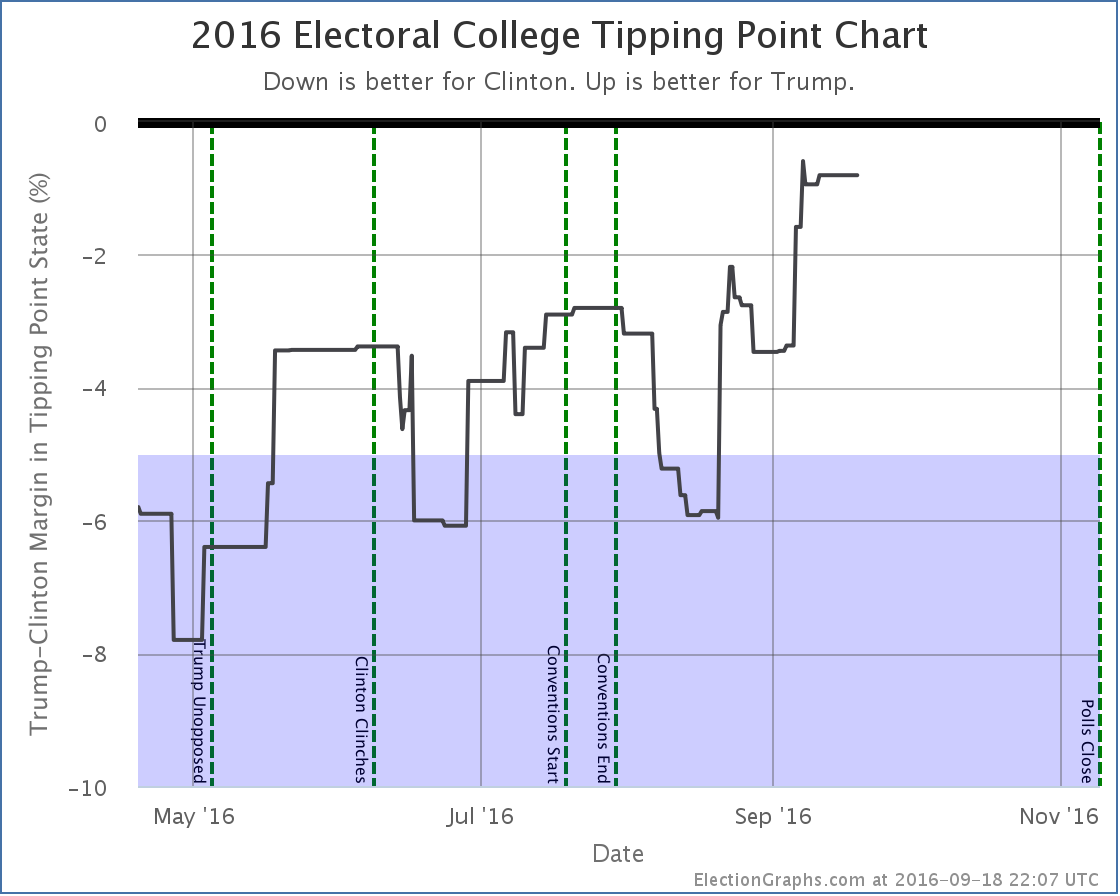
In both measures, Trump bottomed in mid-August and has been on a strong upswing ever since. Or is it that Clinton has been collapsing? In the end, the result is the same.
Trump is now far outside the “McCain to Romney” zone where he had been stuck. The question is if he is establishing a new normal, with many people permanently converted to his cause, or if this is an unsustainable high that will soon undergo reversion to the mean.
The race is not today. There are 51.0 days until we start getting the first real election results. A lot will happen between now and then. The first debate is now less than eight days away. Will it change anything? We shall see…
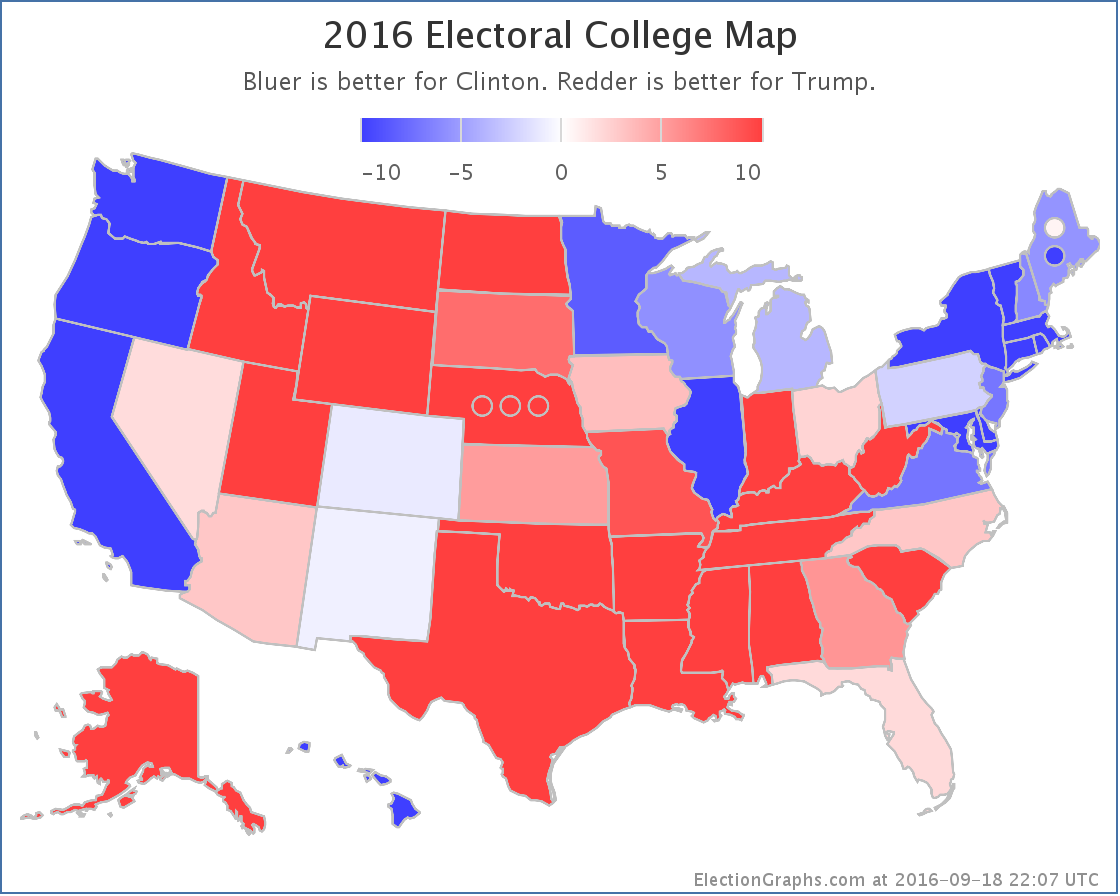
Individual States
I won’t provide individual commentary on all of these, but for those wanting to see the details on the states that changed the national summary this time around, here they are. Click through on any chart for the full detail page with individual polls listed.
Moving from Clinton to Trump:
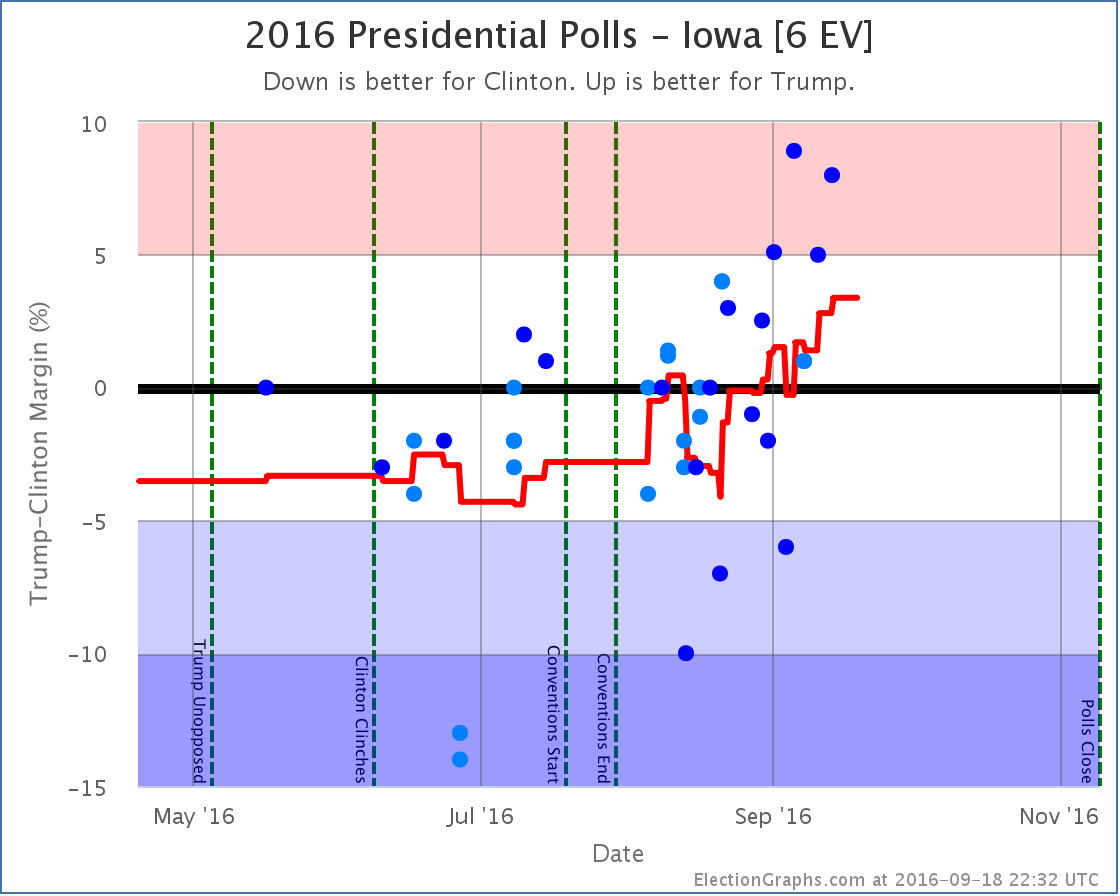
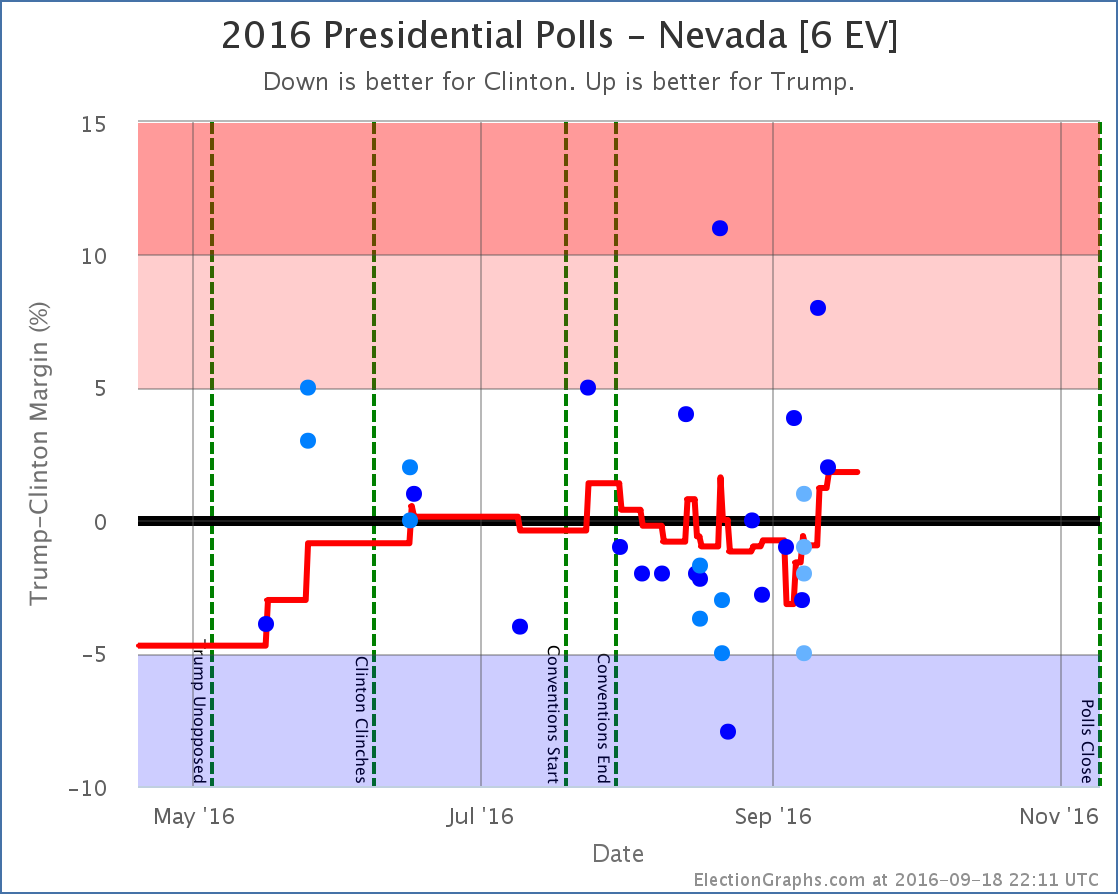
Now close enough to be in play for Trump:
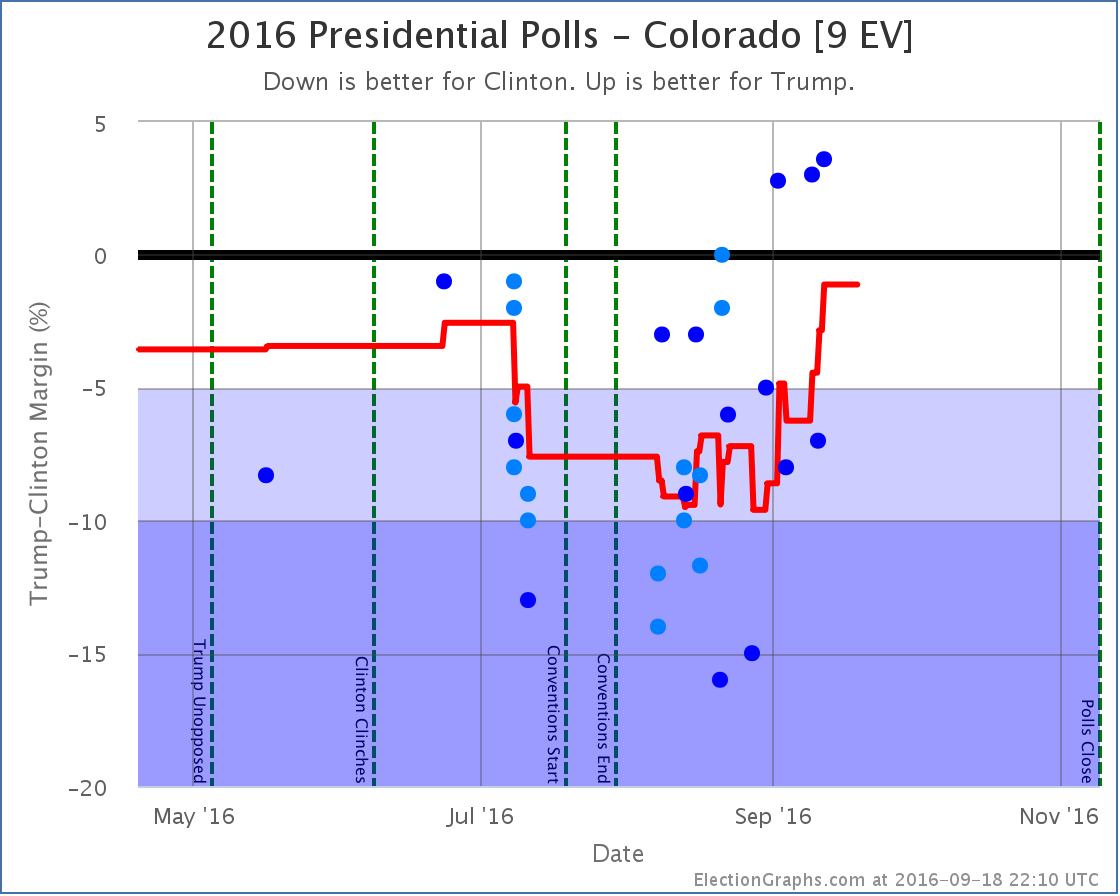
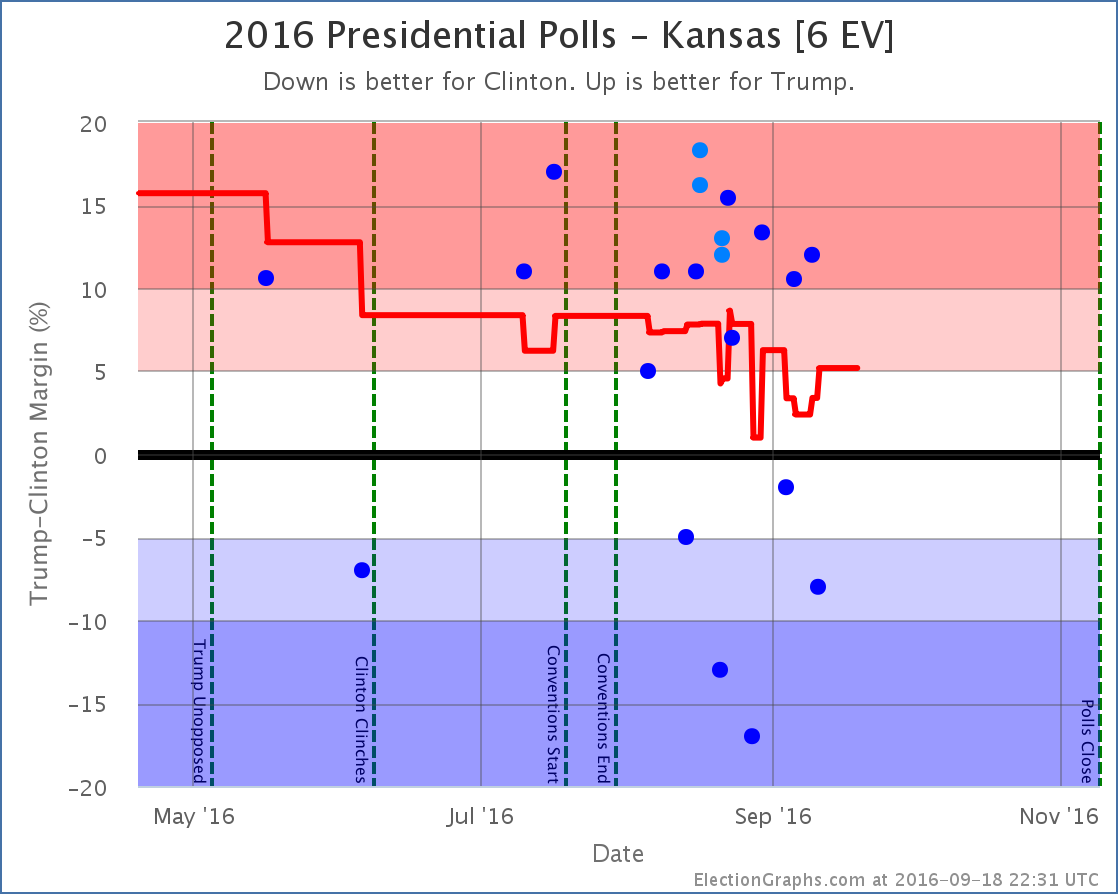
No longer close enough to be in play for Clinton
Another state whose movement influenced the tipping point
Note on “50 State” polls
Since Election Graphs tries to be as inclusive as possible with polls, we are including some “50 state” polls that some other folks have decided to exclude because of various methodological concerns. Others, like 538, include these polls, but give them very low weights in their models. Because Election Graphs tries to “keep it simple” we don’t do that kind of weighting. Everything just counts and we do a straight average.
Two of these “50 state” polls are now producing weekly results, Google Consumer Surveys and Reuters/Ipsos.
Honestly there are some crazy things in there. For instance:
- Google thinks Clinton is leading in Kansas, some weeks by a very large margin. No other pollster has seen this. Everybody else shows a significant Trump lead.
- Google thinks Trump is only 7% behind in DC. In DC? Really? In DC Obama beat Romney by 83.6% and McCain by 85.9%. The idea that Clinton is only 7% ahead of Trump in DC is pretty much ludicrous.
- The last few Ipsos polls have shown a Trump lead between 13% and 23% in Texas. The most favorable poll to Trump other than Ipsos has a 11% Trump lead, and most show it significantly narrower than that.
- In general it seems to be very common for these two polls to produce results which are outliers compared to other pollsters… Sometimes they show a result far more favorable to Clinton than anyone else, sometimes far more favorable to Trump than anyone else. The direction isn’t uniform, they just sometimes seem way off the mark.
- In many states the sample sizes are very low, and you see wide swings. For instance in West Virginia the Google poll moved from Trump +29% to Clinton +1% in one week! Yes, when you average them you get a 14% Trump lead, which is probably reasonable for West Virginia… but still!
- There are more examples, but you get the idea. In most states, these polls give roughly the results you would expect, in line with other recent polling, but occasionally, especially in smaller states, they seem to be clear outliers.
The craziness of some of these polls leads me to sometimes question my tenets of including everything and keeping it as close to a straight average as possible. But we’re sticking with that and we will see how it does.
And even with this the general notion of this site, that even with very simple assumptions you end up with similar results to what folks with complex models get seems to be holding up. Although the exact state by state results may differ slightly, every analysis I have read has the same general conclusion right now. The race is now much much closer than it was, although Clinton retains a narrow lead.
While these polls are a bit crazy, in the competitive states there are enough other polls so the average seems to be at least somewhat resilient when outliers like these pop up. And in the non-competitive states, well, these 50 state polls may be the only data in the average, so they may screw up the margins a bit, but in the end it doesn’t change the status of the state.
For more information…
This post is an update based on the data on ElectionGraphs.com. Election Graphs tracks both a poll based estimate of the Electoral College and a numbers based look at the Delegate Races. All of the charts and graphs seen in this post are from that site. Additional graphs, charts and raw data can be found there. Follow @ElectionGraphs on Twitter or like Election Graphs on Facebook to see announcements of updates or to join the conversation. For those interested in individual general election poll updates, follow @ElecCollPolls on Twitter for all the polls as they are added. If you find the information in these posts interesting or useful, please consider visiting the tip jar.
[Blog Post] Electoral College: Trump Close Enough to Smell Victory https://t.co/hSNgXg534Y
RT @ElectionGraphs: [Blog Post] Electoral College: Trump Close Enough to Smell Victory https://t.co/hSNgXg534Y
Michael Loomis liked this on Facebook.