States with new poll data added since the last update: All 50 states and DC.
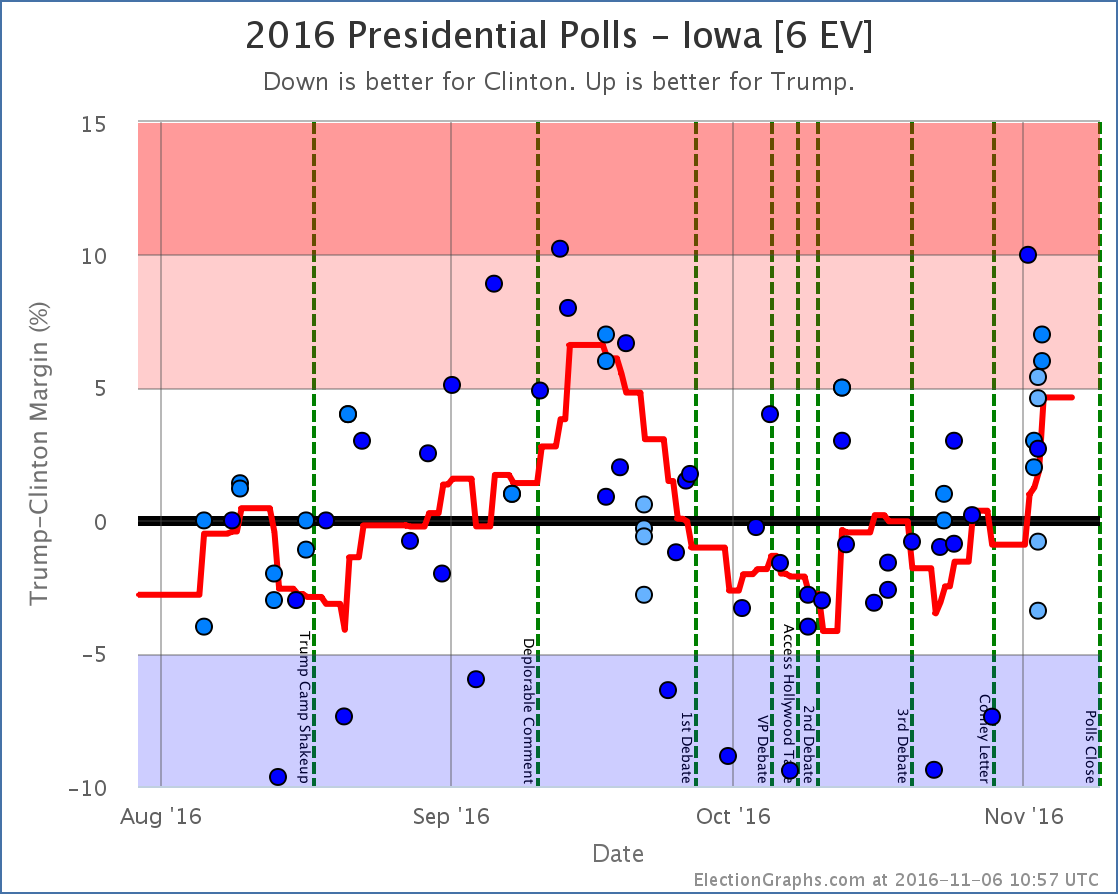
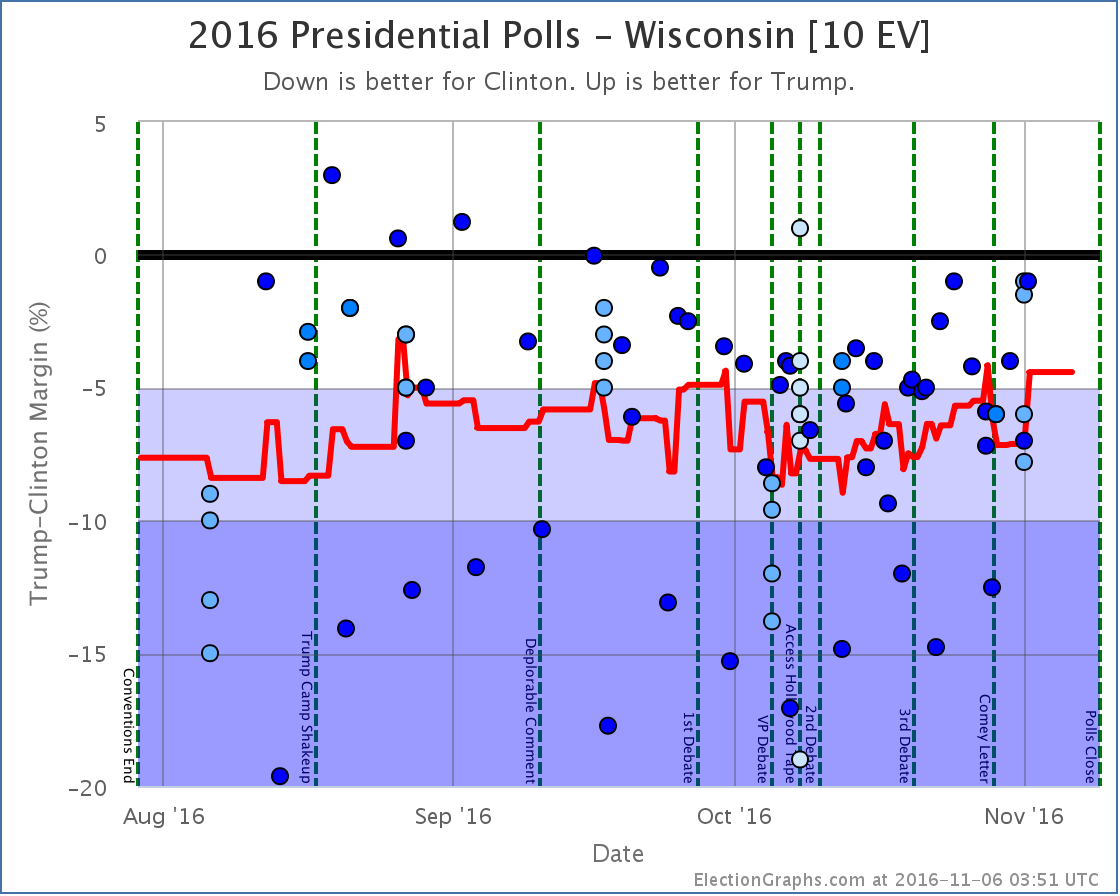
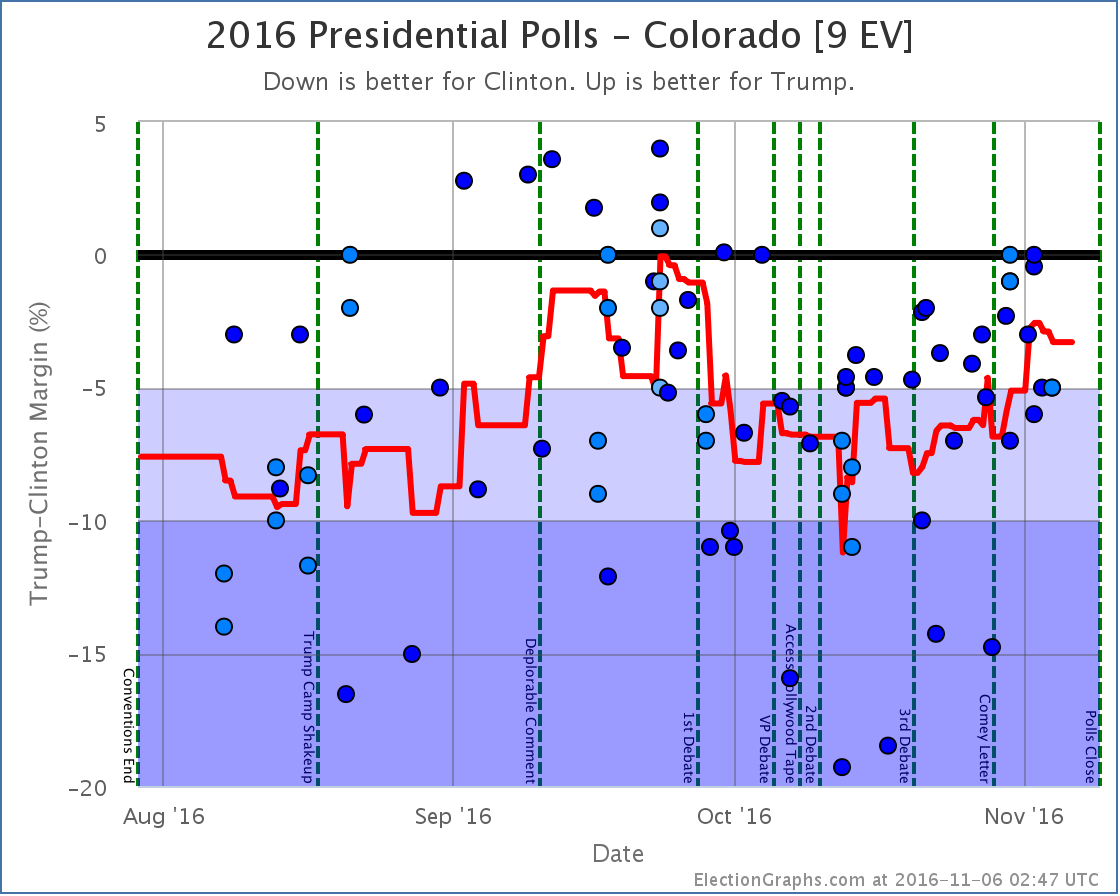
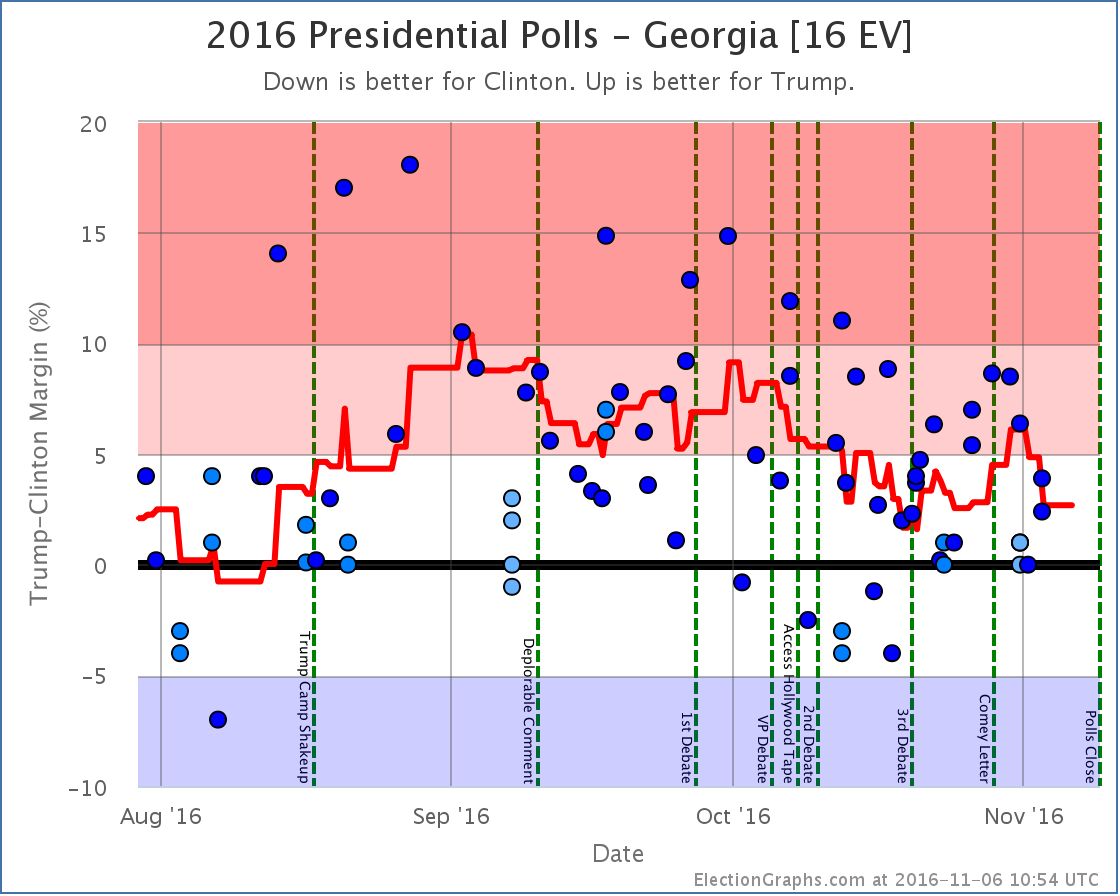
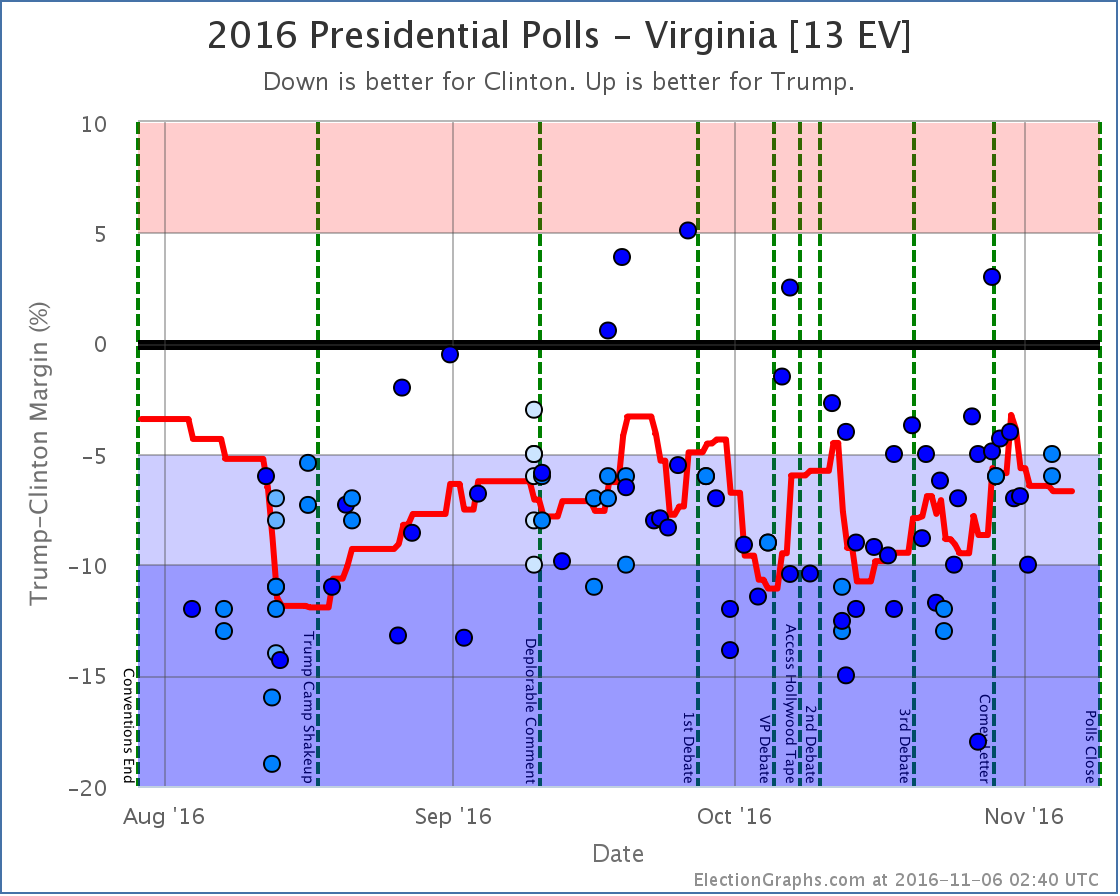
Notable changes in: Florida (29), Georgia (16), North Carolina (15), Virginia (13), Wisconsin (10), Colorado (9), Iowa (6), and the tipping point.
National Summary
It has been about two days since the last update. Since then the changes have been mixed, indicating that perhaps the recent movement toward Trump has topped out.
Good for Trump
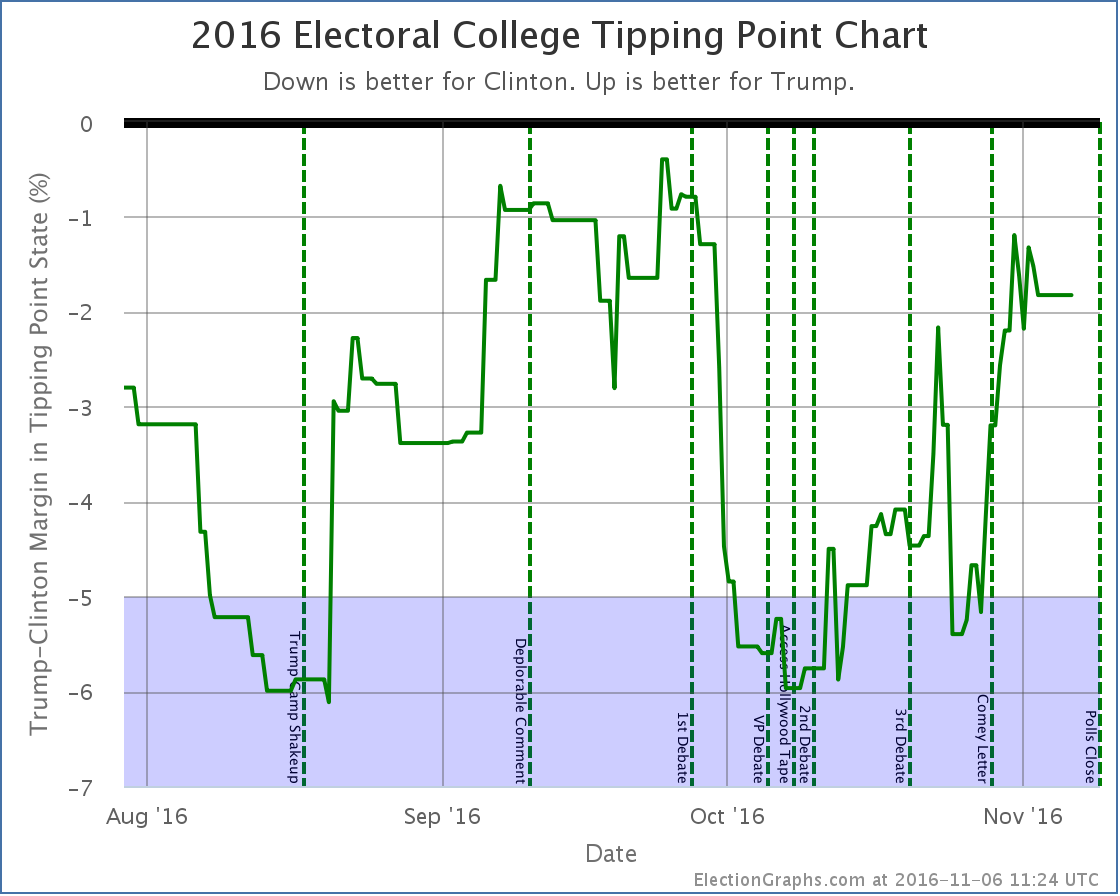
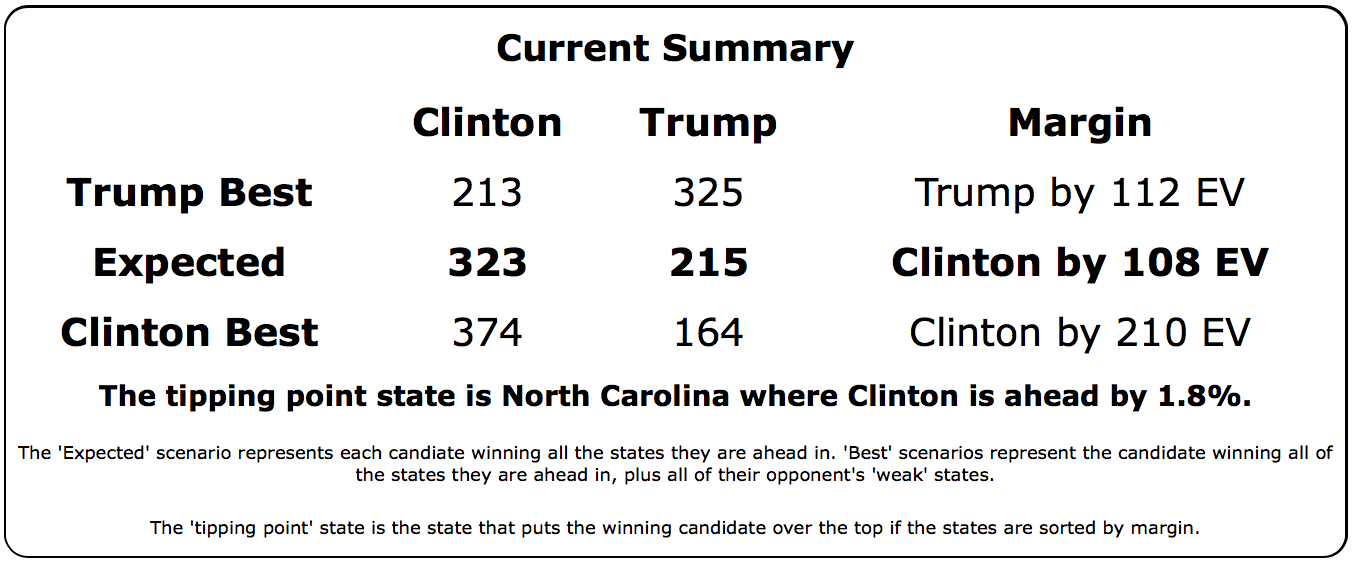
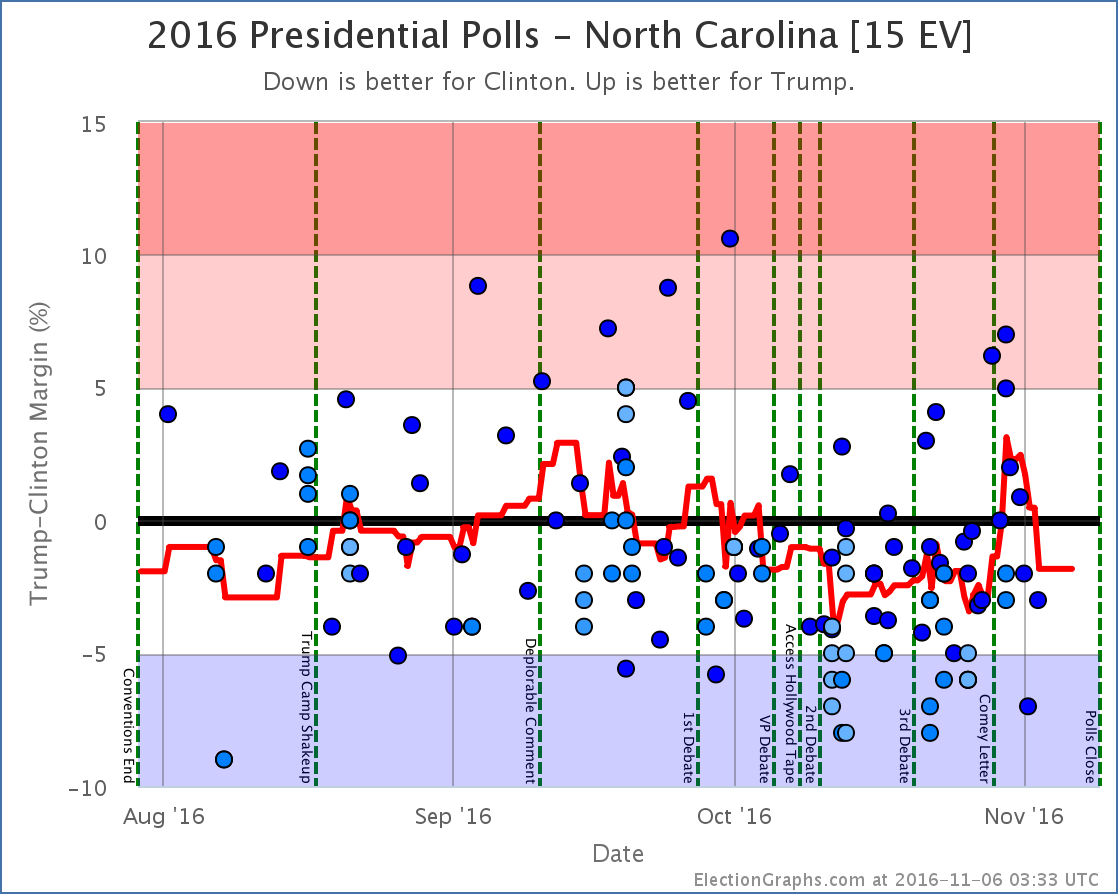
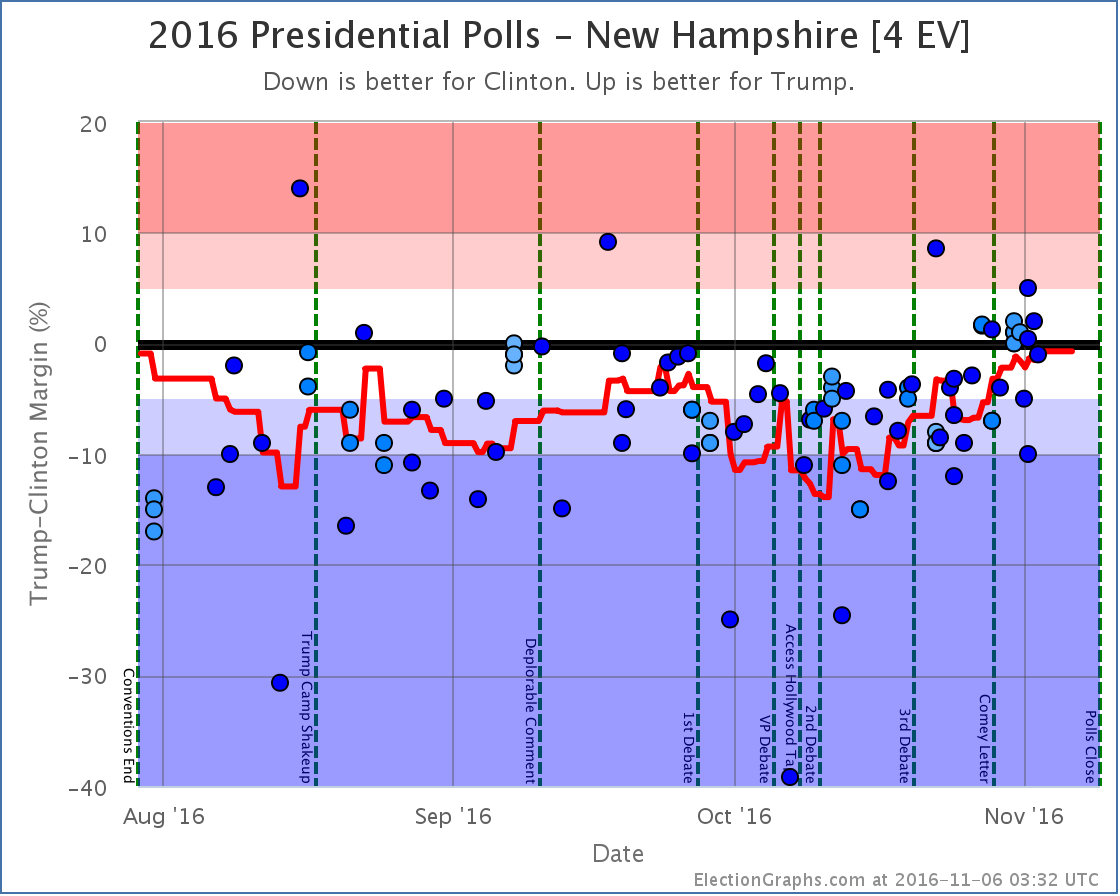
- The tipping point moves from Clinton by 2.2% in NH to Clinton by 1.8% in NC
- Trump’s best case has improved from a 100 EV win to a 112 EV win
Good for Clinton
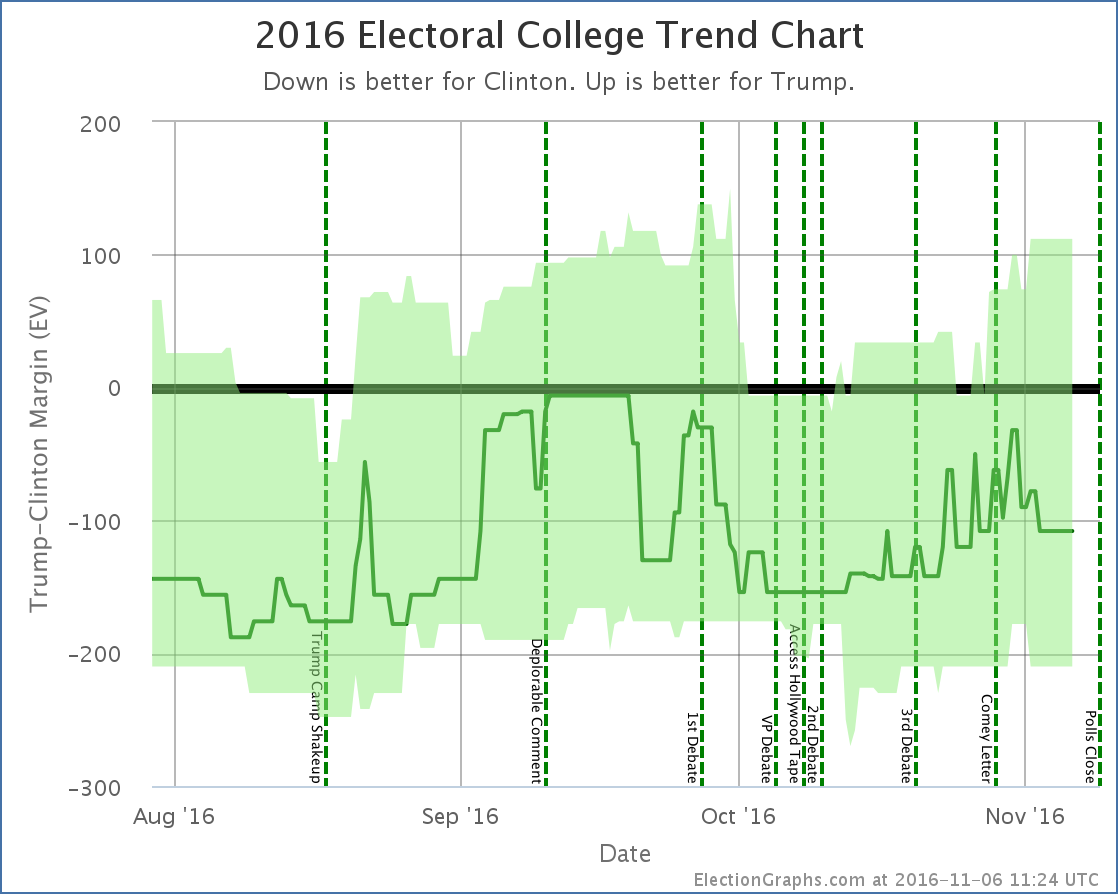
- The expected case moves from Clinton winning by 32 EV to Clinton winning by 108 EV
- Clinton’s best case moves from a 178 EV win to a 210 EV win
Charts
Discussion
While we have some indicators moving in each direction, the two to pay attention to are the expected electoral college result and the tipping point. The two “best case” scenarios give all states with a margin under 5% to one candidate or another. Those are both highly unlikely scenarios less than three days out from polls closing.
Even those two indicators are mixed though. If you had to decide who is favored in this update, you would still pick Trump though. Even though his expected electoral total has gone down, the tipping point moves a bit in his favor, meaning that the amount he has to move polls in order to win has lessened.
So while he is losing by more, the amount of effort to change that has still decreased.
The one caveat there is that while the tipping point has improved since my last update, looking at the actual trend line it seems to be down from a recent peak.
If you put all these mixed messages together, it looks like the recent “Trump Surge” may have reached a high water mark… or at least a pause.
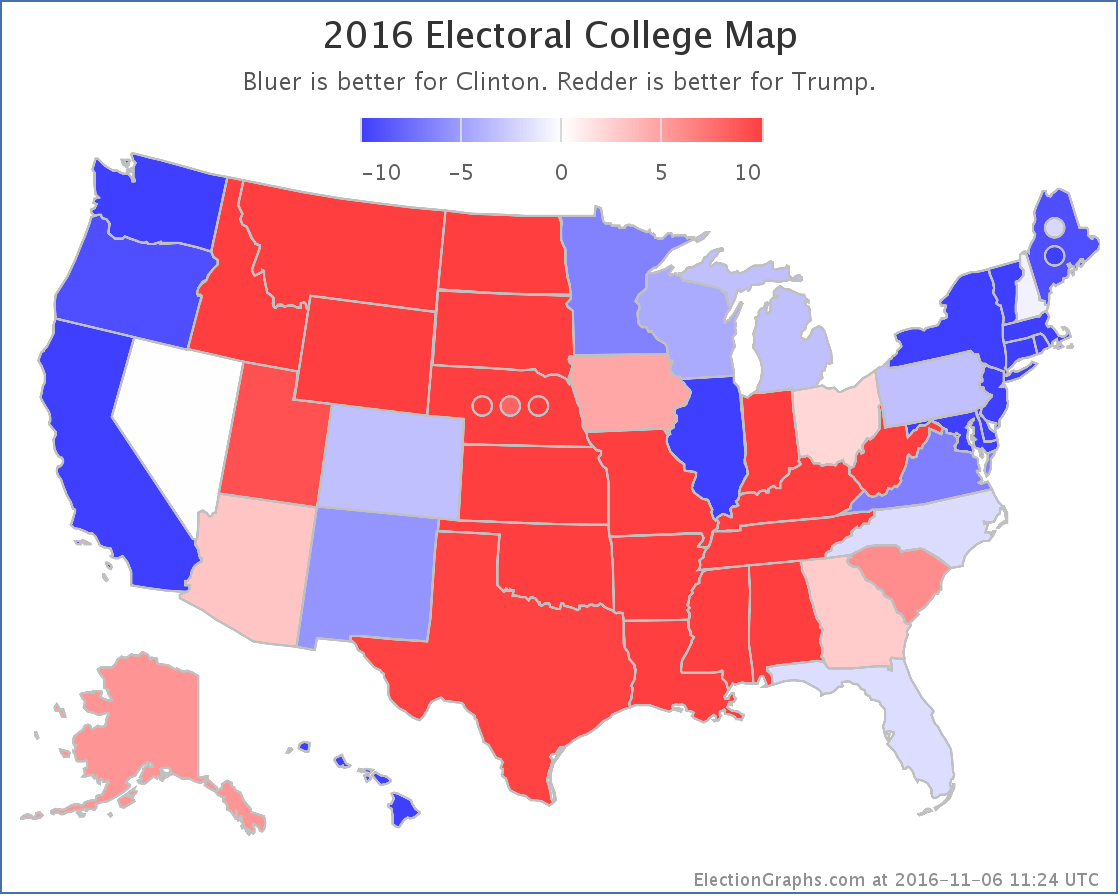
At these levels Clinton is of course still winning. The electoral result according to the current averages would be Clinton 323 to Trump 215, a 108 electoral vote win for Clinton. Trump does better than Romney did here, but still loses.
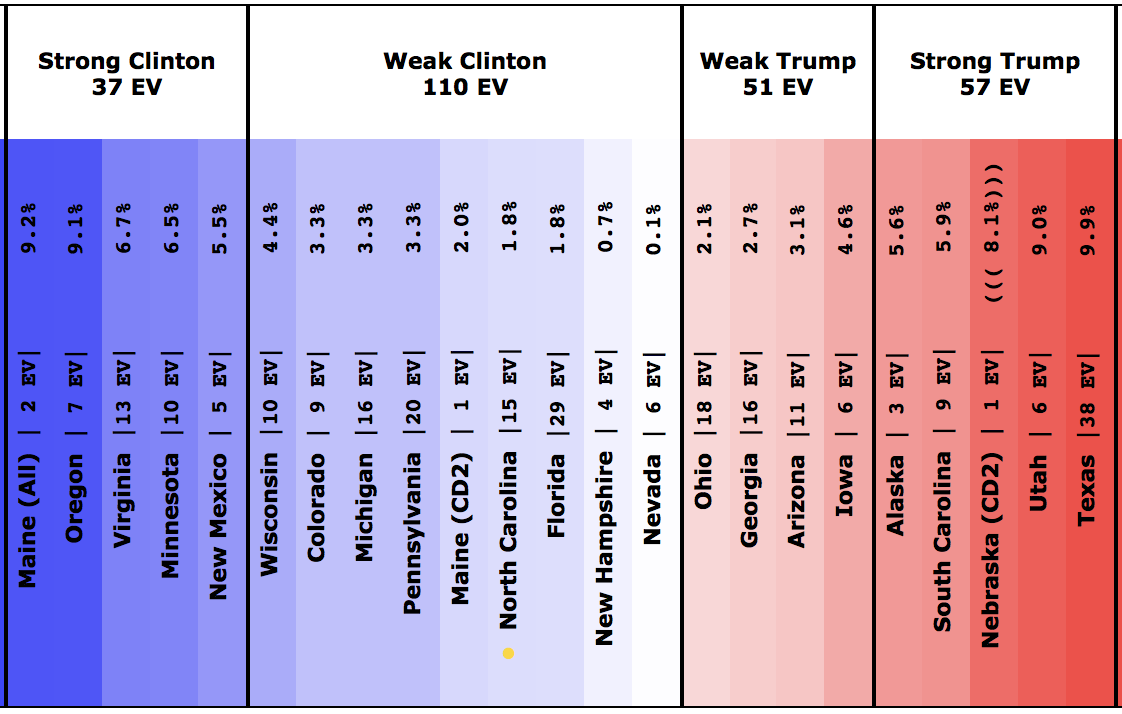
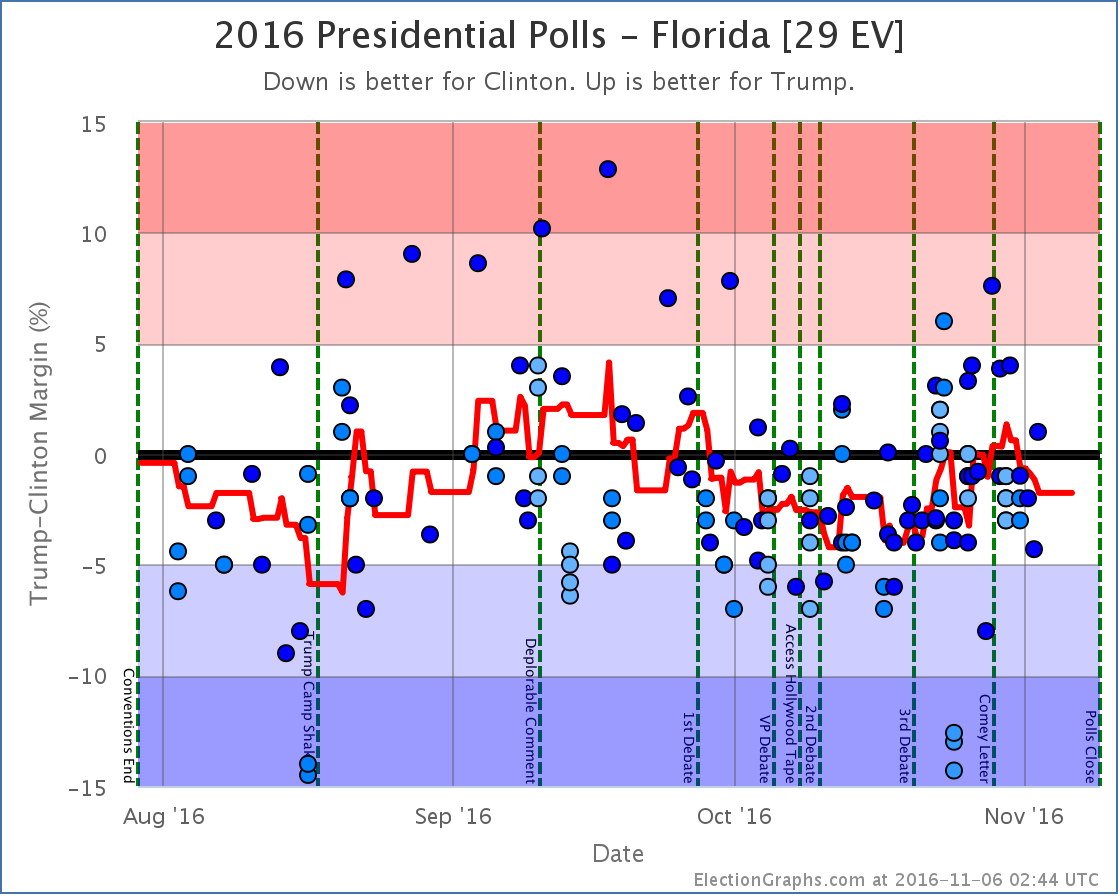
Trump still has ways to win though. The easiest way right now would be for him to pull in Nevada (0.1% Clinton lead), New Hampshire (0.7% Clinton lead), Florida (1.8% Clinton lead), and North Carolina (1.8% Clinton lead). That would get him to a 269-269 tie and throw the election into the House of Representatives, where he would probably win. To win outright, he would need to also pull in Maine’s 2nd congressional district, where Clinton is currently leading by 2.0% in the Election Graphs average.
Moving things by 2% doesn’t seem that big a move in the grand scheme of things, but given the history of the race in terms of what seem to be the candidate’s floors and ceilings, as well as reports of early voting trends in some of those states (specifically Nevada and Florida), moving those states that last little bit is harder than it may seem just looking at the percentages. If anything, the preliminary early voting data seems to indicate Clinton may end up over-performing the polling, not the other way around.
Just to check in with the sites that give odds (which we do not), the chances of a Trump win given all the current information:
- 35% – FiveThirtyEight
- 21% – Election Betting Odds
- 16% – New York Times
- 14% – PredictWise
- 10% – Daily Kos
- 6% – HorsesAss
- 2% – Huffington Post
- <1% – Princeton Election Consortium
The median of these 8 estimates is 12%. That seems reasonable and in line with what I would expect from the Election Graphs numbers and the small amount of time left before the election is over.
2.5 days until polls start to close. We are almost there.
State Details
The following are the detailed charts for all the states that influenced the national changes outlined above.
Moving from Trump to Clinton
Moving from Clinton to Trump
Now possible Trump pickups
Now possible Clinton pickups
No longer possible Trump pickups
Other states that helped move the tipping point
A note about faithless electors
In the past few days there have been reports of first one, then two, expected electors from Washington state saying that that have decided to or are considering being “faithless electors” by voting for someone other than who they are “supposed to” when the Electoral College votes in December.
Yes, they can do that. In Washington state there would be a $1000 fine if they did, but they can do it, and it would count.
There was also one other potential elector from Georgia who suggested they would be faithless back in August. That potential elector came under extreme pressure and resigned, to be replaced by someone who would presumably vote the “right” way.
That might well happen to these two as well. But faithless electors can and do happen every few election cycles. In the last 50 years there were faithless electors in 2004, 2000, 1988, 1976, 1972, and 1968. That is 6 out of 12 elections during that period. Half. It would not be surprising if there were one or more faithless electors in 2016, especially given the contentious nature of the race. They have never made a difference in the final outcome.
The Election Graphs estimates show what the results “should be” given who wins various states. They do not take into account statements by individual electors on their intentions. If a scenario arises where it is close enough for electors who have made statements like this to potentially make a difference in the outcome or throw the race to the House, we will of course make note of that. And once electors vote in December, we will show the final tallies, including any votes cast by faithless electors.
A note about McMullin
Right now the Real Clear Politics average in Utah has McMullin 12.4% behind the lead. The 538 average in Utah has him 10.3% behind the lead. Although McMullin was a lot closer than anyone expected, he never got closer than 5% to the lead in Utah in these averages and now appears to be fading. 538 still has him in second place, but it doesn’t seem likely at this point that he will win electoral votes.
If that changes, I will of course note it in these updates and on the Election Graphs site.
For more information…
This post is an update based on the data on ElectionGraphs.com. Election Graphs tracks a state poll based estimate of the Electoral College. All of the charts and graphs seen in this post are from that site. Additional graphs, charts and raw data can be found there. Follow @ElectionGraphs on Twitter or like Election Graphs on Facebook to see announcements of updates or to join the conversation. For those interested in individual general election poll updates, follow @ElecCollPolls on Twitter for all the polls as they are added. If you find the information in these posts interesting or useful, please consider visiting the tip jar.
Edit 13:56 UTC to add an additional paragraph break.
[Blog Post] Electoral College: Trump Surge Sputtering Out? https://t.co/XdimVPgOEb
RT @ElectionGraphs: [Blog Post] Electoral College: Trump Surge Sputtering Out? https://t.co/XdimVPgOEb
Juan Hardy liked this on Facebook.
Brittany Hollenbaugh liked this on Facebook.