This is the website of Abulsme Noibatno Itramne (also known as Sam Minter).
Posts here are rare these days. For current stuff, follow me on Mastodon
|
Well, Super Tuesday is over except for a few straggling delegates that were not yet determined when it was time to start writing this post. So how did things end up? A lot of places will concentrate on “states won” and say that Clinton won 7 states and Sanders won 4. That’s well and good, but we’re going to look at what actually matters… the delegate totals.
First as a reminder, on Sunday I used current polling to predict where we would end up on delegates. Subtracting out “Delegates Abroad” which as it turns out won’t report results for a few more days, the polling suggested we would get results something like:
Estimate: 526 Clinton, 339 Sanders
And where are we actually? I’ll refrain from going through this state by state and just jump to the totals.
Actual: 504 Clinton, 335 Sanders, 26 TBD
The 26 TBD delegates are from Texas (19 delegates) and Tennessee (7 delegates). They could still split in such a way that the estimate ends up exactly correct. But even if it doesn’t, it will have been pretty close.
Bottom line is that the results are very closely in line with what would have been expected given the polling. No surprises here.
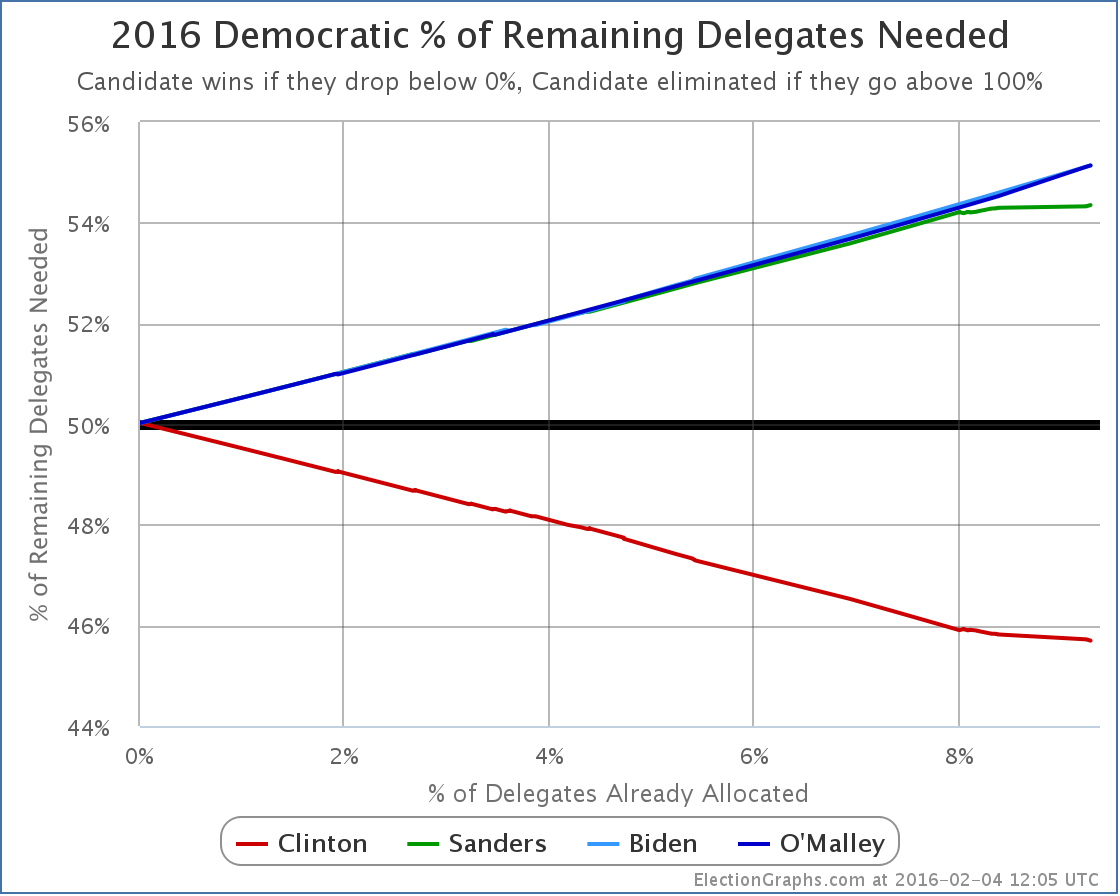
Where does that put our all important “% of remaining delegates needed to win” chart?
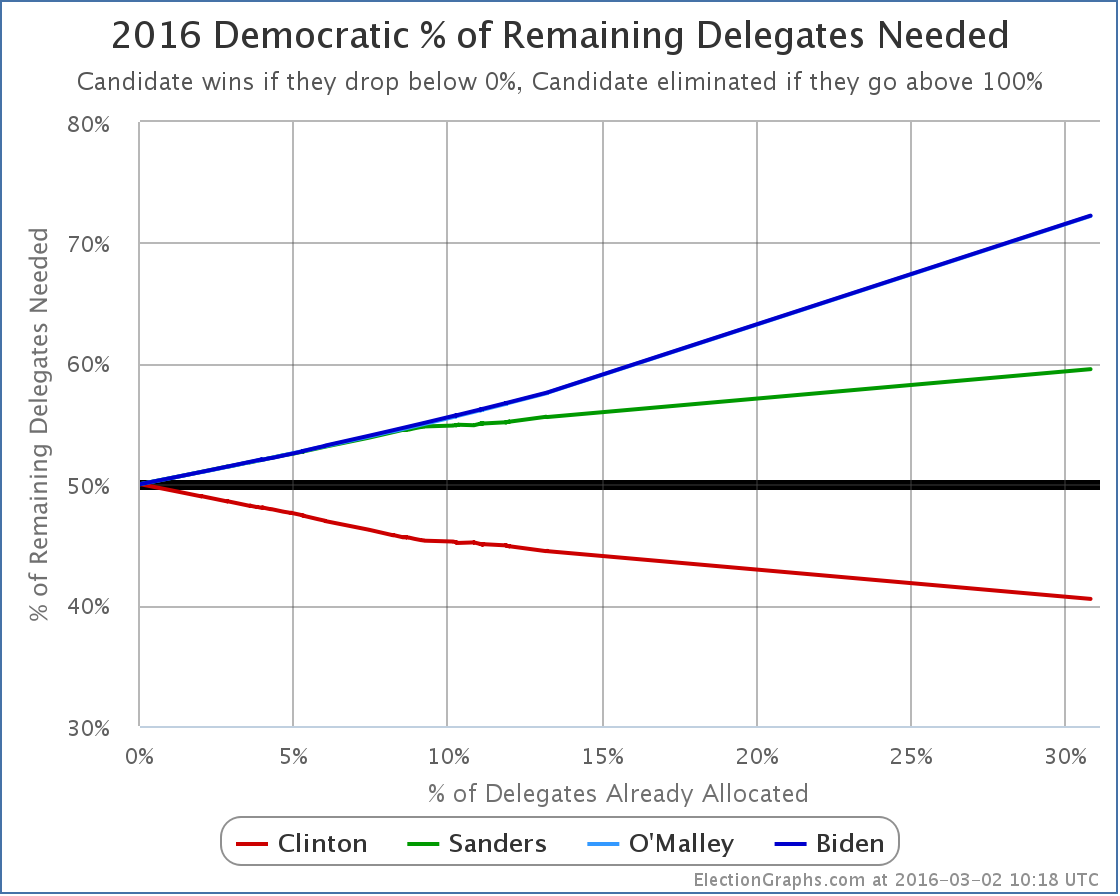
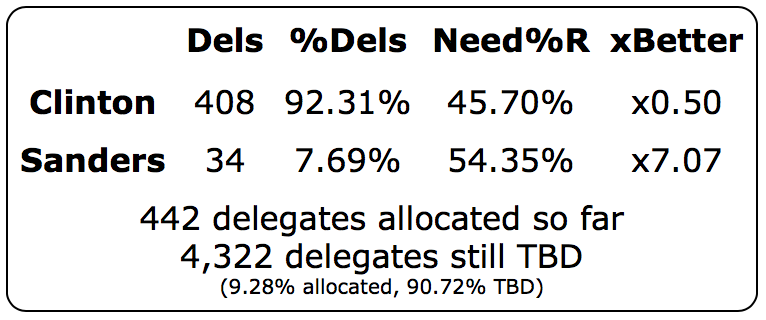
Clinton now only needs 40.52% of the remaining delegates to win the nomination. Sanders needs 59.54% of the remaining delegates to win.
Or of course large numbers of Clinton superdelegates have to start defecting to Sanders, which would raise Clinton’s number, and lower Sanders’ number. But there continues to be no sign of any such movement. And with Sanders continuing to lose the race for non-super delegates as well, it seems unlikely that a a big rush of “back the winner” movement will be heading Sanders’ way any time soon.
In the title of this post, I ask “what next?”. But even if Sanders had some “momentum” coming out of Super Tuesday (he really doesn’t) getting to 60% of the delegates in the coming contests would be a very tall order. His performance so far has been nowhere near that level. The Sanders folks may not be quite ready to admit it yet, but absent a Clinton implosion of historic proportions, the Sanders race for the nomination is over. If Sanders continues to fight on through the remaining contests, it isn’t to win, it is back to “making a point”, and “giving exposure to his issues”, and “moving the party towards him”, which was probably his original goal before he started doing a lot better than people originally expected. Those are legitimate reasons to continue a campaign. But it is not about winning the nomination.
What next? Clinton slowly but surely pushes her lead until she has 2,382 delegates and wins the nomination.
Before closing up, just a quick comparison:
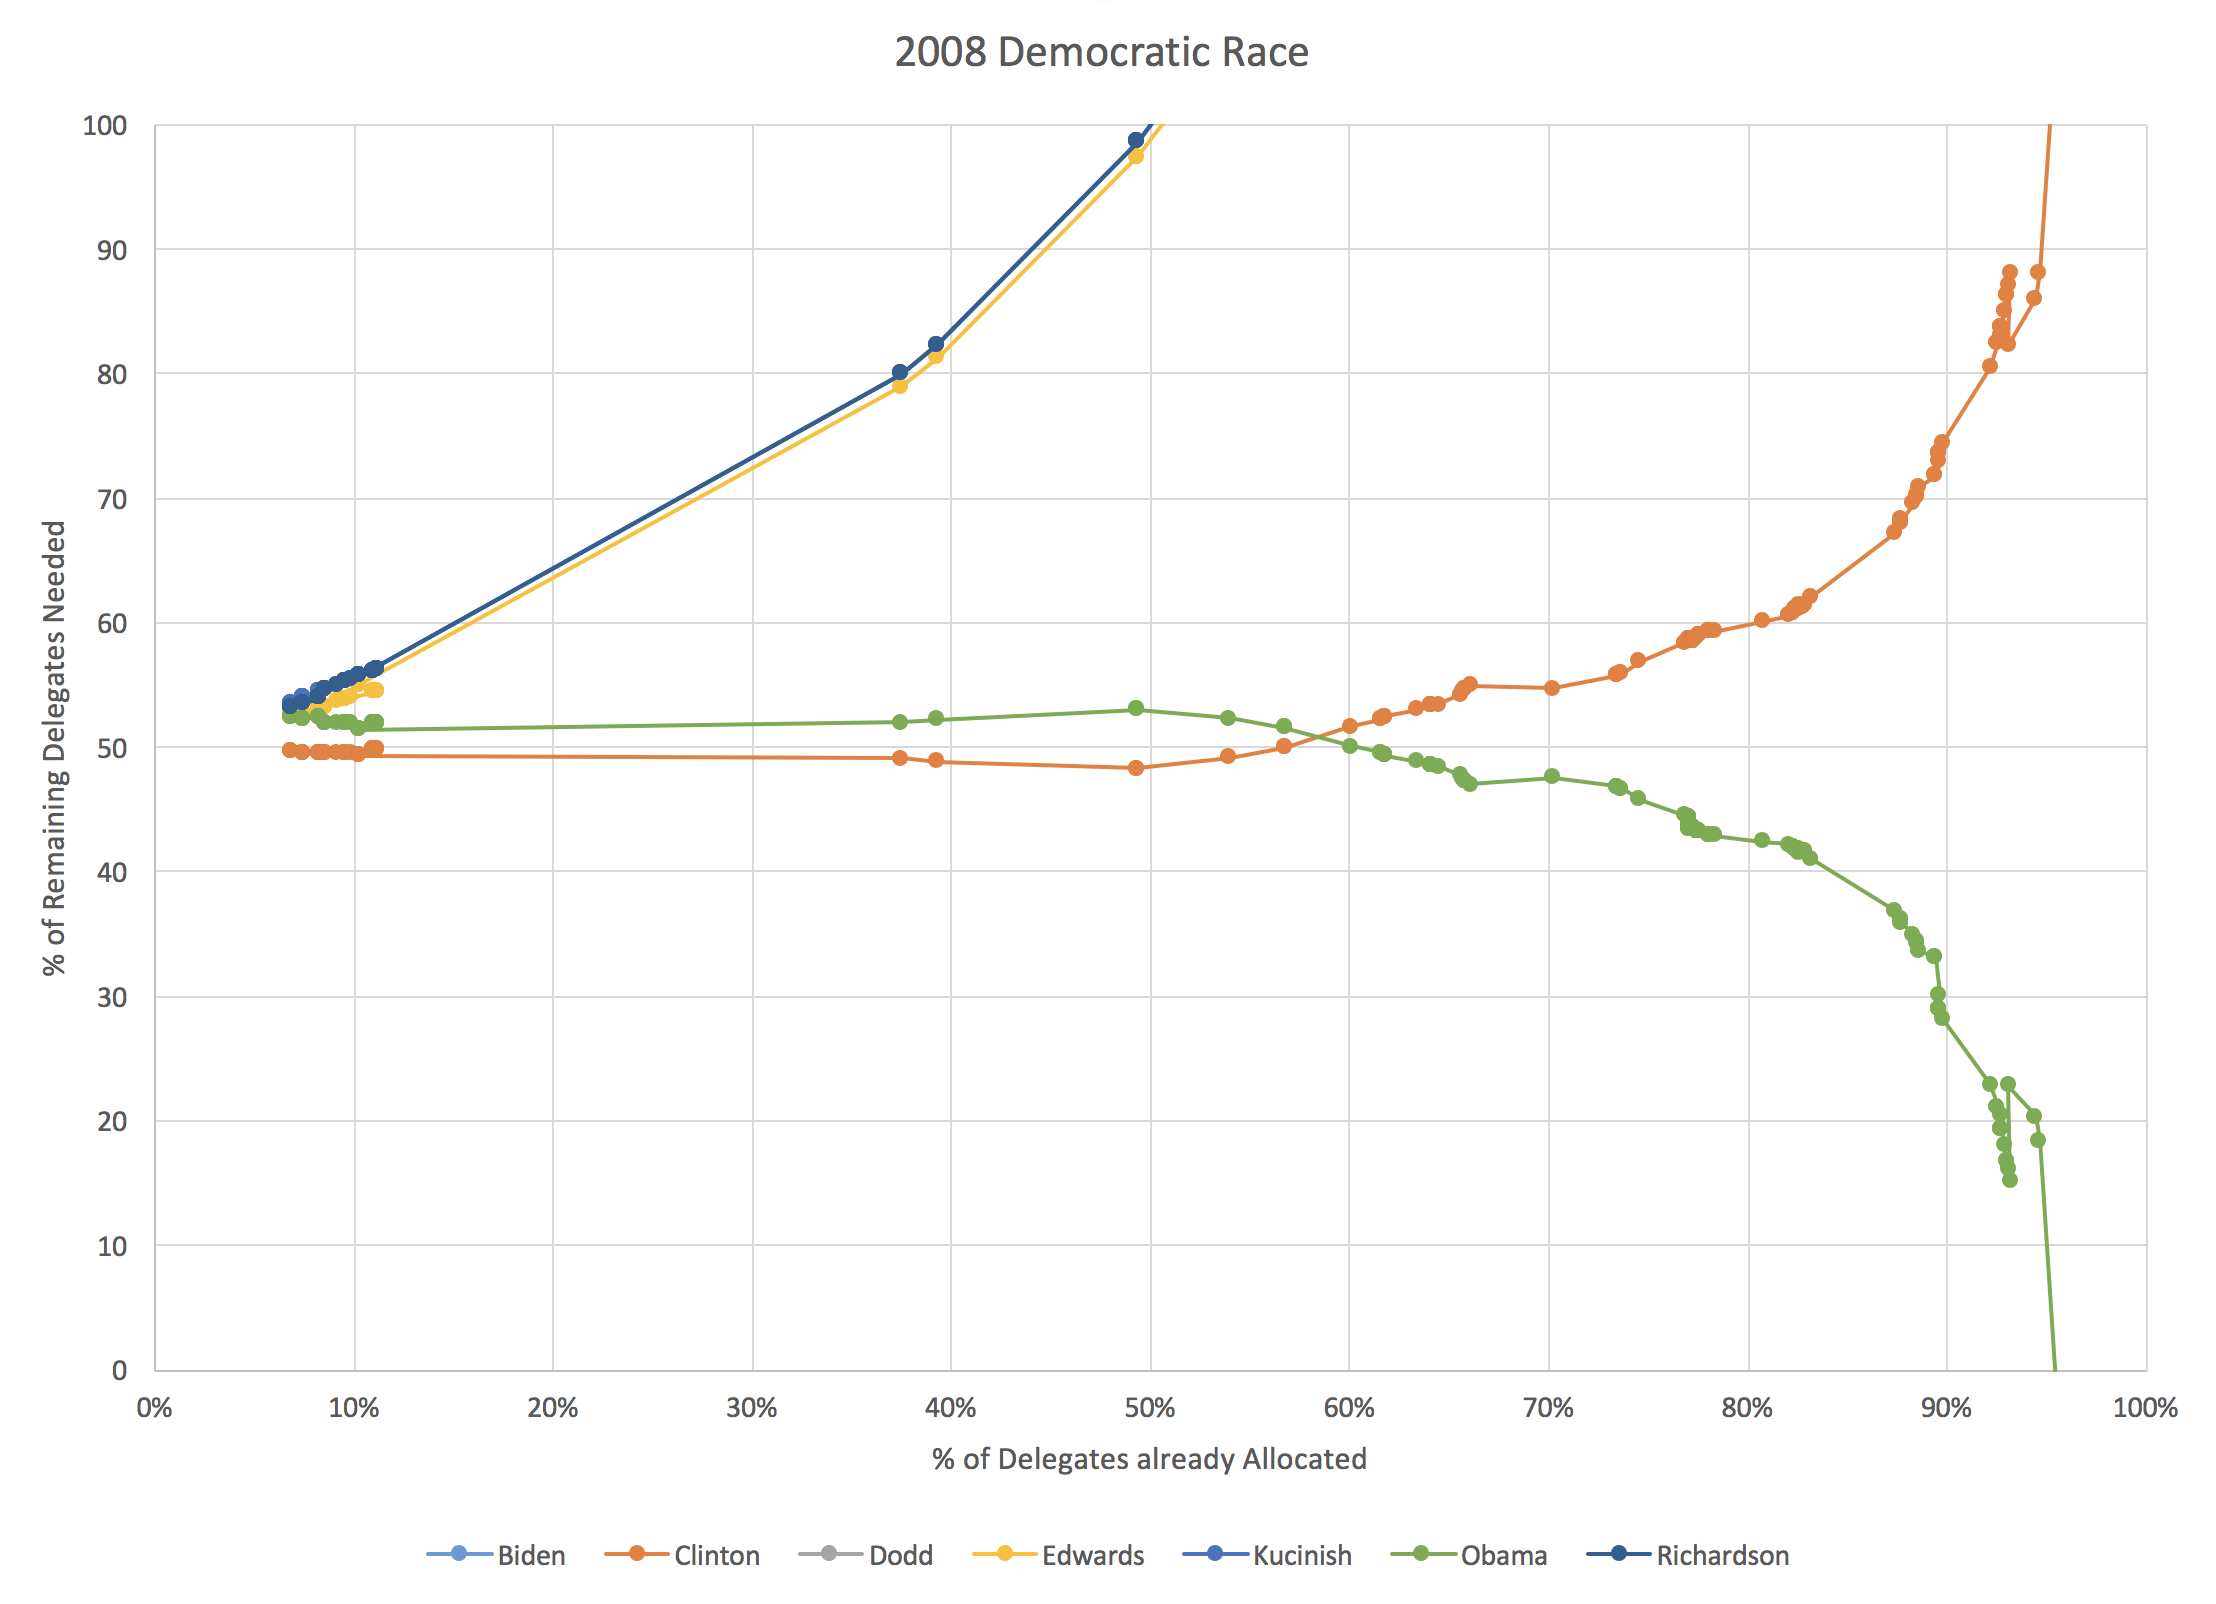
Although I didn’t produce the chart in exactly the same form when I did the analysis in 2008, a few minutes in Excel with the old data produced the equivalent chart for 2008. It is interesting to compare where we are.
First of all, at just over 30% of the delegates allocated, Clinton was still ahead in 2008! But it was much closer than things are today. She needed about 49% of the remaining delegates to win, compared to only needing about 41% today. Obama needed about 52% of the remaining delegates to catch up and win. Which he obviously did. At that point he already had about 47% of the delegates that were already allocated though… while Sanders only has about 29% of the delegates. (Both 2008 and 2016 numbers of course include superdelegates.) So while Obama was able to mount a come from behind win from this point in the delegate race, Sanders is far far behind where Obama was.
Sanders is now approximately where Clinton was when about 80% of the delegates had been determined. In 2008, that was in late April. The media was still talking about the Clinton/Obama race at that point, and hyping up increasingly outlandish scenarios where Clinton could still win, because a race is more interesting than having a clear winner, but anybody watching the numbers knew it was over at that point absent a catastrophic event.
In any case, back here in 2016, I will of course continue to watch the races and post updates after each contest. If a major event happens that changes everything and puts Sanders back on track to win you will see it here. Absent that though, we’re just going to be watching Clinton’s slow march toward mathematically clinching the nomination.
[Update 2016-03-03 02:17 UTC – Update on super Tuesday delegates. The 7 TBD delegates in Tennessee broke 6 for Clinton, 1 for Sanders. The 19 TBD delegates in Texas broke 12 for Sanders, 7 for Clinton. In addition in Minnesota the estimates were adjusted to give one less delegate to Sanders, and one more to Clinton. Net for this round of updates: Clinton +14, Sanders +12, bringing totals to Clinton 1060, Sanders 431, O’Malley 1. This does not substantively change the analysis above.]
[Update 2016-03-04 02:51 UTC – Superdelegate update: Net Clinton +2]
[Update 2016-03-05 16:41 UTC – Superdelegate update: Net Clinton +6]
[Update 2016-03-06 07:30 UTC – Final superdelegate update prior to results from March 6th states: Net Sanders +1]
Note: This post is an update based on the data on ElectionGraphs.com. Election Graphs tracks both a poll based estimate of the Electoral College and a numbers based look at the Delegate Races. All of the charts and graphs seen in this post are from that site. Additional graphs, charts and raw data can be found there. All charts above are clickable to go to the current version of the detail page the chart is from, which may contain more up to date information than the snapshots on this page, which were current as of the time of this post. Follow @ElectionGraphs on Twitter or like Election Graphs on Facebook to see announcements of updates or to join the conversation. For those interested in individual general election poll updates, follow @ElecCollPolls on Twitter for all the polls as they are added.
[Edit 16:44 UTC to actually answer the “What’s next?” from the title.]
As expected, Clinton easily won South Carolina. Clinton won 39 delegates, Sanders got 14.
Since my last post on the Democrats the tally has also added a net 10 superdelegates for Clinton, 1 for Sanders, and 1 straggler for O’Malley.
As of that last post, Sanders needed to get more than 55.03% of delegates to be on track to catch up with Clinton and win. Obviously that hasn’t happened with these updates. He got 23.08% of the delegates since that post.
So the end result is that the percentage of the remaining delegates Sanders needs to win goes up, while that number for Clinton goes down:
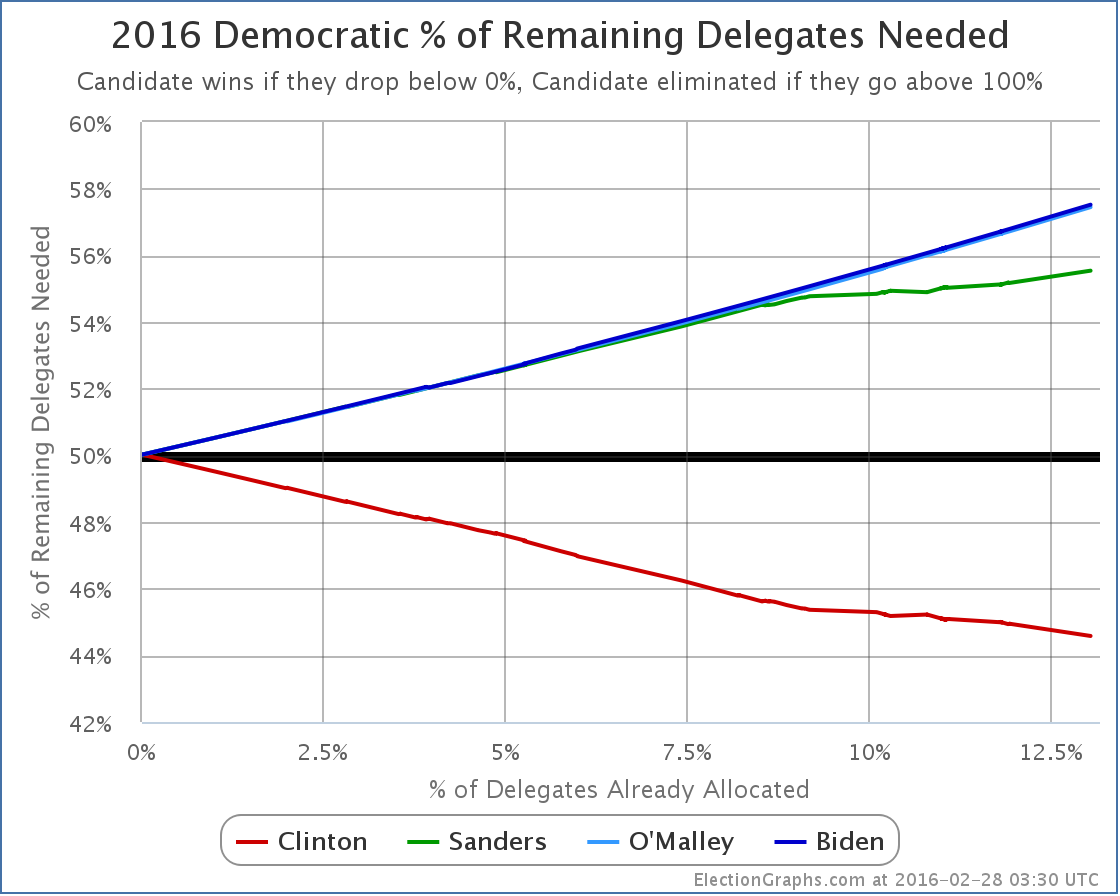
South Carolina is that slight acceleration of the curves starting at about 11.9%.
Sanders now needs 55.54% of the remaining delegates to catch up and win. (Or less if he starts flipping Clinton superdelegates to his side, but there has been no sign of that yet.)
Meanwhile, Clinton only needs 44.58% of the remaining delegates to win.
Frankly, in the 2008 and 2012 cycles once the frontrunner needed less than 45% of the delegates to win, it was time to start calling the race over. Yes, something happening that would allow a challenger to catch up and win is still possible. But it is unlikely. And with each additional contest where the challenger fails to make their own “% needed to win” mark, it gets harder.
But lets not consider it done quite yet. Super Tuesday is coming up in a few days. Maybe there is something there to indicate this isn’t over quite yet. Just as I did for the Republicans, lets game out what Super Tuesday looks like based on current polling. I’ll use the RCP poll averages, then try to estimate delegates based on the rules in each state.
Texas (222 delegates)
- Current poll averages: 59.9% Clinton, 33.6% Sanders
- Delegate estimates: 142 Clinton, 80 Sanders
Georgia (102 delegates)
- Current poll averages: 62.8% Clinton, 26.0% Sanders
- Delegate estimates: 72 Clinton, 30 Sanders
Virginia (95 delegates)
- Current poll averages: 54.5% Clinton, 35.0% Sanders
- Delegate estimates: 58 Clinton, 37 Sanders
Massachusetts (91 delegates)
- Current poll averages: 46.3% Sanders, 45.7% Clinton
- Delegate estimates: 46 Sanders, 45 Clinton
Minnesota (77 delegates)
- Current poll averages: 54.5% Clinton, 28.5% Sanders
- Delegate estimates: 51 Clinton, 26 Sanders
Tennessee (67 delegates)
- Current poll averages: 53.0% Clinton, 30.0% Sanders
- Delegate estimates: 43 Clinton, 24 Sanders
Colorado (66 delegates)
- Last poll from November so using national averages: 47.2% Clinton, 42.2% Sanders
- Delegate estimates: 35 Clinton, 31 Sanders
Alabama (53 delegates)
- Using only poll from February: 59% Clinton, 31% Sanders
- Delegate estimates: 35 Clinton, 18 Sanders
Oklahoma (38 delegates)
- Current poll averages: 45.0% Clinton, 36.0% Sanders
- Delegate estimates: 21 Clinton, 17 Sanders
Arkansas (32 delegates)
- Current poll averages: 57.0% Clinton, 28.5% Sanders
- Delegate estimates: 21 Clinton, 11 Sanders
Vermont (16 delegates)
- Current poll averages: 84.5% Sanders, 9.5% Clinton
- Delegate estimates: 16 Sanders
Democrats Abroad (13 delegates)
- No polls, using national averages: 47.2% Clinton, 42.2% Sanders
- Delegate estimates: 7 Clinton, 6 Sanders
American Samoa (6 delegates)
- No polls, using national averages: 47.2% Clinton, 42.2% Sanders
- Delegate estimates: 3 Clinton, 3 Sanders
OK. Adding all those up…
533 Clinton, 345 Sanders
Now, these are estimates based on relatively sparse polling and the assumption that candidate support is uniformly distributed within each state. The results will not be exactly like this.
But unless something major happens to change the picture in the next couple of days, the results on Tuesday should look broadly similar to this. With the estimate above, Sanders gets about 39.3% of the delegates. A far cry from the 55.5% he would need in order to actually improve his position against Clinton.
Adding the current delegates to the estimated Super Tuesday delegates, the new totals would be:
1,069 Clinton, 427 Sanders, 3 O’Malley
31.5% of the delegates will have been allocated. But 68.5% would still be available.
What would Sanders’ new “% of remaining needed to win” be at that point?
It would be 59.9%.
Sanders would need nearly 60% of the remaining delegates to catch up and win, or a massive defection of Clinton superdelegates to lower that number.
To imagine Sanders performing like this, you either have to believe the remaining states are vastly different in their preferences to the states that will have gone before (there is no evidence for this so far), or some massive seismic event would have to happen in the campaign to dramatically change minds of large numbers of Democratic voters in a very short timeframe.
A good argument could be made that absent a shocking surprise, this race is already done. After Super Tuesday, if the results are anything like the estimates above, then those hoping for a Sanders win will be grasping at the thinnest of straws. By the time we get to the end of March, again, absent that huge surprise, there will be no serious question any more.
Now, surprises do sometimes happen. You never know. But you don’t get to a Sanders win from here with just “normal” campaigning. It would take something bigger… a major Clinton scandal bigger than anything seen so far… a serious issue with Clinton’s health… something along those lines.
This doesn’t preclude Sanders staying in the race all the way until the convention and battling in every primary and caucus. He could do that if his cash flow holds out. But it would be to champion his issues and to try to move the party further in his direction, it would not be a serious attempt to win the nomination.
Three days from the time I post this, we’ll have Super Tuesday results and we’ll see just how close my poll based guestimates were and if this analysis holds up. More then…
[Update 2016-03-02 00:47 UTC – As a result of a final scan for superdelegates prior to adding Super Tuesday results we have a net change of +7 Clinton superdelegates, +2 Sanders superdelegates, -2 O’Malley superdelegates (they flipped to Clinton). This does not substantively change any of the analysis above and does not get a separate blog post, but a note here was warranted.]
Note: This post is an update based on the data on ElectionGraphs.com. Election Graphs tracks both a poll based estimate of the Electoral College and a numbers based look at the Delegate Races. All of the charts and graphs seen in this post are from that site. Additional graphs, charts and raw data can be found there. All charts above are clickable to go to the current version of the detail page the chart is from, which may contain more up to date information than the snapshots on this page, which were current as of the time of this post. Follow @ElectionGraphs on Twitter or like Election Graphs on Facebook to see announcements of updates or to join the conversation. For those interested in individual general election poll updates, follow @ElecCollPolls on Twitter for all the polls as they are added.
Sanders needed to win 20 of the 35 delegates available in Nevada’s caucuses to be on a pace to catch up with Clinton and win the Democratic nomination. He did not get 20. He got 15. Clinton got 20. There was some talk from the Sanders camp about how much closer Nevada was than it looked like it would be a few weeks ago. That is true. But in the end, the result is Clinton getting 57% of the delegates while Sanders gets 42%.
So Sanders falls further behind. Lets look at the charts.
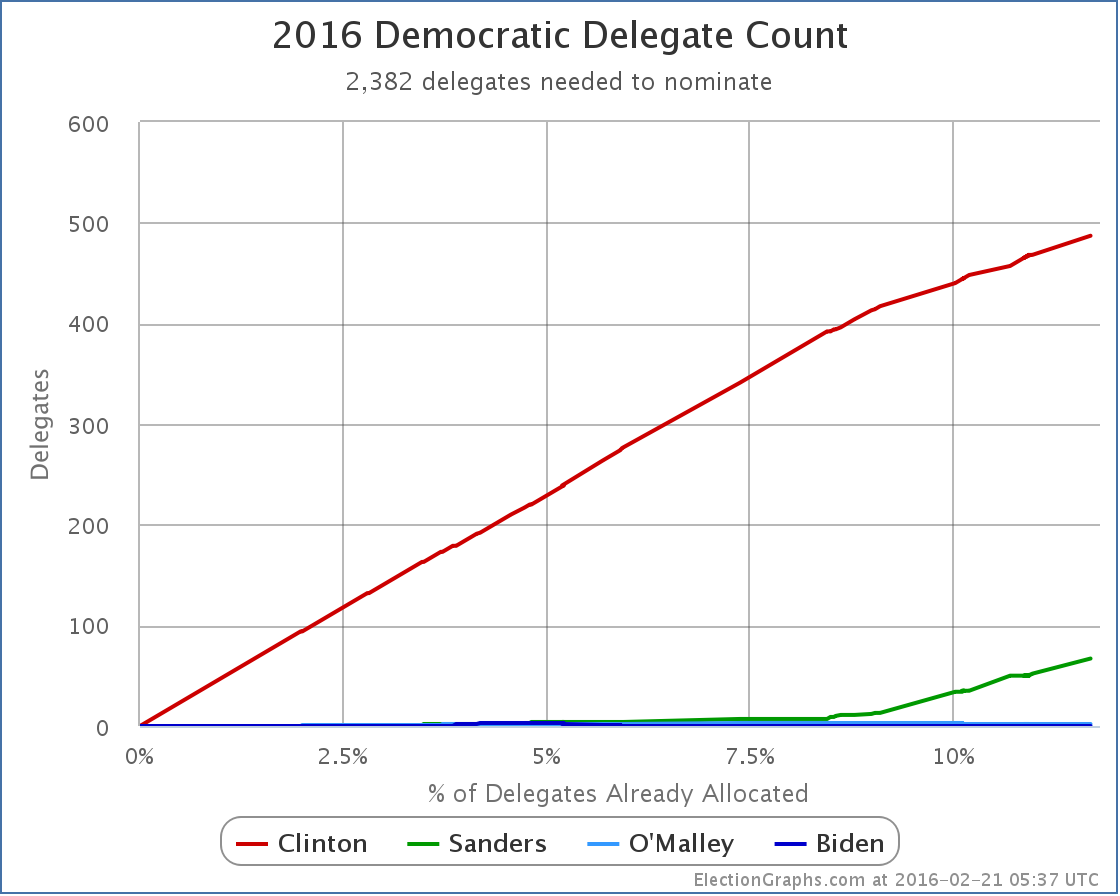
First the straight up delegate counts. We are now at Clinton 487, Sanders 67, O’Malley 2.
In addition to the delegates from the Nevada caucuses, since my last update on the 14th when 42 superdelegates were added for Clinton there have been other updates contributing to those numbers. That includes a number of new delegates identified as being for a candidate, a couple delegates who had been identified as being for a candidate saying explicitly that they considered themselves to be neutral, a few double counting errors corrected, and even one superdelegate dying. The net result was 6 more delegates for Clinton and 2 more for Sanders. And I gave O’Malley back 2 superdelegates who despite his dropping out have not yet stated another preference. In general these changes are backdated to the date there is evidence for them, rather than being dated as of the time I find the change.
Add those all up, and since New Hampshire, Clinton’s total has increased by 68 delegates while Sanders gained 17. If you don’t count the delegates that changed before New Hampshire that I found out about after New Hampshire, it is still 30 Clinton delegates to 17 for Sanders.
Either way, Clinton continues to accumulate delegates faster than Sanders does. That is not a recipe for Sanders catching up. To catch up, Sanders needs to either be getting supermajorities of the delegates from primaries, caucuses and currently unpledged superdelegates, or he needs to be getting quite a few current Clinton superdelegates to defect. So far neither of those things have been happening.
(Note: AP and CNN have Clinton’s delegate totals even higher, presumably due to some non-public superdelegate commitments they know about but haven’t published. The above counts are mostly using superdelegate counts from Wikipedia except for a handful of cases where I have deviated for specific reasons where I believe I have a better count.)
So, how is the “% of remaining delegates needed to win” looking?
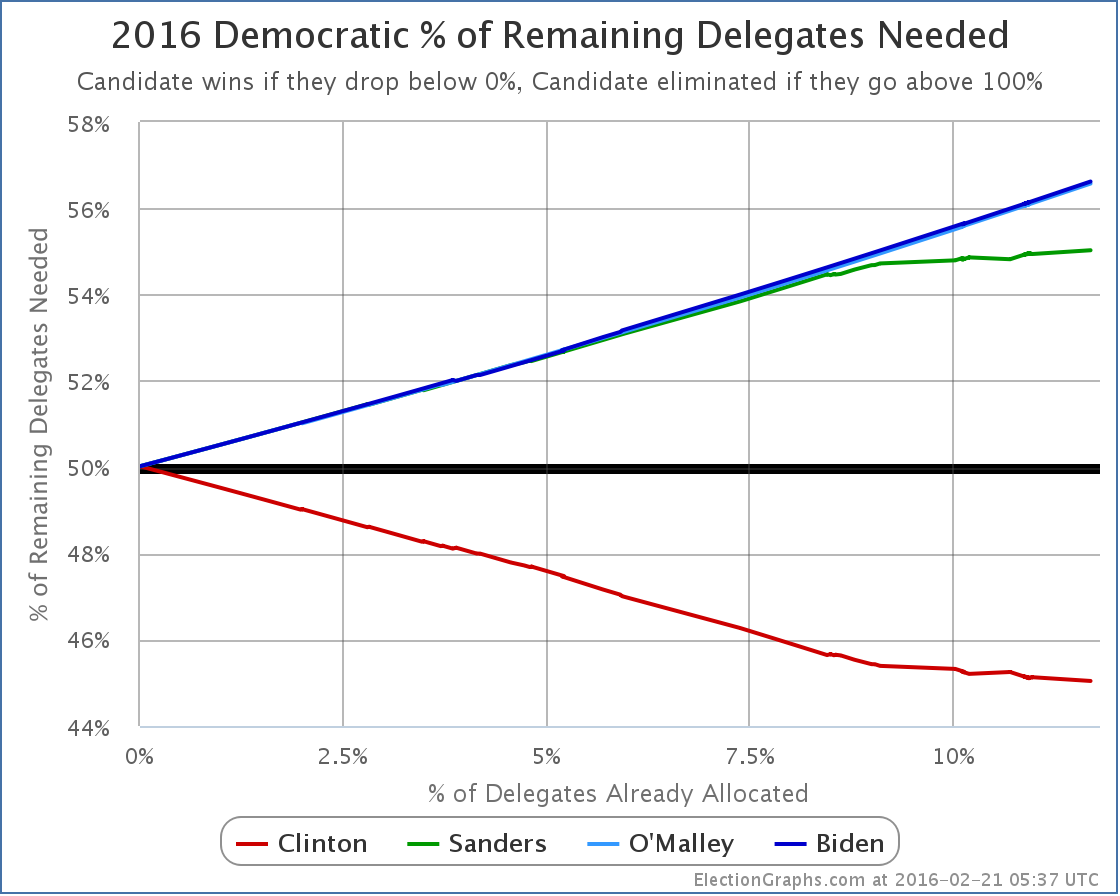
Since Sanders has not been making his percentages, and Clinton has, Clinton’s line is slowly dropping, and Sanders’ is slowly rising. Slowly is the watchword here though. Sanders is now up to 55.03%. Right before Iowa, this was at 54.22%. (Counting the postdated delegates, 54.72%.) Sanders hasn’t done well enough that he is actually catching up with Clinton, but he has done well enough to keep the movement on this number low. He is ALMOST keeping Clinton from making progress. Almost but not quite.
As more delegates get racked up, assuming Sanders continues to collect less than 55% of the delegates, it will not only get harder and harder to catch up to Clinton, it will also get harder and harder to prevent that red line from zooming downward to zero, the point where Clinton wraps up the nomination.
For now though, while he isn’t stopping her, Sanders is clearly slowing Clinton down more than she would like.
Next up, South Carolina.
Update 2016-02-26 15:55 UTC – Completed a scan for superdelegate changes. Net result is +6 Clinton superdelegates… plus one new O’Malley superdelegate. This is not actually a NEW O’Malley superdelegate, but one that declared their support back in November but just hadn’t been logged yet, and there is not yet evidence of them stating they are now uncommitted or backing another candidate. These changes have no substantive effect on the analysis above.
Update 2016-02-28 03:24 UTC – Another scan for superdelegates in preparation for adding in South Carolina results. Net result Clinton +4, Sanders +1. This again has not substantive effect on the analysis above, but putting a note here since it is not worth a blog post of its own.
Note: This post is an update based on the data on ElectionGraphs.com. Election Graphs tracks both a poll based estimate of the Electoral College and a numbers based look at the Delegate Races. All of the charts and graphs seen in this post are from that site. Additional graphs, charts and raw data can be found there. All charts above are clickable to go to the current version of the detail page the chart is from, which may contain more up to date information than the snapshots on this page, which were current as of the time of this post. Follow @ElectionGraphs on Twitter or like Election Graphs on Facebook to see announcements of updates or to join the conversation. For those interested in individual general election poll updates, follow @ElecCollPolls on Twitter for all the polls as they are added.
Edit 17:17 UTC to add note about AP and CNN delegate counts.
Since the New Hampshire primary, I have seen a flurry of Facebook posts and numerous articles all over the place, first by people suddenly shocked to learn of the existence of superdelegates, then folks complaining about the DNC “screwing over” Sanders, and then folks claiming superdelegates should be ignored because they don’t matter. All this in response to places, like my site electiongraphs.com, that point out Clinton’s huge lead due to superdelegate counts.
My current chart of raw delegate totals looks like this:
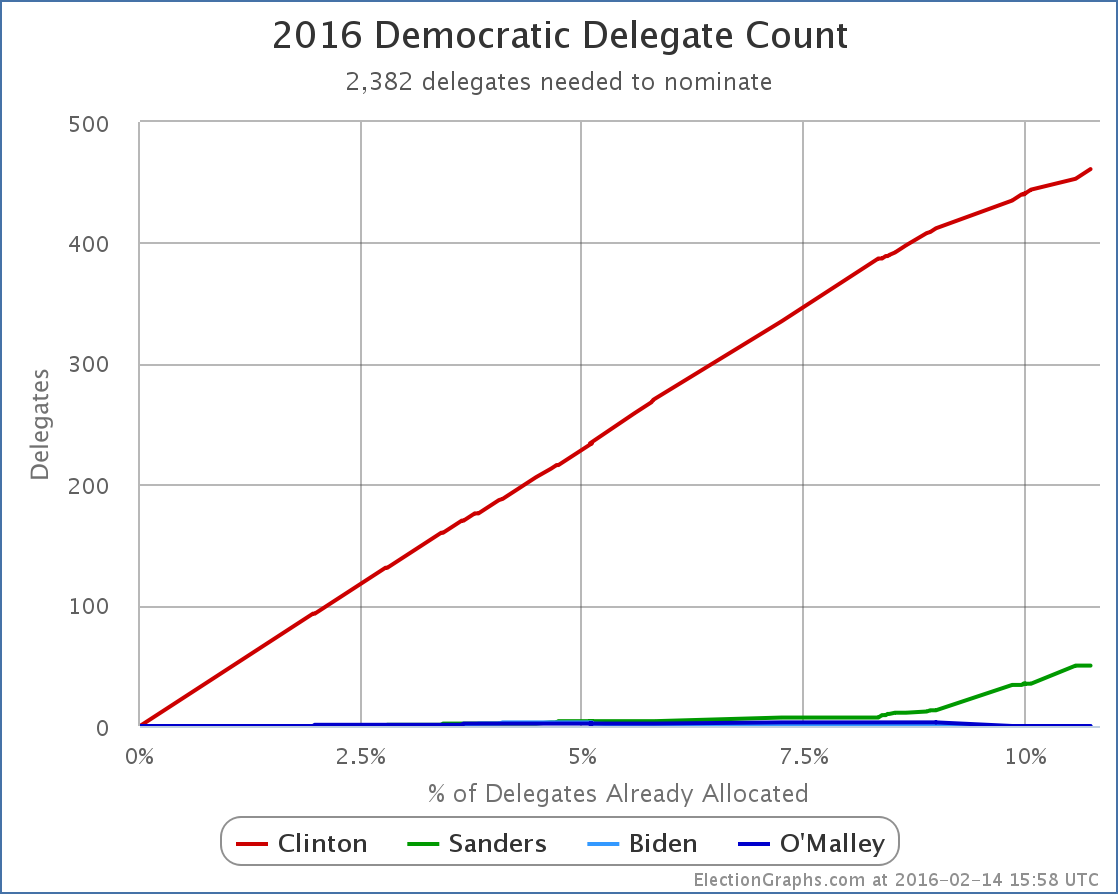
That is Clinton 461 to Sanders 50 including the latest updates that prompt this post.
The claim is that the Clinton lead here is a complete illusion. That counts that look like this are simply anti-Sanders propaganda meant to discourage Sanders voters, that looking at numbers like this is meaningless, and one should only look at “pledged” delegates, where the total right now would be Sanders 36, Clinton 32. That would indeed show a very different picture of the race. Sanders would actually be winning!
But really? Would that tell us where the race really is?
First of all, there isn’t any secret or underhanded manipulation. There are 32 delegates in New Hampshire. 24 of them were to be determined by the primary. Of these Sanders won 15 and Clinton won 9. Some of those are determined proportionately in each congressional district, some proportionately by the statewide results. Those numbers come straight from the votes. Just math.
Then there were also 8 “super delegates”. That is one Senator, one Representative, one Governor, and five members of the DNC. These are eight people who have names and have been known for ages. Six of those eight had declared they supported Clinton long before the primary. The other two haven’t publicly stated a preference yet. That means the delegate total in New Hampshire is now 15 to 15 with 2 not yet determined.
The Sanders folks might not like that, or like the existence of super delegates at all, but none of this is new or an unexpected manipulation or anything, it is simply how the race is structured. A lot of people are expressing shock because they are just now realizing this, but it is no surprise to anyone familiar with the Democratic primary process, and certainly Sanders’ campaign staff is quite familiar with it.
As we’ve chronicled here, Clinton started out with nearly 8% of the national convention delegates already in her column before the first votes were even cast in Iowa and New Hampshire. She has been working on cultivating those people since at least 2013, probably earlier. Sanders managed to get a handful of these folks, but not many. So he started out way behind, and had to get over 54% of the remaining delegates to be on a pace to catch up and win. A majority wasn’t good enough.
It isn’t a good spot to be in for him, and you might argue that super delegates shouldn’t exist. Yes, superdelegates were originally created and exist to give the party apparatus some buffer against a popularly supported insurgency, and that sounds like Sanders. But the superdelegates have existed for decades and they are a known part of the process.
So complaining about them at this point is along the same lines as complaining about the electoral college. The person complaining might be right that in some ways a straight popular vote would be more “fair”, but these were the rules of the game and anybody running knew the rules when they chose to play.
It wasn’t superdelegates specifically that made the difference, but remember that in 2008, Hillary Clinton won the popular vote in the Democratic primary process.* It was only the structure of the delegate race that won Obama the nomination. Because those were the rules of the game. That is still the case today. And that includes superdelegates.
OK, fine, but what about the fact that super-delegates can change their minds? Their votes aren’t locked in stone, and they certainly wouldn’t want to overturn the results if a candidate was winning all the contests and had a majority of the non-super delegates, right? So since they can change their minds and will probably support “the winner” we should ignore them, right?
Indeed, it is important to note that the super-delegates are real people and complete free agents. They can and do change their minds. And yes, superdelegates may be reluctant to be the deciding factor in a close race, but you can’t really say “the super delegates would do X”. It is 712 individual humans, who will each decide on their own what they want to do.
Many superdelegates have yet to express a preference at all and can probably be fairly easily swayed. They have not expressed an opinion for a reason, and may well go either way. Others have publicly supported Clinton, but it could be weak support and maybe they could be flipped if they were actually courted. Many others are actually actively working on the Clinton campaign in prominent state level roles. People in this last category are unlikely to change their votes unless or until Clinton herself drops out and asks them to. At the very extreme, Bill Clinton is a superdelegate. Is he going to vote for Sanders?
You really do have 712 different people, with 712 different reasons for their preferences, and 712 different degrees of how strongly they support their candidate.
If Sanders was serious about the superdelegates, he and his surrogates wouldn’t be pushing talking points about how superdelegates don’t matter and will vote for the popular winner so they should be ignored. Instead he would be heavily lobbying the currently uncommitted superdelegates to start backing him. They are a constituency to be courted. They are an IMPORTANT constituency to be courted.
If you were to see such movement, the first place you would detect it would probably be a higher percentage of currently uncommitted superdelegates raising their hands for Sanders when they do come out and reveal a preference.
Superdelegates who have already publicly stated they are supporting Clinton will probably not start actually flipping back to uncommitted or to Sanders until or unless things are actually looking very dire for Clinton.
If you do end up seeing Sanders winning more contests than he loses and building up a big lead in the regular non-super delegates, you may start to see both kinds of movement. After all, people like backing a winner. But if it happens, you will actually see that change happening in the delegate counts if you watch this site or one of the other places that include superdelegates in the totals. It will not be invisible.
There is no sign of any such movement yet.
Can Sanders win without flipping any Clinton superdelegates over to his side? Yes, of course he can. It is a high bar, but it is within the realm of possibility. He just needs to get about 55% of the remaining delegates.
Can Sanders win with even a smaller portion of the remaining delegates? Why yes, of course he can, if he starts convincing Clinton delegates to change their minds. But if that is going to happen, they have to actually be convinced to do so. Here is a list. Go start lobbying them. Try to change their minds. But nobody should be assuming that is automatic.
Yes, if Sanders ends up leading the non-superdelegate count at the end of the primary season and superdelegates are the only thing putting Clinton over the edge, there will be extreme pressure on the superdelegates to flip. But they still have to actually do so. And most likely, when they start waffling on their positions, they will actually say so, and we will know.
The delegate counts including superdelegates are NOT misleading. You just have to interpret them correctly… meaning that you know superdelegates are actual human beings that can change their minds, and you think about what situations might lead that to happen. But ignoring that they exist and just assuming that of course they will change their minds is extreme folly. It is sticking your head in the sand and ignoring reality. It is willfully blinding yourself in order to believe in an illusion instead. If and when the superdelegates start changing their minds, we will see it. Until or unless that happens, Clinton really does have a huge delegate lead that Sanders would have to overcome in order to win.
Meanwhile, as the Sanders camp has been complaining about superdelegates and how they don’t matter, superdelegate movement to Clinton has continued. Since the New Hampshire Primary results, I’ve added 44 additional superdelegates to Clinton’s column. Not all of these actually announced their support this last week, some did so months ago, but I just found the references more recently. Their support gets backdated in the charts and graphs to the date of the public source documenting their support. I also removed 2 Clinton superdelegates that had been accidentlly double counted. Net gain, Clinton +42.
There were no new Sanders superdelegates.
So where does that put us on “% of remaining delegates needed to win”?
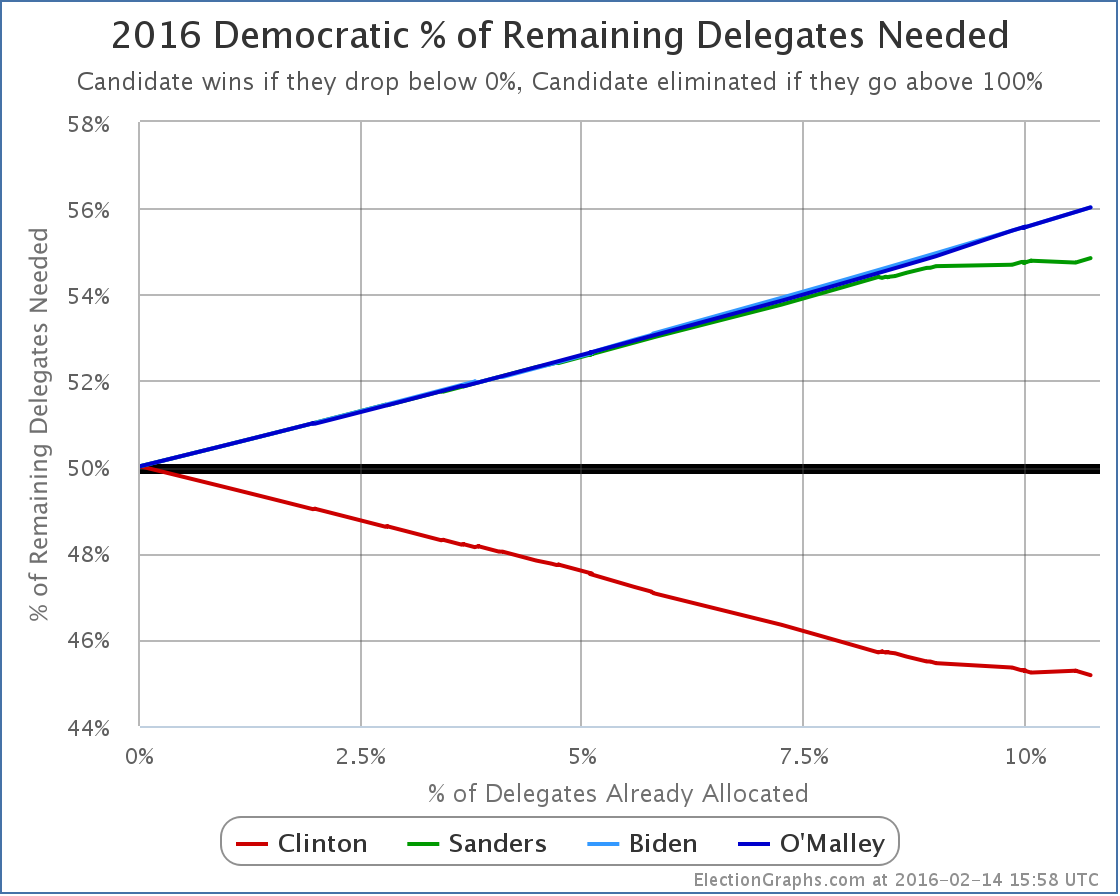
Clinton now needs only 45.18% of the remaining delegates to win.
Sanders needs 54.84%. Right before the Iowa caucuses, my best estimates were that sanders needed 54.22%. (Including pre-Iowa superdelegate preferences I know about now that weren’t included at the time, it would have been 54.65%.) So despite his close second in Iowa, and his win in New Hampshire, Sanders is worse off in the delegate race than he was before Iowa. But not by much… he has ALMOST been holding things steady. He needs to do better to catch up and win, but Iowa and New Hampshire are only a small portion of the overall delegates, so there is still a lot of room to maneuver.
The next delegate race is Nevada.
There are 35 delegates up for grabs in Nevada that will be determined by the caucuses there. Plus 8 superdelegates. Of these, 3 have already said they are for Clinton, and 1 has said they are for Sanders. So don’t be surprised when you see those added in at places showing the state delegate count. They aren’t part of the 35 determined by the caucus though.
Of the 35, Sanders needs to get 20 in order to be on a pace to catch up with Clinton. (Again, assuming no superdelegates change their minds, if a lot do, this number becomes lower.) The RCP average has Nevada at Clinton 47.5%, Sanders 36.0%. That certainly wouldn’t get Sanders the 20 delegates he needs, but that average only includes one post-New Hampshire poll, and that new poll shows the race tied. The Pollster average discounts the pre-New Hampshire results entirely and shows the race at 45% to 45%… a tie.
Delegate rules are tricky. In Nevada some delegates are determined at the congressional district level, others at the state level, there is rounding involved, etc, etc. It is also a multi-stage caucus process, not a primary, so the “real” delegate totals won’t be known until May. But we will have estimates.
Remember though that it is not that Sanders needs 54.84% of the popular vote. It is that he needs 20 of the 35 delegates. That is the number to watch.
And superdelegates of course. :-)
A final thought: It is very possible to catch up from a deficit. But catching up is much harder if you pretend you aren’t actually behind.
* It has been pointed out to me that this would likely not have been the case if Obama had, like Clinton, chosen to compete in Michigan despite DNC sanctions… Clinton essentially ran unopposed in Michigan and this margin was enough to put her in the lead in the national popular vote. If you do not include Michigan, Obama lead the popular vote in 2008. This does not however change the point, which was that there are many ways that the delegate rules can lead to results that differ from the popular vote, of which the superdelegates are only one.
Note: This post is an update based on the data on ElectionGraphs.com. Election Graphs tracks both a poll based estimate of the Electoral College and a numbers based look at the Delegate Races. All of the charts and graphs seen in this post are from that site. Additional graphs, charts and raw data can be found there. All charts above are clickable to go to the current version of the detail page the chart is from, which may contain more up to date information than the snapshots on this page, which were current as of the time of this post. Follow @ElectionGraphs on Twitter or like Election Graphs on Facebook to see announcements of updates or to join the conversation. For those interested in individual general election poll updates, follow @ElecCollPolls on Twitter for all the polls as they are added.
[Edit 18:06 to add link to Wikipedia superdelegate list.]
[Edit 18:48 to add final thought.]
[Edit 2016-02-16 06:50 UTC to add asterisk note about Michigan.]
Lets jump right to it. In the last Democratic update we mentioned that to actually improve the “% of remaining needed to win” Sanders needed to get 54.36% of the delegates available in New Hampshire. That would be 14 out of 24 delegates that were available today. He got 15 out of 24, or 62.5% of yesterday’s delegates. So he did it!
In addition, since my last update, there were some superdelegate changes. The net change from those was +1 Clinton, +1 Sanders. There was also a net reduction of 1 available delegate, bringing the total number of Democratic delegates down to 4,763.
With all of that in place, here is the new chart for “% of remaining needed to win”:
The Sanders % Needed has indeed gone down, and he made Clinton’s go up!
Sanders’ % Needed specifically moved from 54.36% to… 54.30%.
This was at 54.22% before Iowa. 54.30% matches where this was right after Iowa.
So, Sanders did improve his situation, but only enough to undo the superdelegate changes that happened after Iowa, not enough to get back even to where he was before the voting started.
Another way to look at this is to just look at New Hampshire itself. Of delegates allocated by the Primary, Sanders got 15 delegates to Clinton’s 9. But New Hampshire also has 8 superdelegates, and 6 of these had already declared for Clinton.
So the actual New Hampshire total as of today is 15 Clinton, 15 Sanders, 2 TBD.
So even with his big win, which was indeed a big win, Sanders actually has only pulled even in delegates in the state.
Now, of course, superdelegates can change their mind. It has been said that if one candidate was clearly leading absent superdelegates, the superdelegates would not go against them, and would start to change their minds and flip to the candidate leading in non-super delegates. Maybe. It could happen. And if it does, that movement will be tracked here. Certainly no such movement has been seen yet.
In the mean time, next up for the Democrats is Nevada on February 20th. Nevada often gets relatively little attention compared to South Carolina, but Nevada will actually be the next place where we see if Sanders is able to take his New Hampshire results and build anything longer term out of it.
Nevada is a caucus state, so delegates won’t actually be allocated on the 20th, but there will be results that can be used to estimate convention delegates. Nevada has 43 delegates. Of those 8 are superdelegates. Clinton already has 3 superdelegates in her column, Sanders has 1. Nevada’s caucuses will determine 35 delegates. 23 will be allocated based on results in the 4 congressional districts, 12 will be allocated based on the state wide results.
To once again have a result that keeps him on pace to catch up to Clinton and win, Sanders needs to get 20 of the 35 delegates available on caucus day, assuming no additional superdelegate declarations or other adjustments between now and then.
At the moment, Nevada poll averages show Clinton leading 50.0% to 30.5%… but there has been no polling there since December. Expect a variety of new polls in the next week. Watch them carefully. For Sanders to be on track, these numbers have to flip… and then Sanders has to build an even larger lead.
In South Carolina, a week after Nevada, Clinton is even further ahead, although again polls there are stale and new ones taken post-Iowa post-New Hampshire are eagerly awaited.
Between now and Nevada, and probably between now and South Carolina, there will be almost non-stop talk about Sanders’ threat to Clinton, how Clinton is a lot weaker than expected, how vulnerable she is. A lot of this is true. To a degree.
But to evaluate if Sanders is actually a threat to Clinton eventually taking the nomination, as opposed to just being a temporary speed bump in her way, Sanders has to not only take the lead in Nevada, South Carolina and beyond, but be ahead by a significant margin, not just a little bit. This is a tall order. Maybe it is possible.
But if there is talk about how Sanders is “closing the gap” or “making it closer than expected” in Nevada or South Carolina, keep in mind that isn’t enough. He needs to actually win and win by a large enough margin to get more than 54.30% of the delegates to be on pace to catch up and win. Otherwise, the task in later states just becomes even harder.
Note: This post is an update based on the data on ElectionGraphs.com. Election Graphs tracks both a poll based estimate of the Electoral College and a numbers based look at the Delegate Races. All of the charts and graphs seen in this post are from that site. Additional graphs, charts and raw data can be found there. All charts above are clickable to go to the current version of the detail page the chart is from, which may contain more up to date information than the snapshots on this page, which were current as of the time of this post. Follow @ElectionGraphs on Twitter or like Election Graphs on Facebook to see announcements of updates or to join the conversation. For those interested in individual general election poll updates, follow @ElecCollPolls on Twitter for all the polls as they are added.
I’ve promised not to post every day there is an update of a superdelegate here or there. Instead, I’ll generally include them in the next post after an actual primary or caucus. However, if enough accumulate, I’ll go ahead and do a post just on superdelegates. There have been 10 superdelegate changes since my last post on the Democrats. That’s as good a threshold as any, so here is a quick update.
First of all, I probably should have made this change before that last post, but I didn’t… O’Malley dropped out on caucus night shortly after the results started coming in, as it was immediately clear that as expected he would not have a good night. If O’Malley had earned actual pledged delegates, they would remain in his column until such time as O’Malley formally released them. But these superdelegates are always free agents, and with O’Malley out, there is no reason to believe their previous endorsements of O’Malley still stand. So I zeroed out O’Malley’s three superdelegates. Goodbye O’Malley.
In addition, news reports showed 5 new Clinton superdelegates in Illinois, and 2 new Clinton superdelegates in Iowa.
So, net Change: Clinton +7, O’Malley -3.
New “% of remaining needed to win chart”:
And the updated data chart:
As of my post-Iowa summary post, Sanders needed 54.30% of the remaining delegates to catch up. That is now up to 54.36%.
In terms of New Hampshire specifically, this doesn’t matter of course. Either way Sanders needs 14 of the 24 delegates that will be allocated based on the primary in order to be on a pace to catch Clinton.
Five days until New Hampshire.
Note: This post is an update based on the data on ElectionGraphs.com. Election Graphs tracks both a poll based estimate of the Electoral College and a numbers based look at the Delegate Races. All of the charts and graphs seen in this post are from that site. Additional graphs, charts and raw data can be found there. All charts above are clickable to go to the current version of the detail page the chart is from, which may contain more up to date information than the snapshots on this page, which were current as of the time of this post. Follow @ElectionGraphs on Twitter or like Election Graphs on Facebook to see announcements of updates or to join the conversation. For those interested in individual general election poll updates, follow @ElecCollPolls on Twitter for all the polls as they are added.
The Iowa caucuses have finally come and gone, and we have the first “earned” delegate results of the nomination race. Sorta. No actual Democratic delegates were actually determined. It was just the first step in a multi stage process. But as of now, estimates can be made. The estimates as per The Green Papers are 23 delegates for Clinton and 21 for Sanders. There were also 4 Iowa superdelegates already for Clinton.
So the Iowa totals as of this post are: 27 Clinton, 21 Sanders, 4 superdelegates TBD.
Even if all 4 remaining superdelegates went for Sanders, which is unlikely, Clinton still wins Iowa 27 to 25.
This despite the predominant reporting of tonight’s results as a tie or near-tie for Sanders.
In addition, since my last post on the Democrats in other states there have been 3 additional super delegates who came out for Clinton, and 2 who came out for Sanders.
So, where does that put us? First, the raw delegate totals:
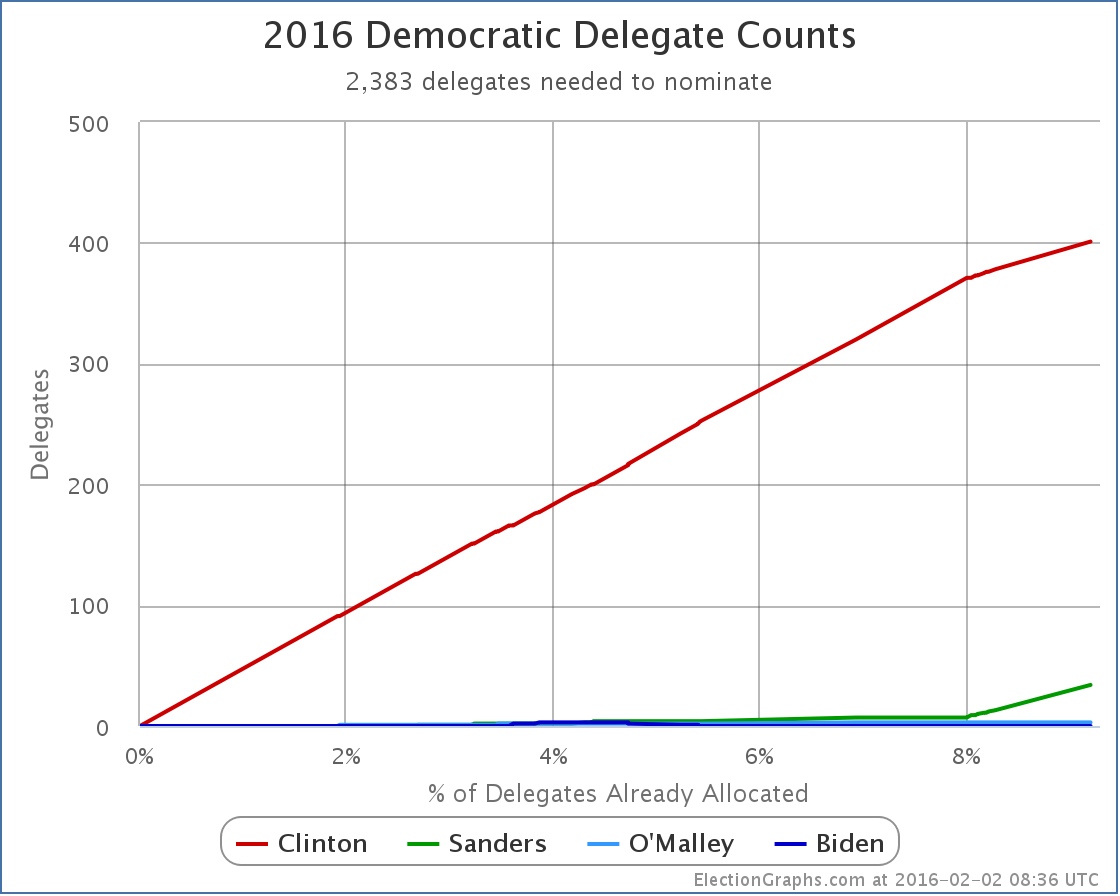
You can see the “kink” in the chart that is the result of Clinton getting a much smaller percentage of the Iowa delegates than her absolute domination in the superdelegate race. This of course means her percentage of the delegates so far takes a bit of a swoon:
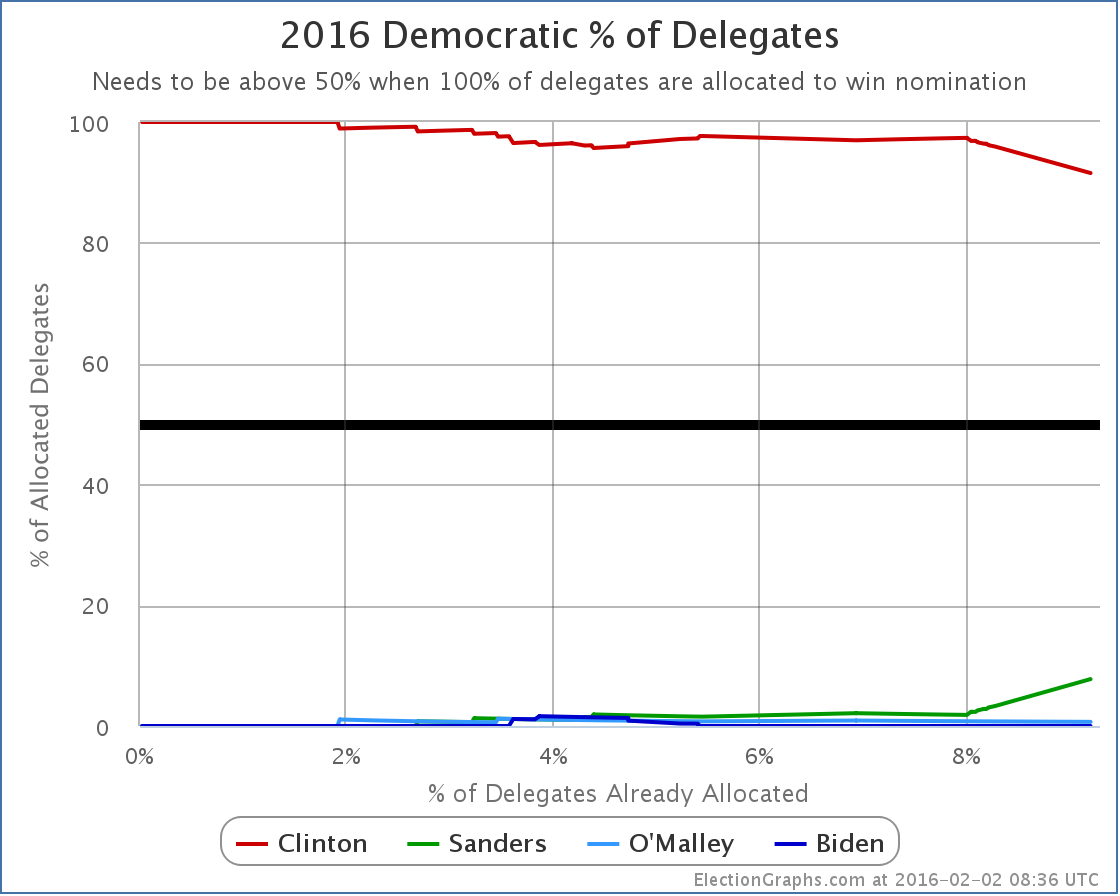
Clinton is down to only 91.55% of the delegates allocated so far! That’s the lowest she has been so far!
OK, that is down, but actually it is still pretty dominant.
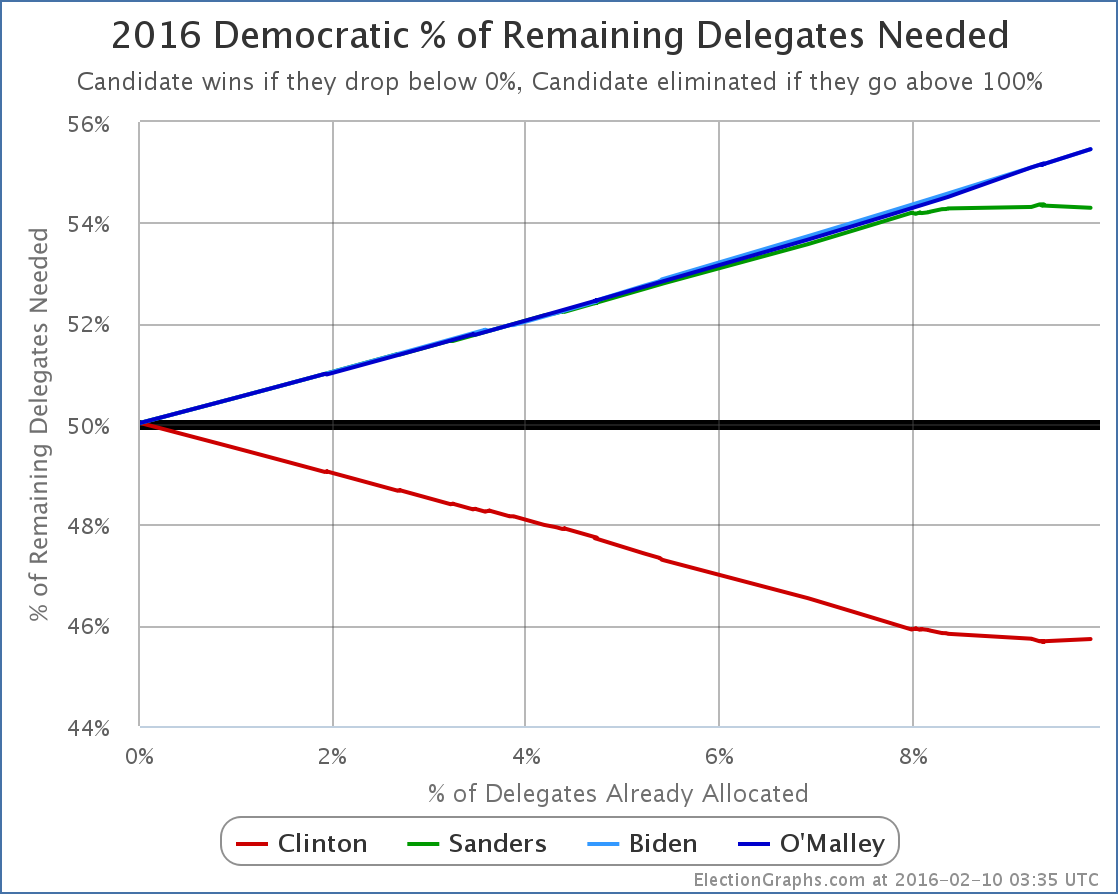
But what does all this do to the critical “% of remaining delegates needed to win”?
When I made the last blog update, Sanders needed 54.22% of remaining delegates to win. Right before tonight’s new Iowa results, that had moved to 54.23%. Adding in the Iowa results it is now… 54.30%. So up a little, but really not by much. Sanders did not do well enough to bring this percentage down. It has to actually go down for Sanders to be on a pace to catch up and win. But he at least did well enough to keep it from getting very much worse than it was.
Looking at the New Hampshire polling, Sanders is currently at 55.5% in the RCP average and 55.2% in the Pollster average. Either way, that is a smidgen above 54.30%. So even if he gets no boost in New Hampshire from his near tie with Clinton in Iowa, Sanders may meet the bar he needs in order to improve his numbers on this metric. He doesn’t have much leeway though. If he drops at all, then he essentially will fall even further behind after New Hampshire.
The states beyond New Hampshire of course look more hostile to Sanders based on early polling. To make any real race out of this, something would need to happen that would cause Clinton to not just do a little worse, but a lot worse. Otherwise, the rest of this Democratic race is just going to be a process of Clinton mopping up, no matter what sort of media hubbub results after a potential Sanders win in New Hampshire.
Note: This post is an update based on the data on ElectionGraphs.com. Election Graphs tracks both a poll based estimate of the Electoral College and a numbers based look at the Delegate Races. All of the charts and graphs seen in this post are from that site. Additional graphs, charts and raw data can be found there. All charts above are clickable to go to the current version of the detail page the chart is from, which may contain more up to date information than the snapshots on this page, which were current as of the time of this post. Follow @ElectionGraphs on Twitter or like Election Graphs on Facebook to see announcements of updates or to join the conversation. For those interested in individual general election poll updates, follow @ElecCollPolls on Twitter for all the polls as they are added.
The Election Graphs delegate tracker is live! In the last few hours I have posted an intro to this effort, a tour of the new features, and a FAQ. But now it is time to get into the meat of things and start talking about results and what they mean.
While the Republican Party does have unbound delegates that will be able to make up their own minds independently, most of those people won’t be officially chosen until the primary/caucus season is well underway, and regardless, I haven’t yet found a good source of information tracking which of these folks is publicly supporting which Republican candidate. So the flow of delegate information for the Republicans won’t start until we get the results of the Iowa caucuses next week.
But on the Democratic side… most of the “superdelegates” are already known (although some may change before the convention). The superdelegates are Governors, Senators, Representatives, members of the Democratic National Committee, and “Distinguished Party Leaders”. As Democratic activists, these people very often are quite public about who they support. And they show up in news reports when they do that. And there are places tracking it.
Since this is the first analysis post of the primary season, I’m going to walk through the charts I use on my site, building up to the main one I believe is the one worth concentrating on going forward. If you just want to get straight to the punchline of how this race is going, skip to the last chart in the post and read from there.
Since June of 2013, slowly but surely, the superdelegates have been publicly choosing sides…
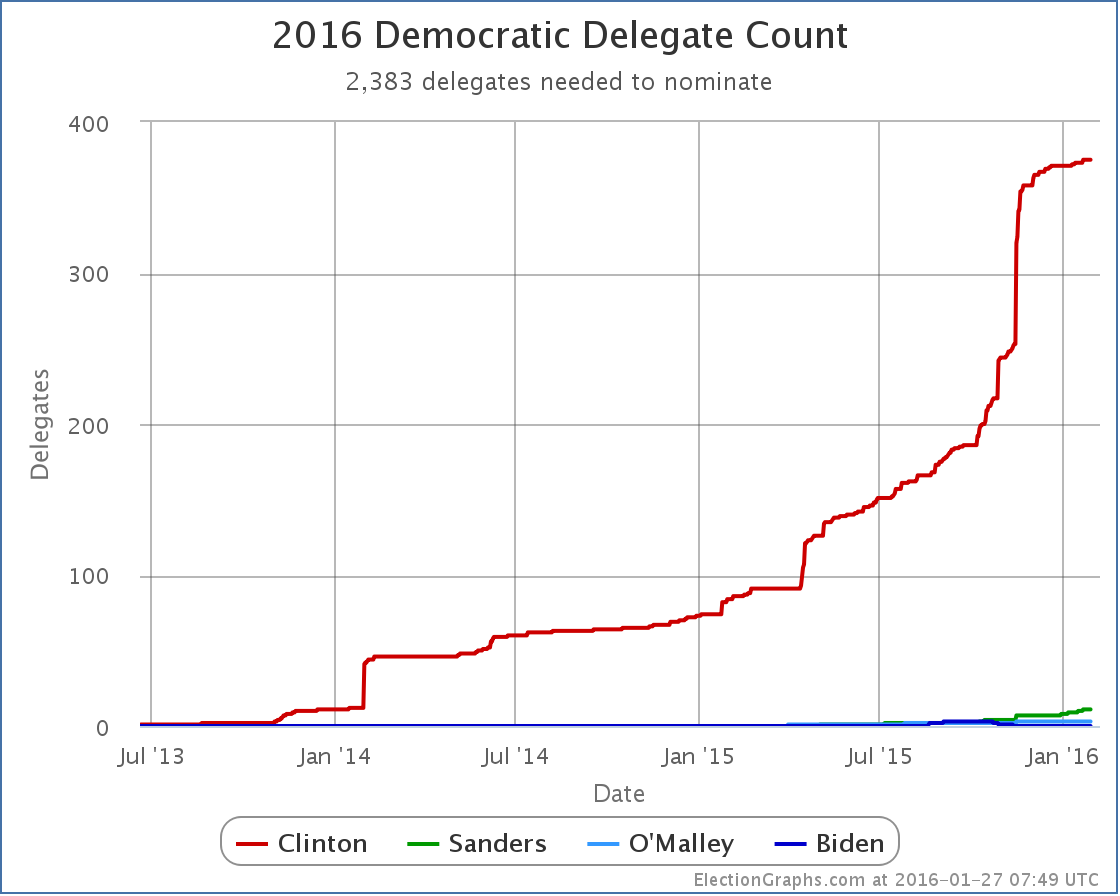
See the red line? That is Clinton. See the Green line? That is Sanders. Clinton is absolutely dominant here.
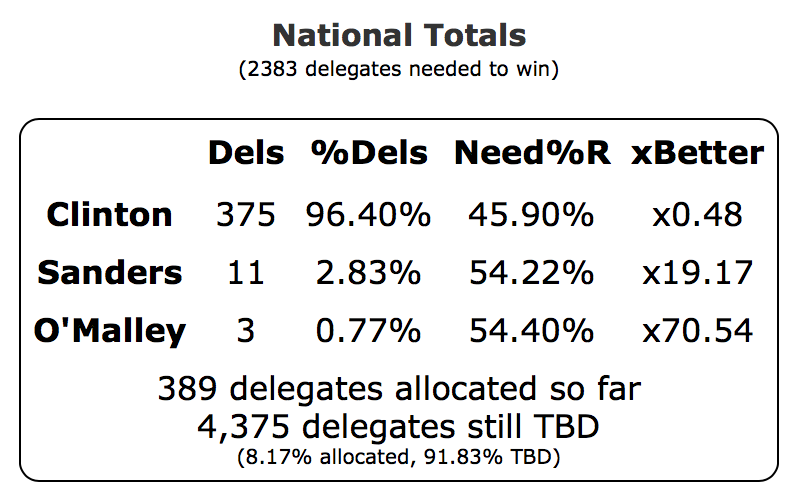
By my best count, 389 of the 713 superdelegates have expressed a preference, and 375 of those have come out for Clinton. Sanders has 11. O’Malley 3.
Now, the chart above is by date. It looks all jumpy because the delegates revealed their preferences at various random times, with a few big jumps when things happened, like Clinton officially announcing, or when AP did a survey of all the superdelegates. That can be interesting, but actually distorts the picture of how the race is coming along. Time to do a quick switch and show how this looks when we look at the % of delegates allocated instead of the date:
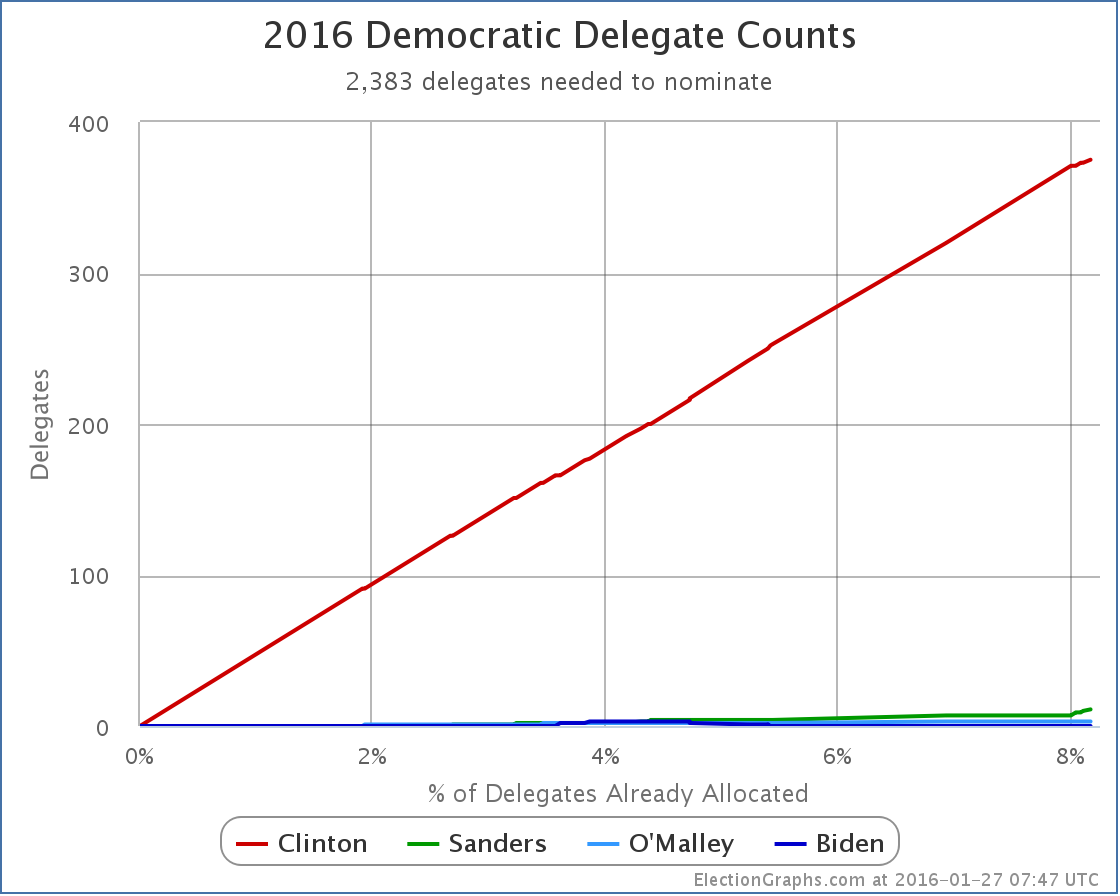
Suddenly, we have nearly a straight line. The lumpiness caused by the uneven distribution of delegate preference announcements over time is gone and we get a much clearer look at what is happening. We see that over 8% of the delegates to the convention have already expressed a preference. Clinton has been consistently racking these up as they come in. She is dominating in this race. But by how much? Lets switch to looking at the % of delegates each candidate has…
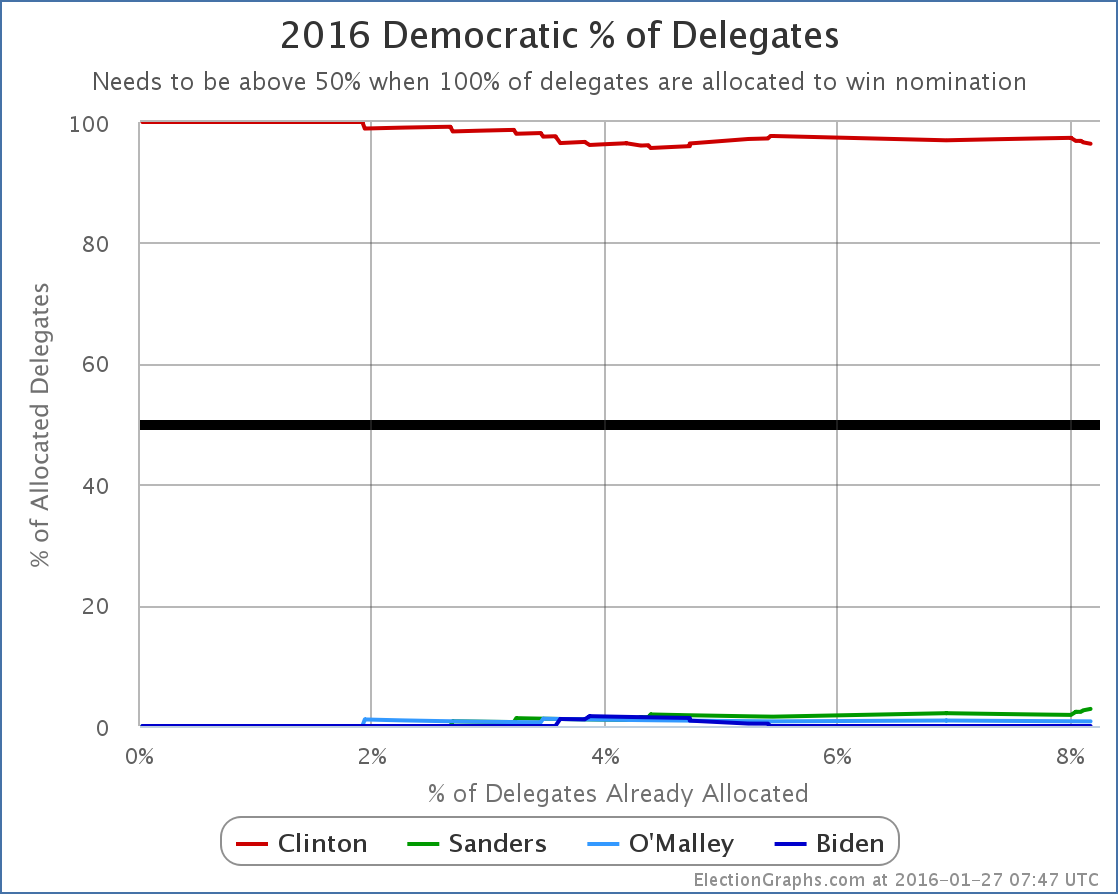
Once again we see that Clinton is dominant, but a few more details start to be seen. For instance we see that so far at least, Clinton’s weakest point was between the 4% and 5% marks when Biden, Sanders and O’Malley all had a few delegates in their columns and Clinton had about half the delegates she has today. But Biden dropped out, and Clinton kept on getting delegates at a pace not matched proportionately by Sanders or O’Malley, so Clinton’s dominant percentage increased again for awhile.
Very recently though, at the tail end of this chart, you can see that Sanders has been collecting delegates at a fast enough pace that his percentage has actually been going up, while Clinton’s has been decreasing. The Sanders percentage is still small, but it is going up. So where does that put Sanders? How about his surge? Can he win?
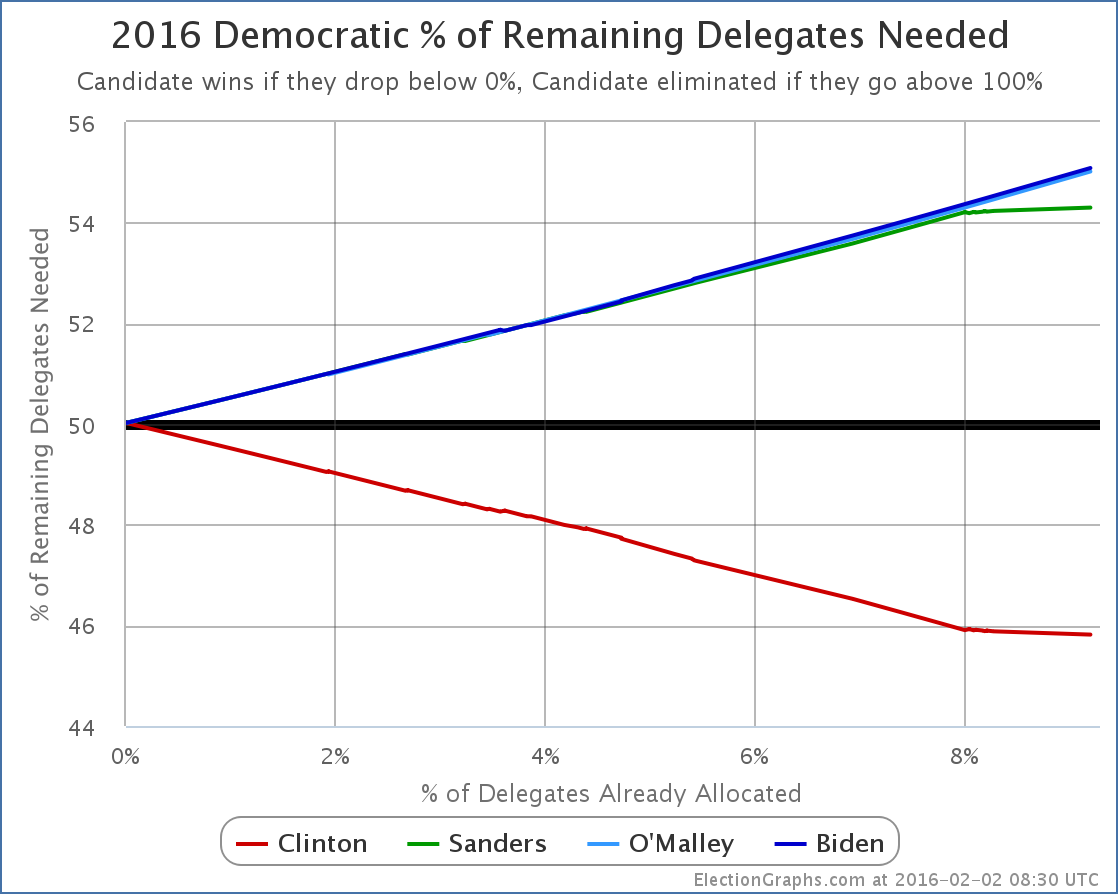
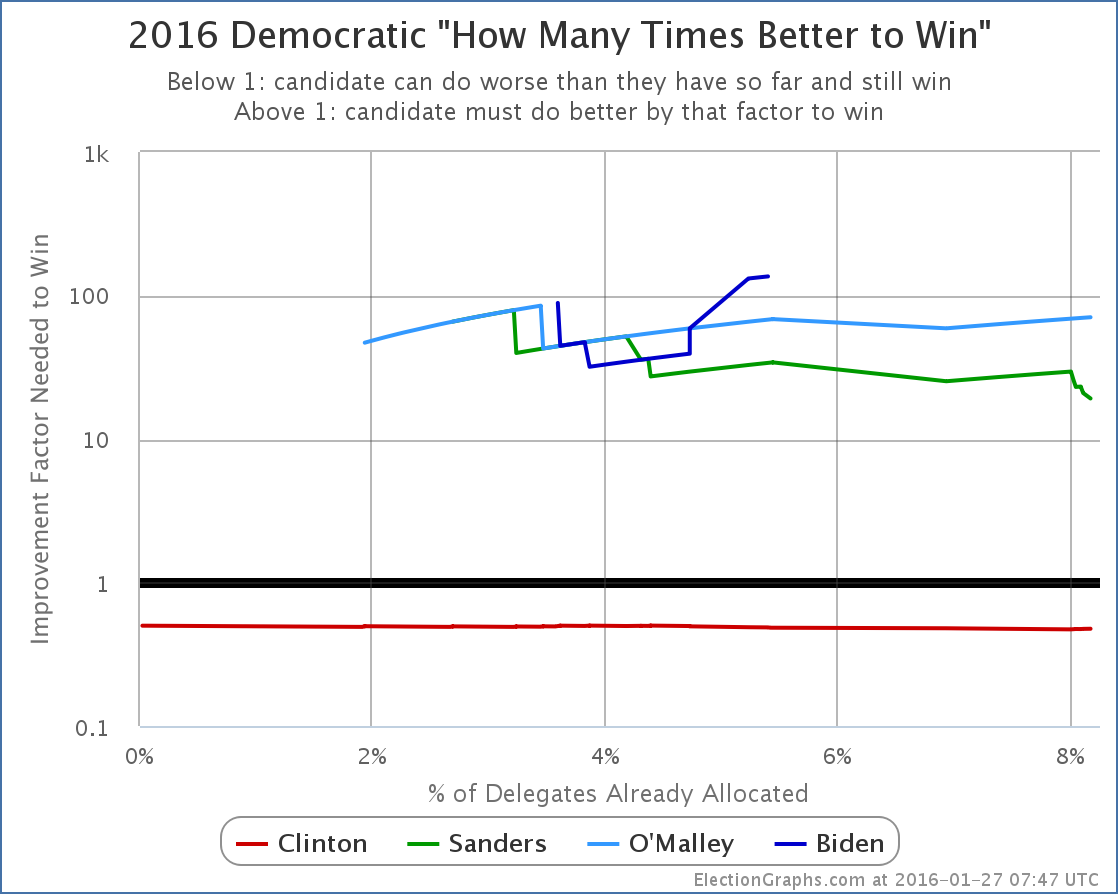
Time to look at the chart I consider to be the most important one to look at for understanding the race. Instead of looking at the percentage of delegates each candidate already has, we shift to looking at the percentage of the remaining delegates that the candidate would need to get in order to win the nomination:
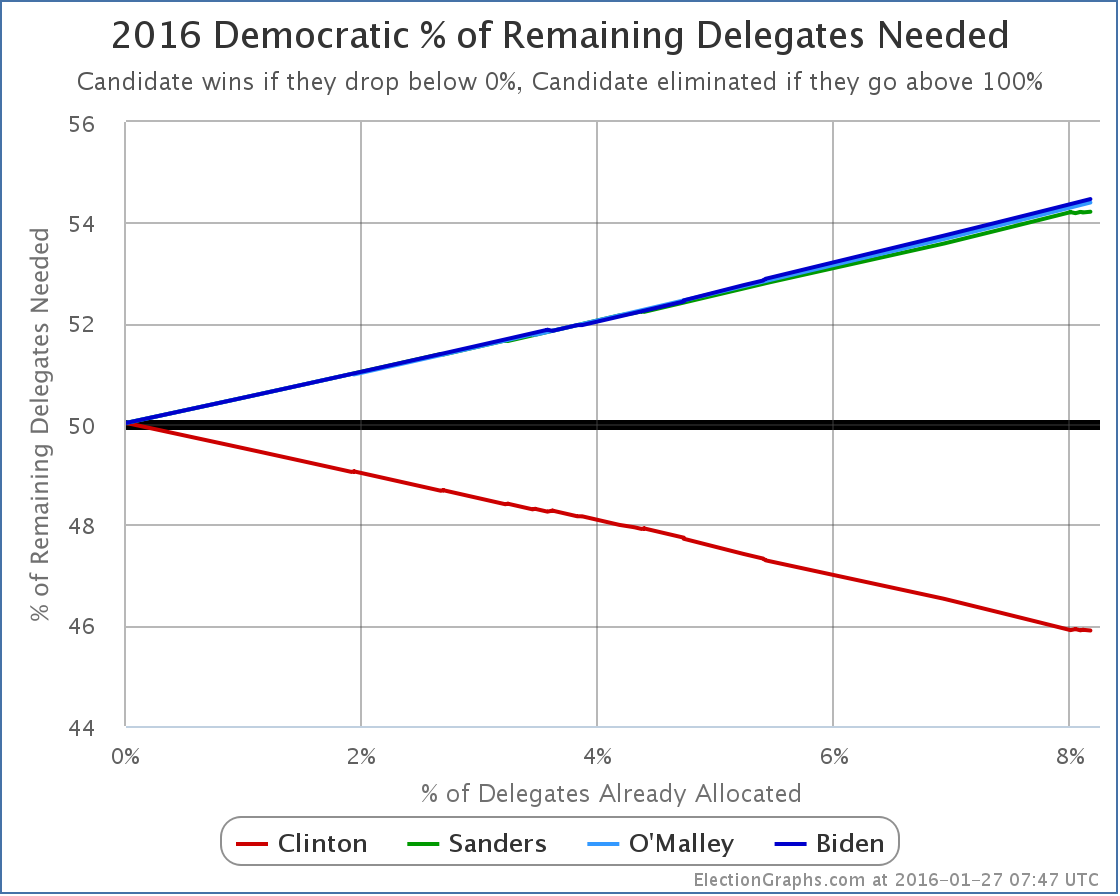
As Clinton racks up delegates, it becomes harder and harder to catch up. With the lead she already has based on superdelegates, in order to win, Sanders doesn’t need to get 50% of the remaining delegates, he needs to get 54.22% of the remaining delegates.
Specifically looking at Iowa, 44 delegates are at stake.
To be clear, no Democratic delegates will actually be earned on the night of the Iowa caucus. It is the first step of a multi-stage process that won’t end until June. But after the precinct caucus results next week, we’ll be able to make estimates based on the initial vote results and what we know about the specific delegate allocation rules in Iowa.
With 44 delegates up for grabs, given the 54.22% number we calculated, for Sanders to actually put himself in a better position after Iowa than before, Sanders doesn’t need 22 or 23 delegates, he needs 24.
Now, if Sanders gets more delegates than Clinton, the media and press coverage about the Sanders surge and the risk to Clinton will be overwhelmingly loud. Nobody other than this site will be talking about how he won, but didn’t get to 24, so he is actually worse off. Everything will be about the Sanders win and his “momentum”.
And there is some fairness to this. If Sanders wins Iowa’s popular vote, no matter what the delegate estimates turn out to be, he will get a lot of positive attention. And people will talk about how Clinton is a lot weaker than she had seemed. That talk may improve Sanders’ position in New Hampshire or in other states further down the road. Perhaps it would boost him enough to compensate for the increase in the “% of remaining needed to win” that would result from falling short of 54.22% in Iowa. Getting a narrow win that doesn’t get enough delegates to actually improve the overall position in the short term may actually still have a positive impact in the medium to long run. Spin matters.
The polls are close in Iowa, either Clinton or Sanders could easily take the state. But the numbers to watch are not the popular vote totals. You shouldn’t even be looking simply at who is estimated to get the most delegates. The question is if the person who gets the most delegates gets enough to be on pace to win.
For someone other than Clinton to win, they have to start by catching up. This already means that they have to get more than 54% of delegates as we go forward. If they fail to reach that number, with each subsequent contest they will have to do even better to catch up.
If they do reach that bar though, each subsequent contest becomes easier. That’s the way it works. But the target is not getting the most delegates in each contest. It is getting more than the number you need to be on pace to win. Right now Sanders needs 54.22% of the delegates. Clinton only needs 45.90% of the delegates. She doesn’t even need to get a majority since she has already banked so many delegates before voting even starts.
So far, in the “invisible primary”, Clinton has scored an incredible 96.4% of the delegates. This will not continue. The Democratic leaders that make up the superdelegates have a very different perspective and background than Iowa caucus goers, or New Hampshire primary voters. Sanders will do better than the 2.8% of delegates he has managed so far. The question is how much better and if it puts him on track to actually catch up and win, or if it quickly becomes apparent that he is just playing the role of the protest candidate almost everyone originally expected him to be.
If Sanders doesn’t get to that 54.22% mark in Iowa, we may know pretty quickly that he is falling short, although if he wins in the popular vote, there will still be a crazy media circus for weeks.
If he exceeds that mark though, then the media howling might actually be warranted. At least until South Carolina. South Carolina is a very different state than either Iowa and New Hampshire, and the picture might change dramatically again after that.
But the next few weeks will be exciting almost any way the results go. And we haven’t even talked about the Republicans this time since there aren’t any delegates to look at quite yet. There will certainly be quite a bit of excitement on that side as well.
Tune in here for all the twists and turns as this race shifts into high gear!
Just under a week until Iowa. Hold on tight.
Note: This post is an update based on the data on ElectionGraphs.com. Election Graphs tracks both a poll based estimate of the Electoral College and a numbers based look at the Delegate Races. All of the charts and graphs seen in this post are from that site. Additional graphs, charts and raw data can be found there. All charts above are clickable to go to the current version of the detail page the chart is from, which may contain more up to date information than the snapshots on this page, which were current as of the time of this post. Follow @ElectionGraphs on Twitter or like Election Graphs on Facebook to see announcements of updates or to join the conversation. For those interested in individual general election poll updates, follow @ElecCollPolls on Twitter for all the polls as they are added.
[Edit 06:45 UTC to fix wording]
[Edit 08:09 UTC to update graphs]
[Edit 08:15 UTC to fix typo]
[Edit 2016-02-02 06:03 UTC to change “Delegate Race” in title to “Democrats” in preparation for separating posts on the two races]
This is a FAQ for the 2016 Delegate Race portion of ElectionGraphs.com. The FAQ for the Electoral College portion is here.
Why are you doing this?
Fundamentally, because I have fun with it. But in addition I think I’ve added a couple things beyond the usual delegate tracking you find everywhere in the primary season that are useful and interesting.
OK, what are those things?
First up is tracking the percentage of remaining delegates needed to win. I think this gives a better measure of how the race is going than just looking at the delegate totals alone, because it captures how much harder it is to change the outcome as the race progresses and the frontrunners accumulate delegates.
Second is tracking the various metrics against the percentage of delegates allocated so far, rather than against the date. This gives a better understanding of just how far along the process it is than the date does, since the distribution of delegate allocation “events” is very clumpy, not evenly distributed through the primary season. This is also influenced by when delegates not bound by primary and caucus results make their decisions, which doesn’t happen on any particular pre-set timetable.
Third, rather than concentrating completely on the current delegate counts, I also show the progression of these metrics over time, giving a sense of how things are developing. Now, the past is not necessarily directly predictive of the future, there is always the possibility that campaign events occur that dramatically change the direction of the race, but looking at how things have been going so far, more often than not, gives you an idea of the most probable way things are going to continue.
Why are your delegate counts different than those at my favorite media outlet?
Until delegates actually do the roll call vote at the convention, delegate counting has a lot of uncertainty involved.
While some delegates are directly bound and known based on primary and caucus night results, many others are determined in a variety of ways that make them hard to count. In some cases there is a multi stage delegate selection process. Some outlets choose not to count delegates in these multi-stage processes until the final delegates are known at the last stage of that process. Others, like this site, attempt to determine an estimate of what the final outcome of the process will be based on the results of the earlier stages. These are estimates, and will almost certainly change and shift as the process continues.
In addition, other delegates are actually complete free agents and can vote for whoever they feel like, and can change their minds repeatedly until they cast their actual vote at the convention. Often delegates for candidates that drop out end up in this category as well if they are “released”. Where these delegates publicly express their support for a candidate, this can be used to predict how they will vote, but even in these cases the delegate can still change their mind.
All of the above means that different outlets will make different choices of how to estimate the delegate count, and will have slightly different numbers. The general trends should be similar though.
So are you some kind of expert in the delegate selection process to make these estimates?
No. Not at all. Many years ago I was a physics major. These days I work at a Seattle tech company. I have no particular expertise in this other than being an interested amateur. My estimates though are for the most part not made by me trying to directly estimate numbers from my own reporting. I consult a number of different sources of information on delegate outcomes and try to come up with numbers that use the best available information from those sources.
OK, so what are those sources?
As I launch the delegate tracker a little less than a week before Iowa, my primary sources so far have been Green Papers, FiveThirtyEight, Wikipedia, and the sites they link as references. Some other sources have also been consulted though, and as the actual contests get underway, I expect I will find information in a variety of other places. If you really want to dig into the details, I include reference notes in my raw delegate data files for the Democrats and Republicans as updates are added.
Doesn’t the fact some delegates can change their minds invalidate the “% of remaining delegates” metric?
Well, it does mean that it is really “% of remaining delegates if none of the already allocated delegates change their mind or were estimated incorrectly”, but in practice in recent contests, this hasn’t made a huge difference. But yes, it is always the case that there can indeed be changes of this sort, and you can imagine situations where this would end up being quite significant. For instance, if the front runner were to have an unexpected health issue, dropping out of the race and releasing all of their delegates half way through the primary season, then of course everything gets scrambled. But even events like this would be nicely represented in the graphs, with the % of delegates allocated moving backwards, and the “% of remaining needed to win” changing appropriately. Absent a dramatic event of that sort though, delegates changing their minds is a minor secondary effect, and the estimates in multi-stage processes are often “close enough”, so these factors are unlikely to have a huge effect on the charts.
Do you come at this with some sort of political bias?
Well, of course. Everybody has some sort of opinion and I do have feelings on the presidential race, both in the primaries and in the general election. When it comes to Election Graphs and the commentaries I post when I make updates to either the Delegate Race numbers or the Electoral College estimates, I try my best to be objective and talk mostly about the numbers, and the implications of the numbers on the results. If you want to hear my less objective and more opinionated thoughts on what is going on, and what should be going on, listen to the podcast I cohost: Curmudgeon’s Corner. I often talk about the objective analysis there too course, but my cohost Ivan and I are not constrained by that. In my actual charts and graphs though, and on the update commentary blog posts, I try to stick to what the numbers are saying.
How often is the data updated?
I have a day job and a family, so my time is often somewhat constrained, but I will try to at the very least do an update within 24 hours of the results being released after each major primary or caucus. In the 2008 and 2012 cycles I did a daily scan for new delegate updates even when there wasn’t a major contest, and would do a post if any numbers changed. (Often they wouldn’t, but I checked every day.) I can’t commit in advance to that daily cycle. It will be a goal, but if life gets in the way, I may miss some days. But certainly when there are new primary and caucus results, I will try to get them included as quickly as possible. I generally won’t do more than one update per day though. So when results are still in flux on election nights, I may choose to wait a bit to post the update, so as to get the best numbers possible.
You’ve done this before?
I started doing electoral vote and delegate tracking online in 2008. You can check out the results from both 2008 and 2012 here.
This is awesome, I’d like to share this or mention it in my own online space, can I?
All of the Election Graphs pages, as well as my blog post commentaries, are released with a Creative Commons Attribution-NonCommercial-ShareAlike 4.0 International license. Feel free to reuse this material within those constraints, although I would appreciate a heads up that you are planning to do so.
For other possible uses or to discuss anything else about this site, please contact Election Graphs via Twitter. That is probably the best way to get my attention quickly rather than having an email lost in my inbox or spam folders.
In terms of sharing on social media (or other media)… of course! That would be great! You may also want to follow @ElectionGraphs on Twitter, or like the Election Graphs Facebook Page. In fact, please do!
This sucks, what a waste of time, you are obviously just a shill for <insert candidate you don’t like>… How can I tell you how awful you are?
I welcome and would love to hear from people who have constrictive criticism about the site, want to discuss methodology, or just want to chat civilly about the implications of the numbers shown on the site. But if you just want to yell at me… do you really have to? It just wastes everybody’s time. If you don’t like the site, don’t visit. But if you do need to make comments like the above, there are places to do that. The links to Facebook and Twitter are above, and comments are open on abulsme.com as well.
Note: This post is an update based on the data on ElectionGraphs.com. Election graphs tracks both a poll based estimate of the Electoral College and a numbers based look at the Delegate Races. All of the charts and graphs seen in this post are from that site. Additional graphs, charts and raw data can be found there. All charts above are clickable to go to the current version of the detail page the chart is from, which may contain more up to date information than the snapshots on this page, which were current as of the time of this post. Follow @ElectionGraphs on Twitter or like Election Graphs on Facebook to see announcements of updates or to join the conversation. For those interested in individual general election poll updates, follow @ElecCollPolls on Twitter for all the polls as they are added.
This post gives an overview of the Election Graphs Delegate Race site for 2016, highlighting the major charts, graphs and features of the site, and how to interpret some of that is there. Or just ignore this and go to the site and explore. But if you want an item by item explanation of what you will see there, then read on.
New Overview Page
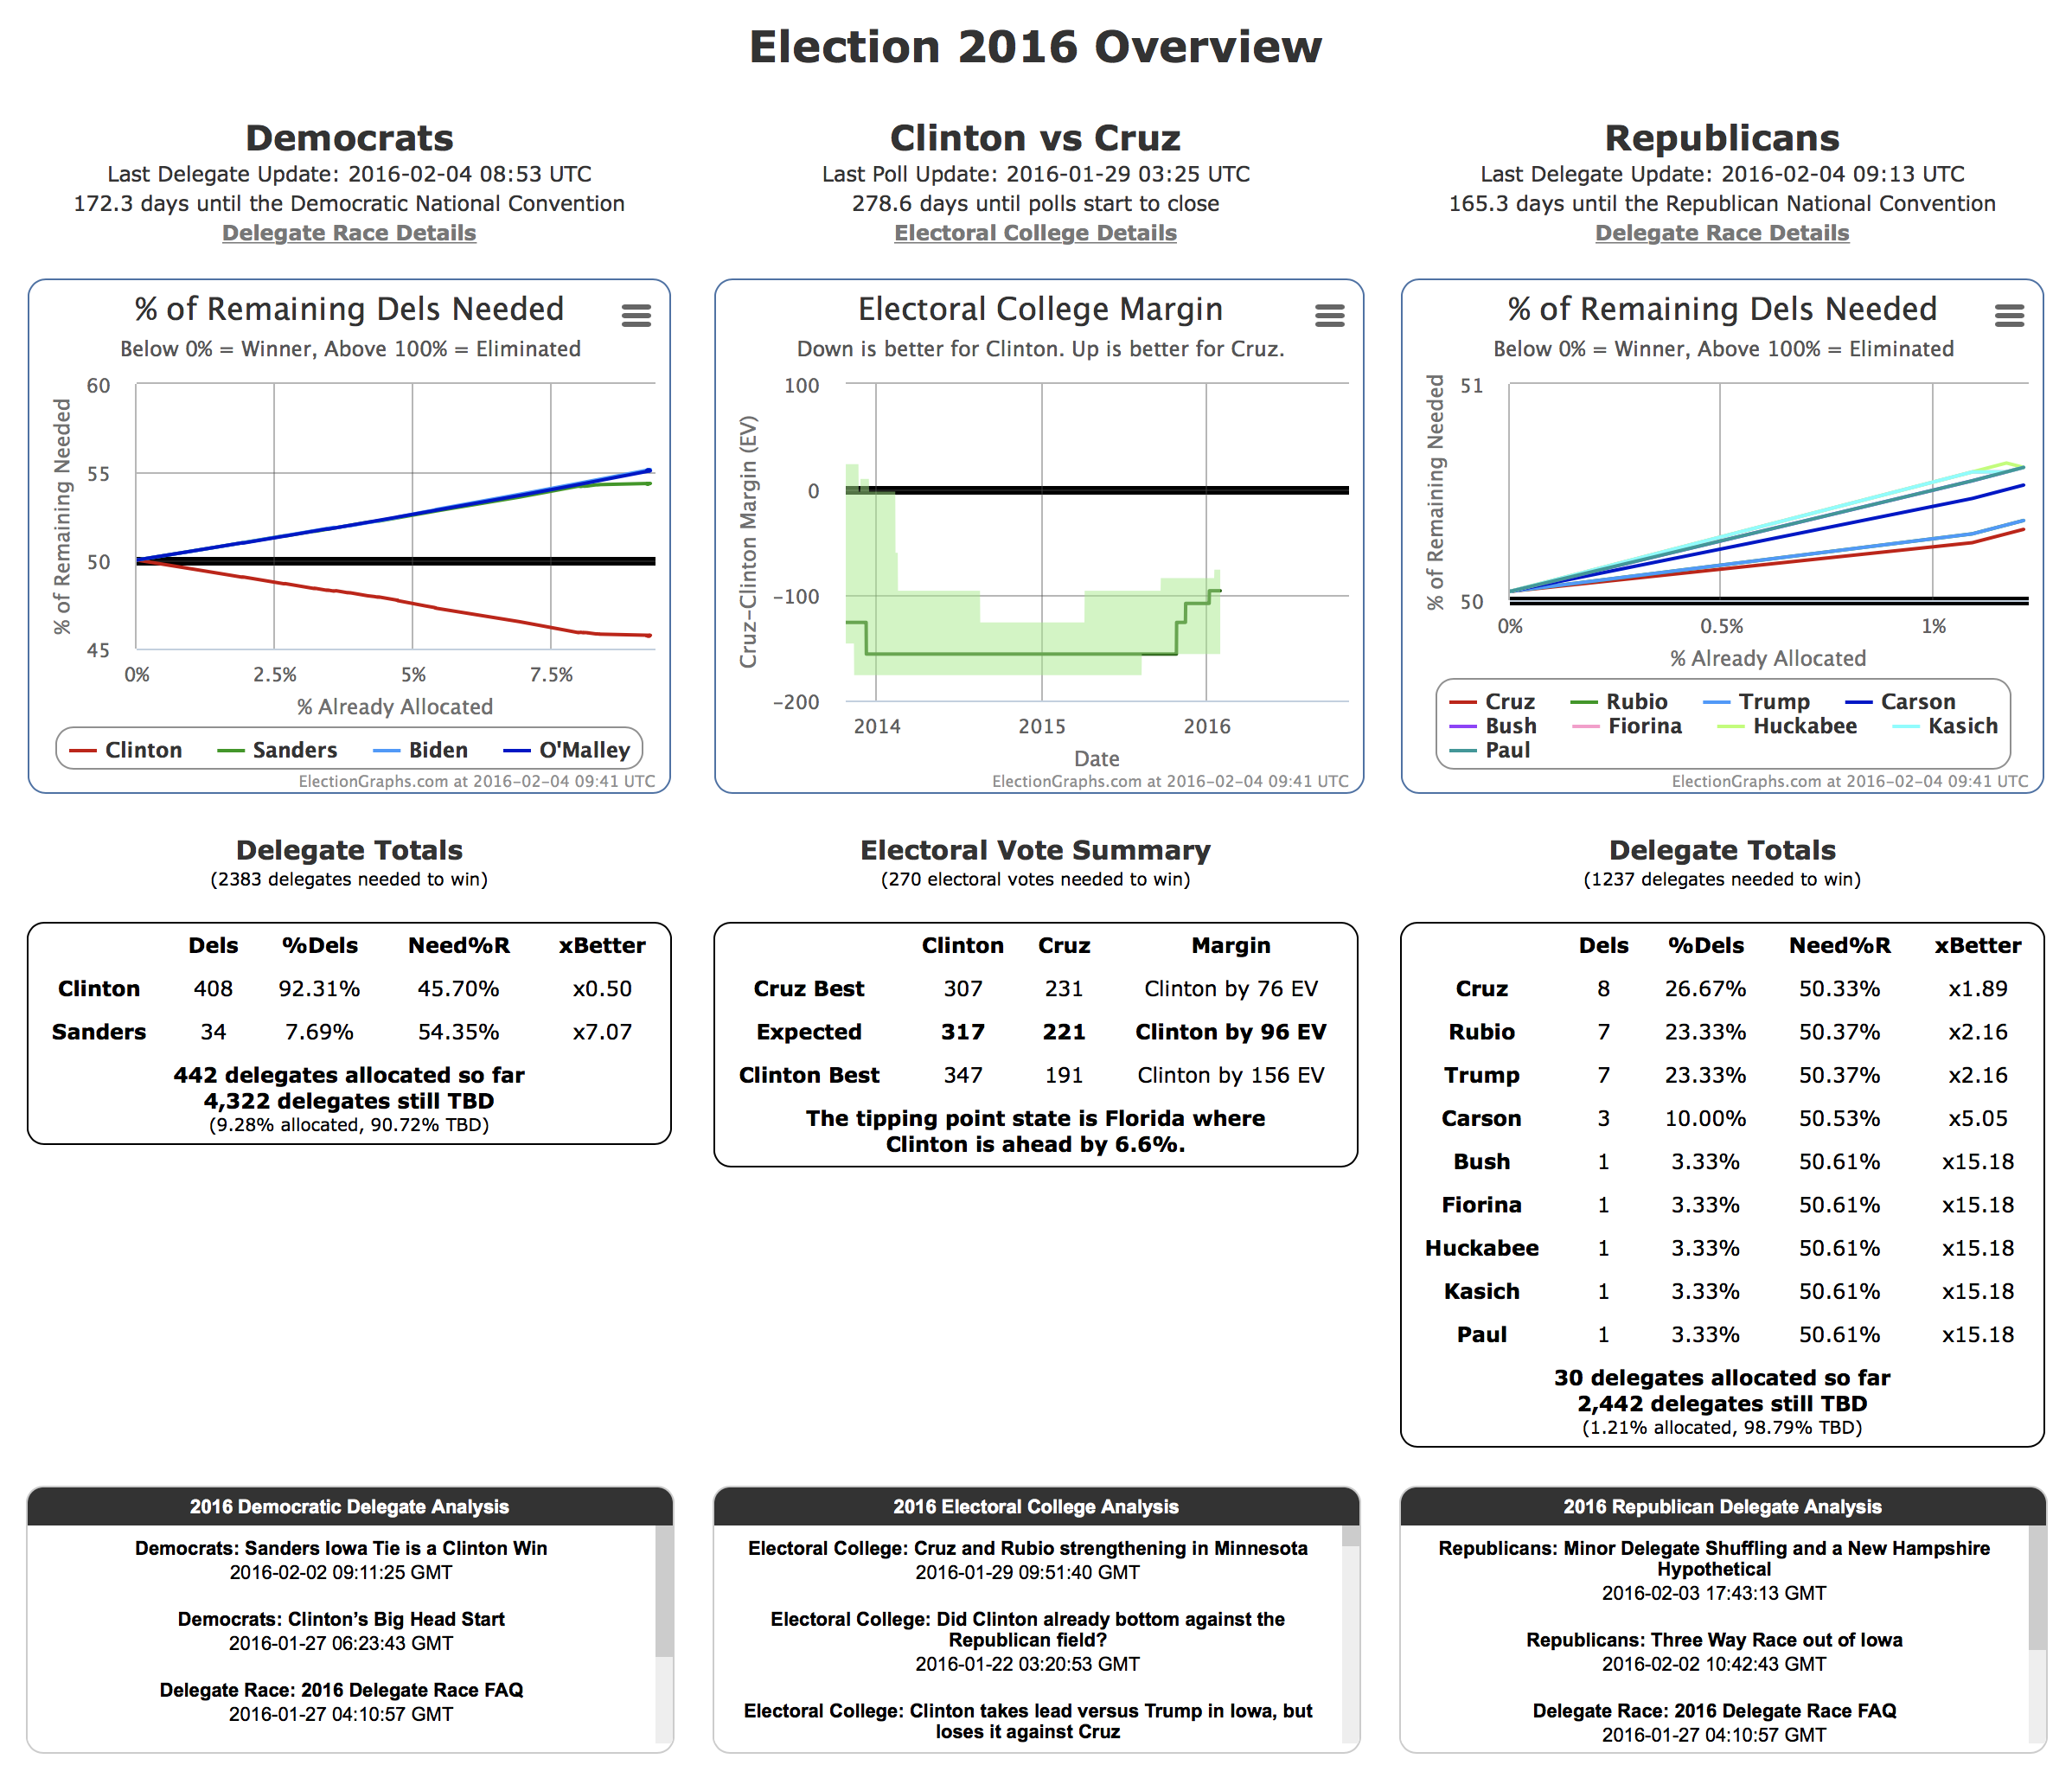
First of all, while not technically part of the Delegate Race coverage pages, I should mention that with the launch of the Delegate Race, the home page of electiongraphs.com has been changed so that rather than just concentrating on the Electoral College race, it gives thumbnail versions of the most important information on both Delegate Races and the Electoral College for the general election. I won’t go over all the specific elements on this page because everything is covered either here or in the Tour of the Electoral College part of the site published back in 2014. From this starting point you can of course easily get to all of the details on both the Electoral College and Delegate Race sides of the site.
The candidate combination in the center will be the delegate leaders in both parties as soon as both parties actually have delegate leaders. Until then, it shows the best polled candidate combination.
Two Columns
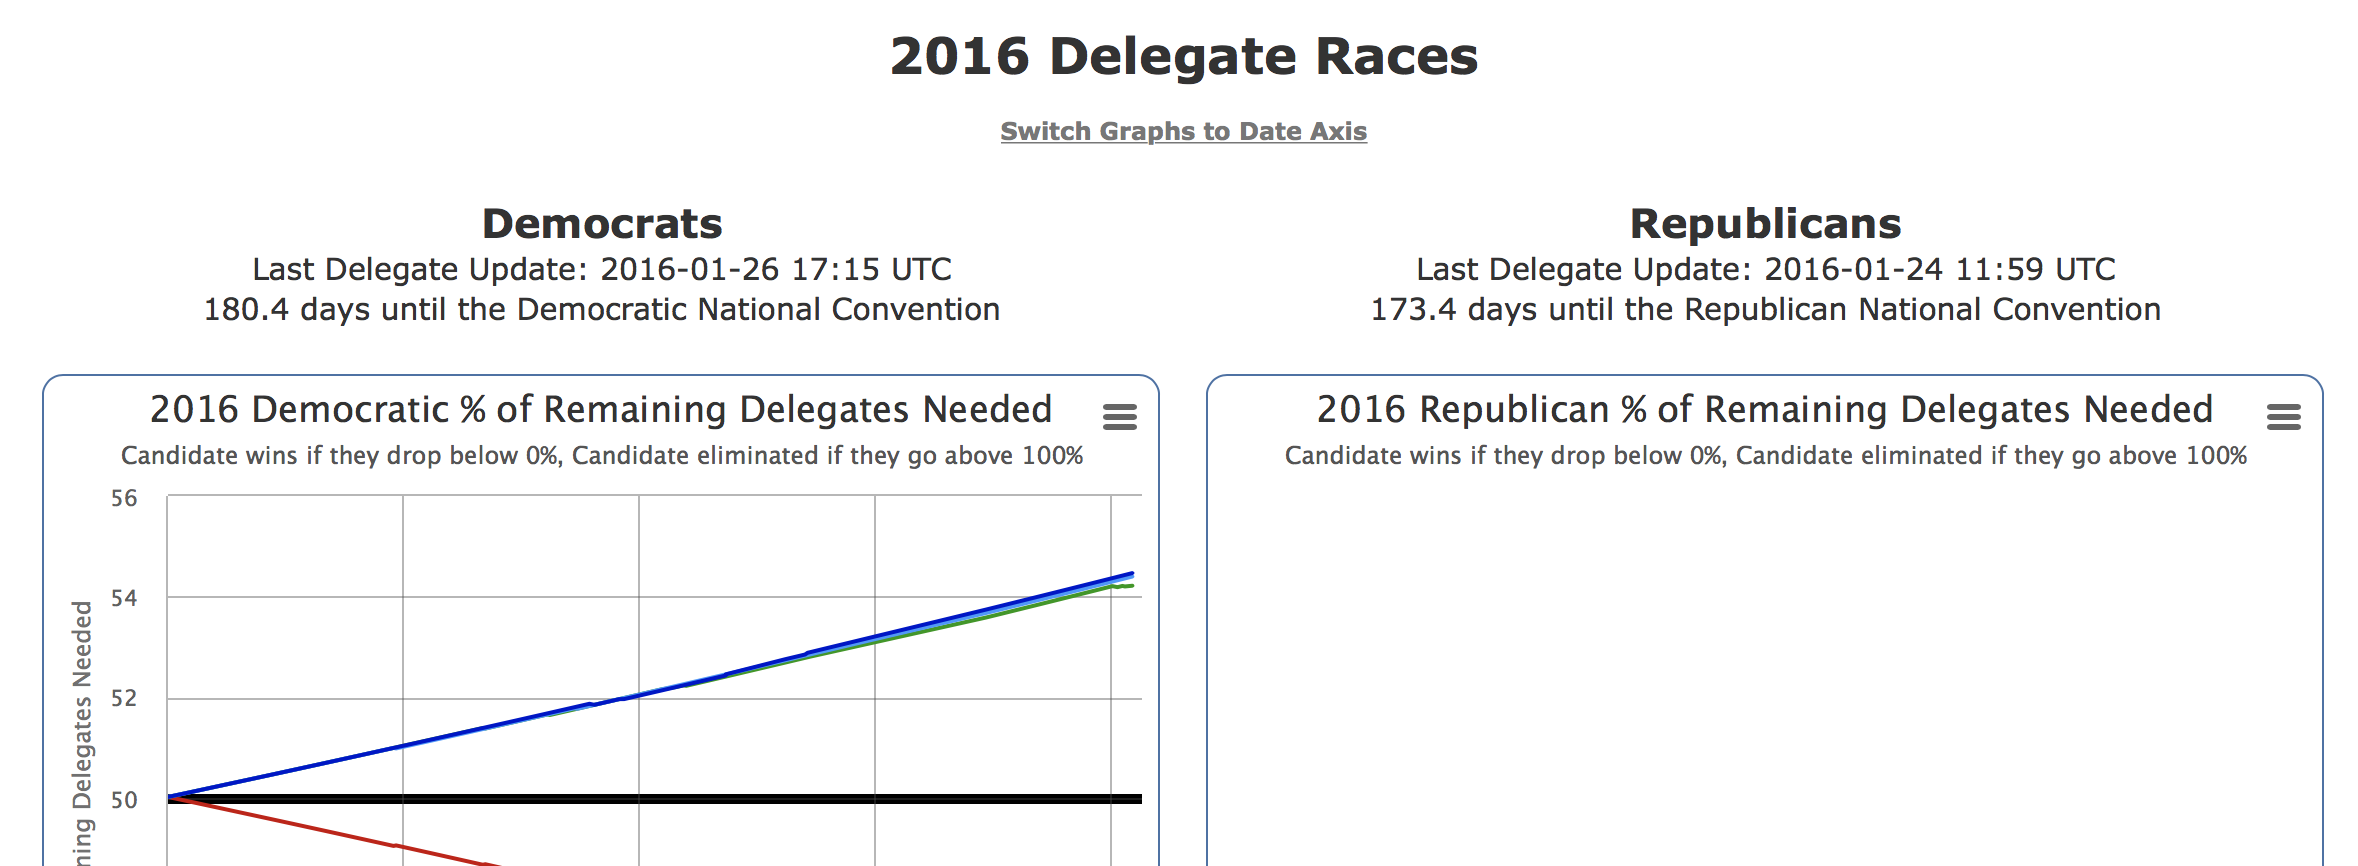
The main structure of the 2016 Delegate Races page is two columns. Democrats on the left, Republicans on the right. (Would you arrange them differently? :-) )
Everything on the page runs in parallel for the two parties, showing the same type of data for each. I will use the Democrats as the examples for the rest of this tour, simply because as of a little over a week before Iowa as this is written, there is actual data for the Democrats because of the super delegates who have already expressed a preference, while there won’t be real delegate data for the Republicans until the Iowa caucus results are known.
Updates and Countdown
The heading should be self-explanatory. :-) A timestamp for the last data update and a count down to the start of the convention.
% of Remaining
This is one of the critical charts I alluded to in the last post.This shows the percentage of the remaining delegates that each candidate needs to get in order to win the nomination on the first ballot at the convention. On this kind of chart, going DOWN is good. It means you are so far ahead that you only need a small percentage of the delegates that are left to win.
Once this number goes to 0%, it means you don’t need any more delegates, you have already won.
The flip side of this is that if it goes to 100%, you have been eliminated. You could get every outstanding delegate and it still wouldn’t be enough.
And specifically during the contest, at any given time, this number is the level you need to get on each new delegate contest as it comes up to be “on pace” to win. So, for example, with the state of the chart above, you can see that Sanders would need to get a little over 54% of the delegates in the next context (the Iowa caucuses) to be on track to win the nomination. If he got 52% of the delegates, he might well have “won Iowa”, but not by enough. He would actually be in a worse position going into New Hampshire in terms of the delegate race, needing an even higher percentage to be on pace the next time around.
Now, that is of course in terms of the pure delegate race. Given the psychology involved, if getting 52% in Iowa was perceived as such a huge win that it boosts his likely delegate haul in New Hampshire from 53% to 60% or some such, then even though the Iowa result put him in a worse position short term, it might boost long term prospects. This is the kind of calculus that occurs during the race, but boosts like that only go so far, in the end watch the math and where this chart goes.
Note a situation where ALL candidates go up to 100% rather than one of them heading down to 0%, is exactly the situation that would lead to a so-called “contested convention” where there is no clear winner going into the convention.
Delegate Totals
The raw estimate of the number of delegates supporting the candidate. This is a “soft count” meaning it includes not just delegates who are formally bound to a candidate, but also unbound delegates who have expressed a preference, and in cases of multi-stage processes, estimates of the final numbers based on the results of the earlier stage. As estimates, these numbers can change, going both up and down as the estimates are refined. Delegate numbers can of course also go down when a candidate drops out and releases their delegates.
% of Delegates
This is the percentage of the delegates allocated so far that have supported each candidate. This shows how well the candidate is doing so far. It may or may not be directly reflective of how well they will do in the rest of the race. That can be influenced by many factors, but it is reasonable to think that for there to be a dramatic change in performance, there would have to be dramatic events or dramatic differences in the landscape causing the change.
Now, as an example, the change from the pre-Iowa world where all the delegates are Democratic insiders to post-Iowa where delegates are actually determined by real people voting is an example of a pretty dramatic change. So for instance, a change from Clinton getting 95%+ of the delegates to something lower would not only not be unexpected, but it would be surprising if such a shift did not happen.
This is a second way of looking at how much work a candidate needs to do to win. The percentage of the remaining delegates tells you a lot, but this divides that by how well they have been doing so far, to give a representation of just how much better a candidate has to do in order to catch up and win if they are behind, or how much leeway to do worse a candidate who is on a winning pace has. So, for instance, if so far a candidate has been getting 30% of delegates, but they need 60% of delegates in order to win, then they would need to do 2x better than they have been to win.
This chart it shown with an logarithmic scale due to the large range of values seen.
Summary Table
The site is Election Graphs, and the most important graph is the % remaining graph, so that came first, and I even talked about all the charts lower on the page before mentioning this, but this is the table with all the detailed numbers behind the data, plus some basic numbers around how many delegates have been allocated, how many are left, how many are needed to win, etc.
This covers only a snapshot of the numbers at the current time. Historical data is only available in the charts. (Or in the raw data I provide if someone wants to parse it to recreate the time series data.)
State Delegate Counts
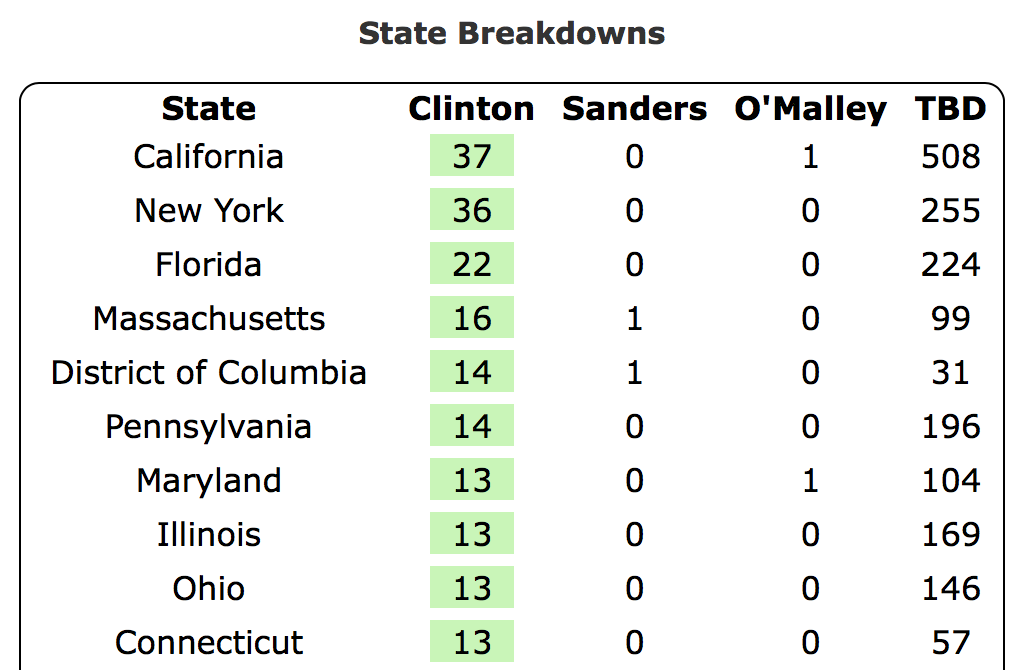
At the bottom of the page is a state by state breakdown of the delegate estimates. The states are listed in order of how many delegates have been allocated so far. The candidate(s) currently leading in each state are highlighted in green. Because of the ways in which delegate allocation works, including the presence of unbound delegates, the delegate leader does not necessarily have to match the winner in the voting reported in primaries and caucuses. And indeed, as seen above, there can be many delegates allocated before any voting takes place at all.
Graphs with a Date Axis
Looking at the delegate race based on % of delegates allocated does give a better real sense of how far along in the process it really is, but sometimes you just want to see things as they look on a more familiar date axis. At the very top of the page there is a “Switch Graphs to Date Axis” link that shifts all the graphs to be date based instead of percent of delegates based.
Once in that mode, you can of course toggle back to the % of delegates view, but you can also toggle between starting the charts whenever the first delegates were logged (so in the case of the Democrats in the 2016 cycle, way back in June 2013) or starting the charts only on the date of the Iowa caucuses (Feb 1st 2016).
Links to Blog Posts
Oh yeah, and in the middle somewhere there, there are three blocks with links to relevant blog posts. The left and right blocks contain only blog posts with analysis of the delegate race for the parties in that column. The middle block also includes articles on the Electoral College race, episodes of the Curmudgeon’s Corner podcast that talk about the election, and digests of posts made by the @ElectionGraphs and @ElecCollPolls twitter accounts.
Notes
Finally, at the very bottom of the page are places to follow Election Graphs, some notes about sources, links to raw data, etc. If you are into those things, enjoy.
Note: This post is an update based on the data on ElectionGraphs.com. Election graphs tracks both a poll based estimate of the Electoral College and a numbers based look at the Delegate Races. All of the charts and graphs seen in this post are from that site. Additional graphs, charts and raw data can be found there. All charts above are clickable to go to the current version of the detail page the chart is from, which may contain more up to date information than the snapshots on this page, which were current as of the time of this post. Follow @ElectionGraphs on Twitter or like Election Graphs on Facebook to see announcements of updates or to join the conversation. For those interested in individual general election poll updates, follow @ElecCollPolls on Twitter for all the polls as they are added.
[Edit 2016-01-27 03:19 UTC to add final note]
[Edit 2016-01-27 06:59 UTC to update screenshots to retina resolution]
[Edit 2016-01-27 08:06 UTC to update graphs]
[Edit 2016-02-02 11:30 UTC to update section on blog post links to reflect split of Democratic and Republican blocks]
[Edit 2016-02-04 09:45 UTC to update screenshots for overview page and RSS feeds to reflect current structure]
|
|