States with new poll data added since the last update: All 50 states and DC. Multiple times each. Notable changes in Florida, North Carolina, Ohio, Iowa, Pennsylvania, Kansas, Colorado, Wisconsin, Maine (All), and Georgia.
There have been tons of polls, including “50 state” polls from three different sources, one of which had weekly data going back four weeks that needed to be added. There were many shifts caused by this batch of polls. We’ll look at all the charts, but lets start with the headline:
The Romney Barrier
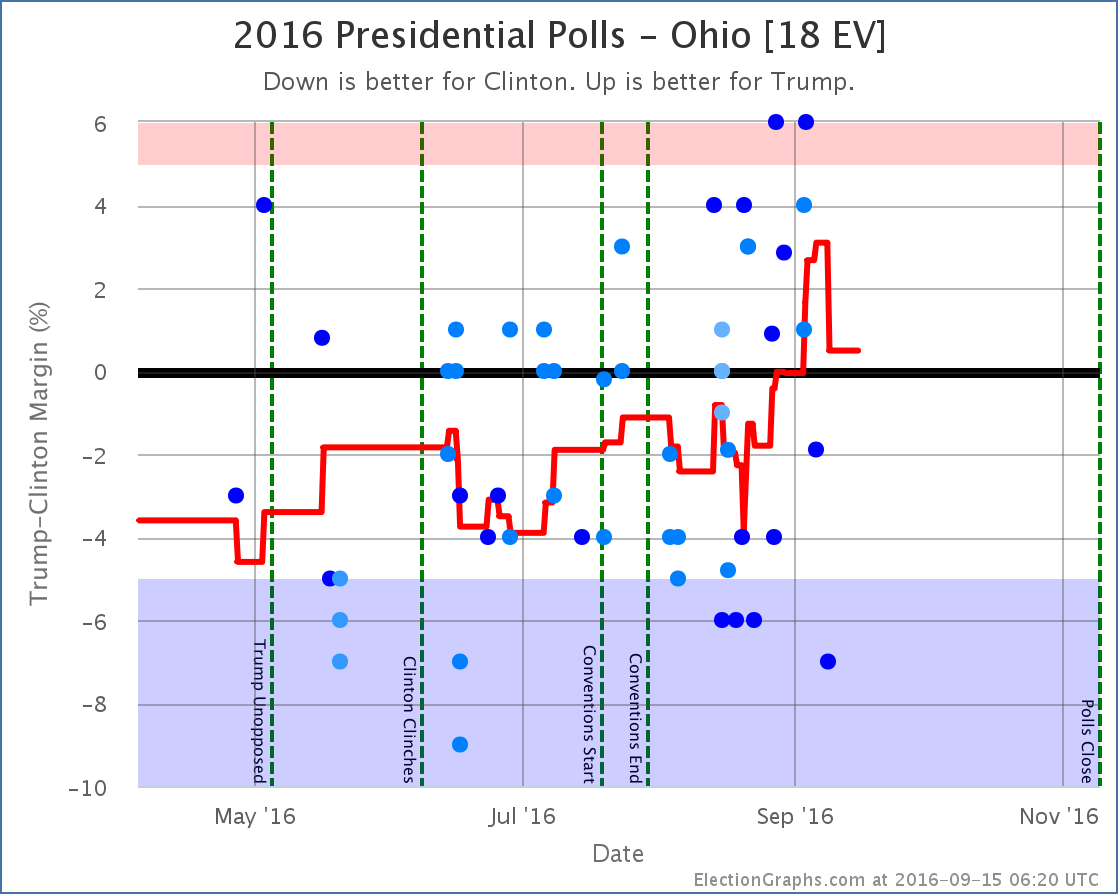
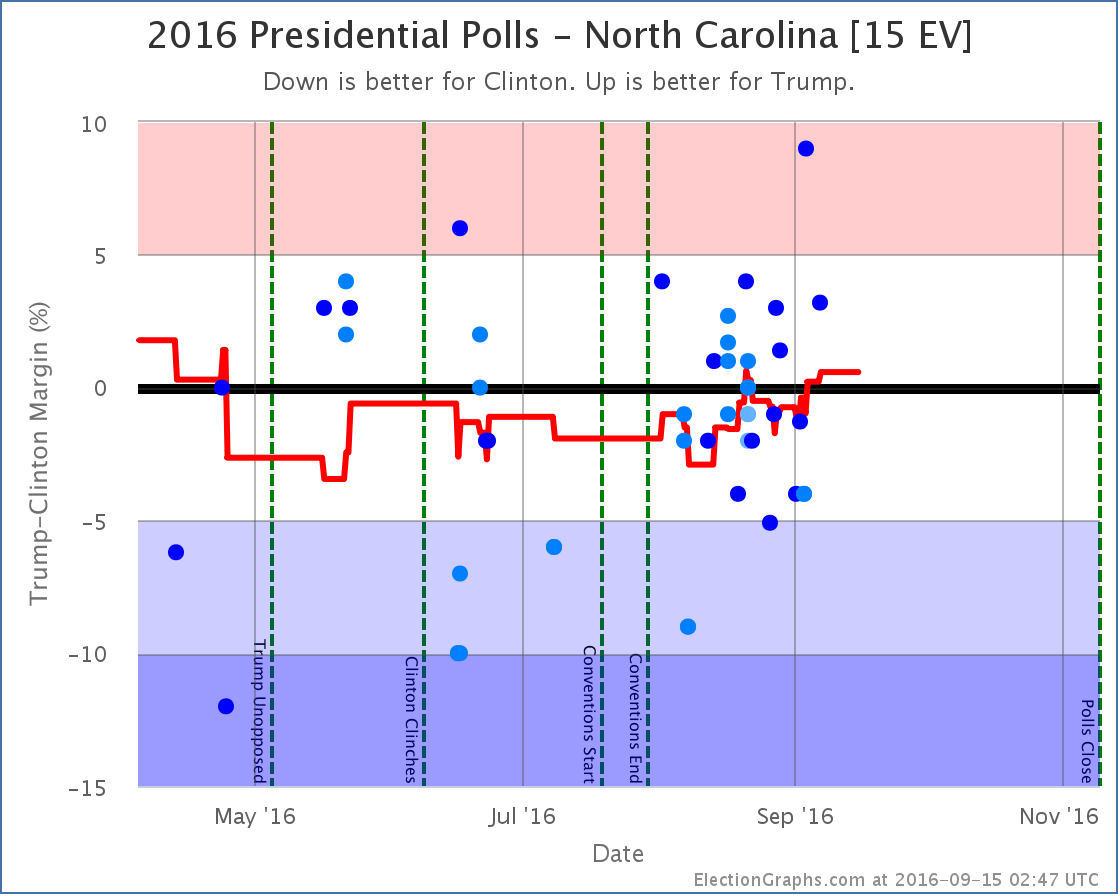
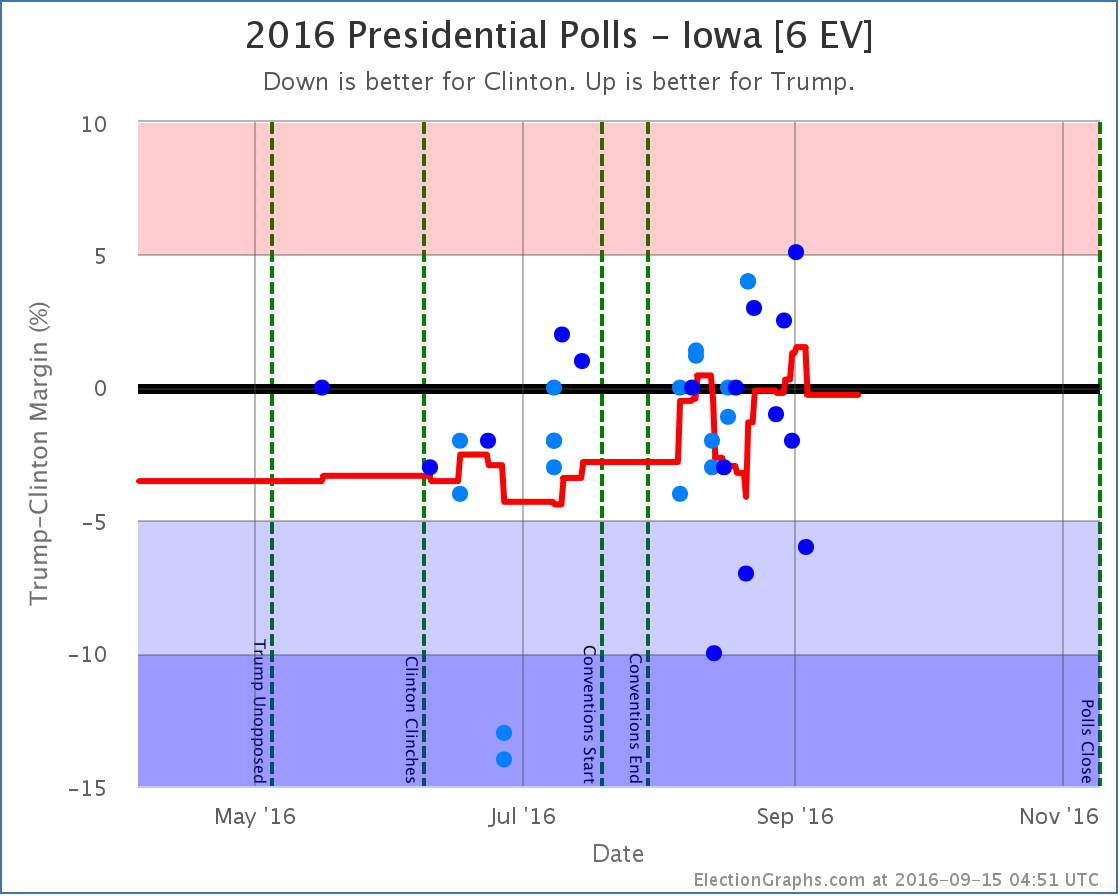
The averages in Florida, Ohio, and North Carolina all moved from Clinton to Trump. Iowa did move in the opposite direction, but it is much smaller, so the net change was dramatically toward Trump.
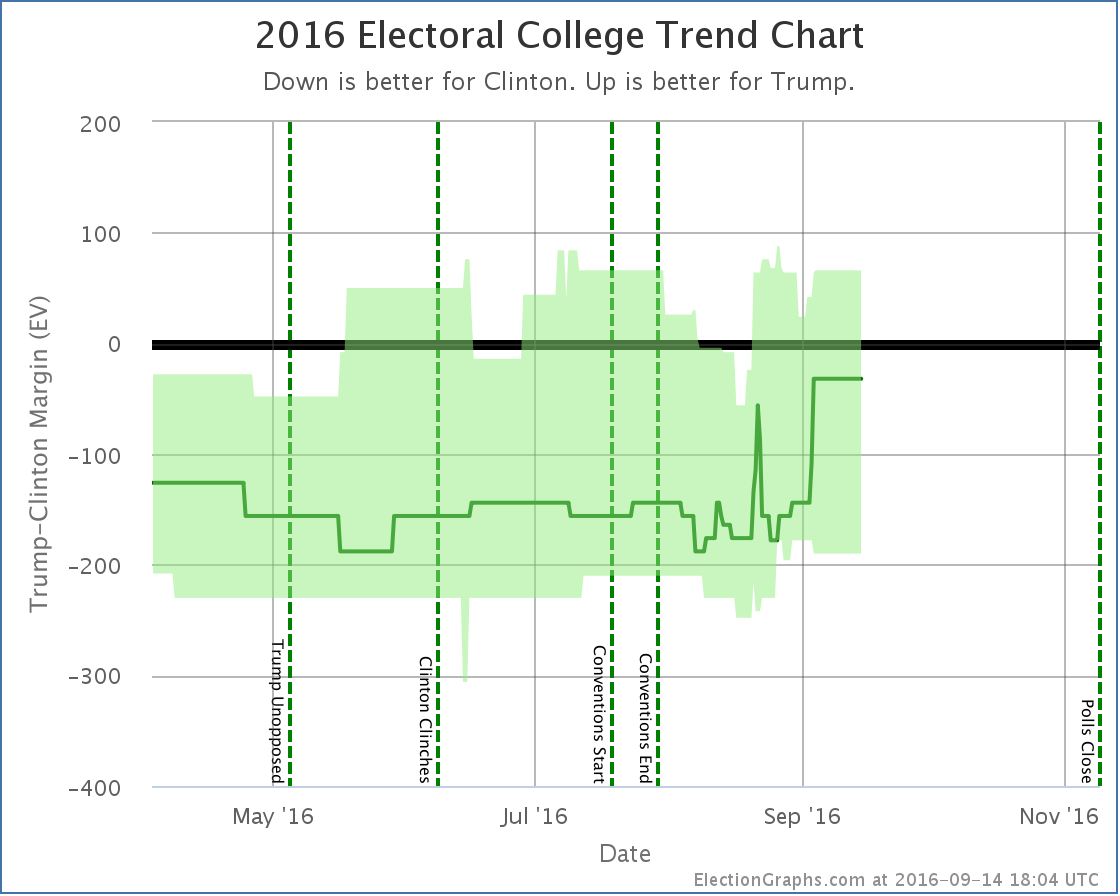
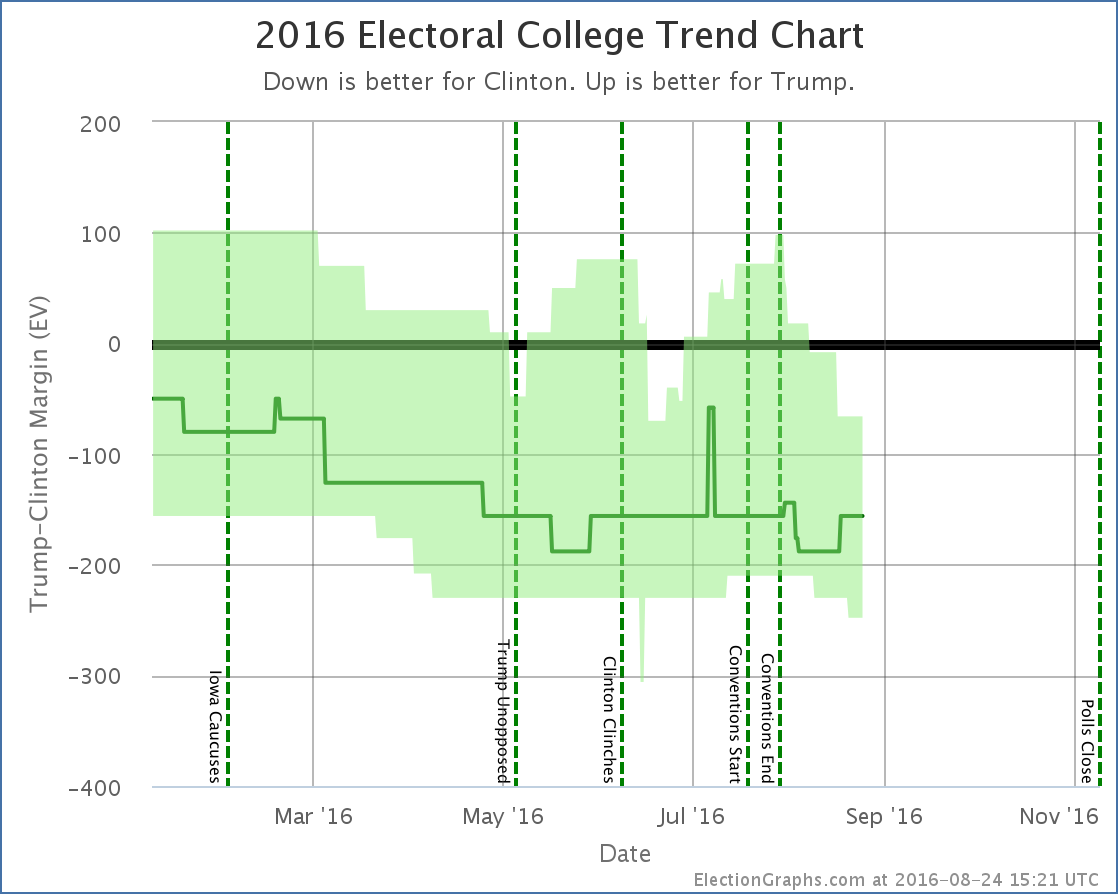
Before this batch of changes, the “expected” result if everybody won the states they lead was Clinton 341 to Trump 197… a 144 electoral vote win for Clinton.
With this batch of polls, the expected result is now Clinton 285 to Trump 253. This is still a Clinton win, but now by only 32 electoral votes.
From February onward this race had been stuck in the zone with Trump losing by margins between McCain’s loss (192 electoral votes) and Romney’s loss (126 electoral votes).
For the first time since February, Trump is now looking like he would do better than Romney did. Trump now matches Romney’s map, but adds Florida and Ohio. It isn’t quite enough to win, but Trump is now closer than he has ever been… and doing better than the last two Republican candidates.
Some folks were looking at Clinton’s lead in mid-August and were trumpeting the possibility of a Clinton landslide in early August. It was just looking like a solid win for Clinton back then, not a landslide, but things have actually moved in the opposite direction. A 32 electoral college win is more like a squeaker. It would only take Michigan flipping to get us to a 269 to 269 electoral college tie.
(There were also changes in the “best cases” from a lot of states moving in both directions. Trump’s best case went from winning by 68 electoral votes to winning by 66 electoral votes. Clinton’s best case went from winning by 210 electoral votes to winning by 190. So the overall range of possible outcomes reduced.)
Tipping Point
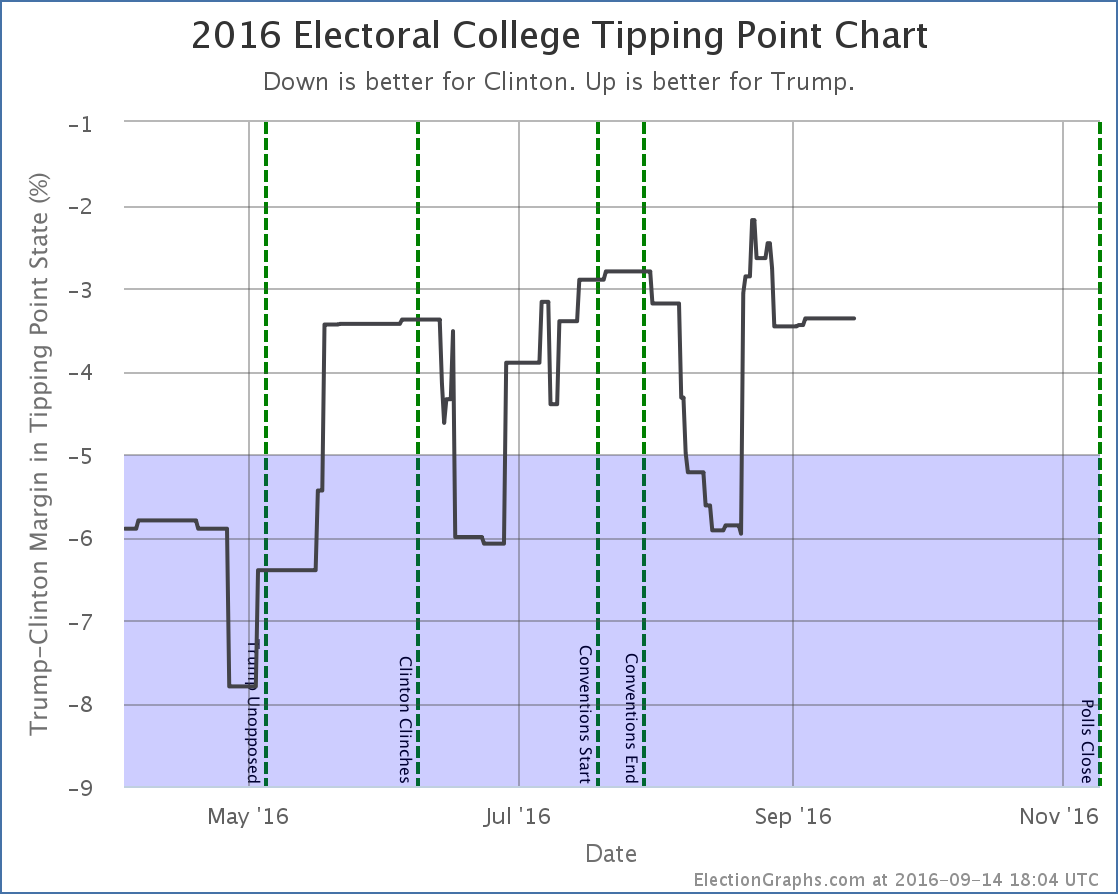
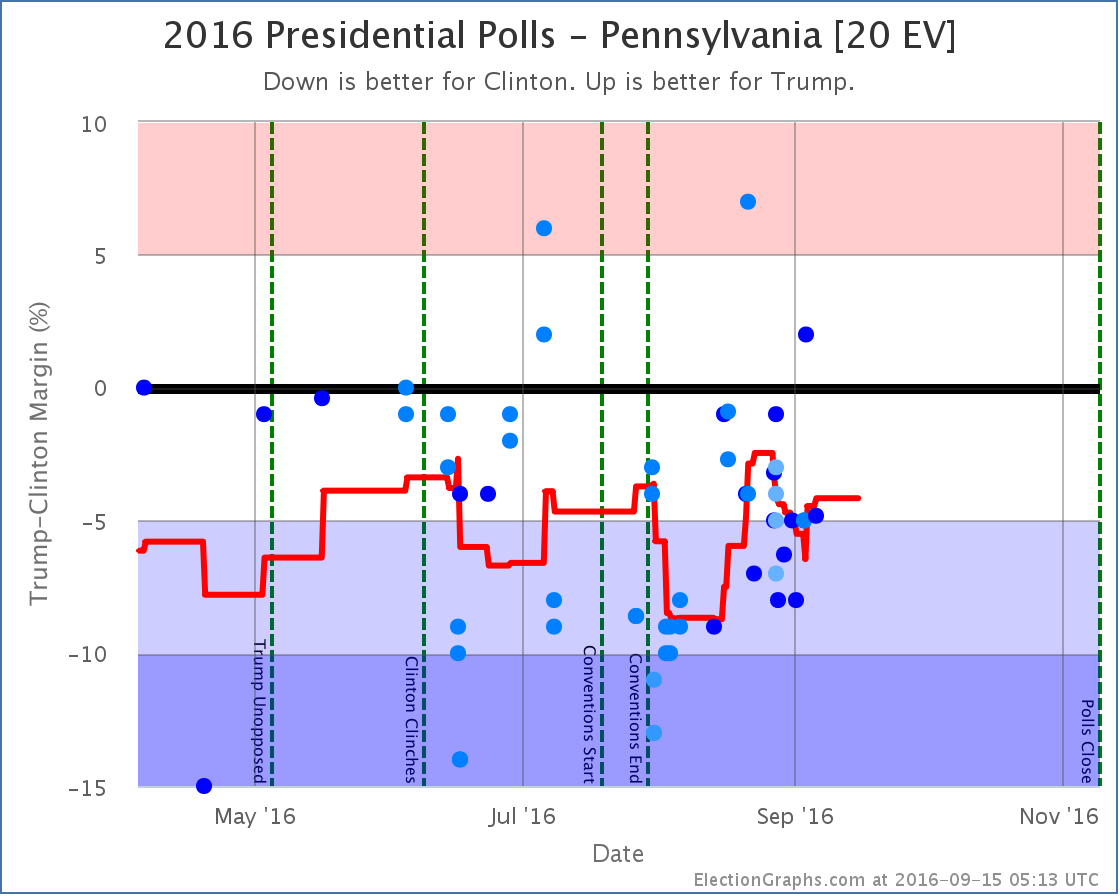
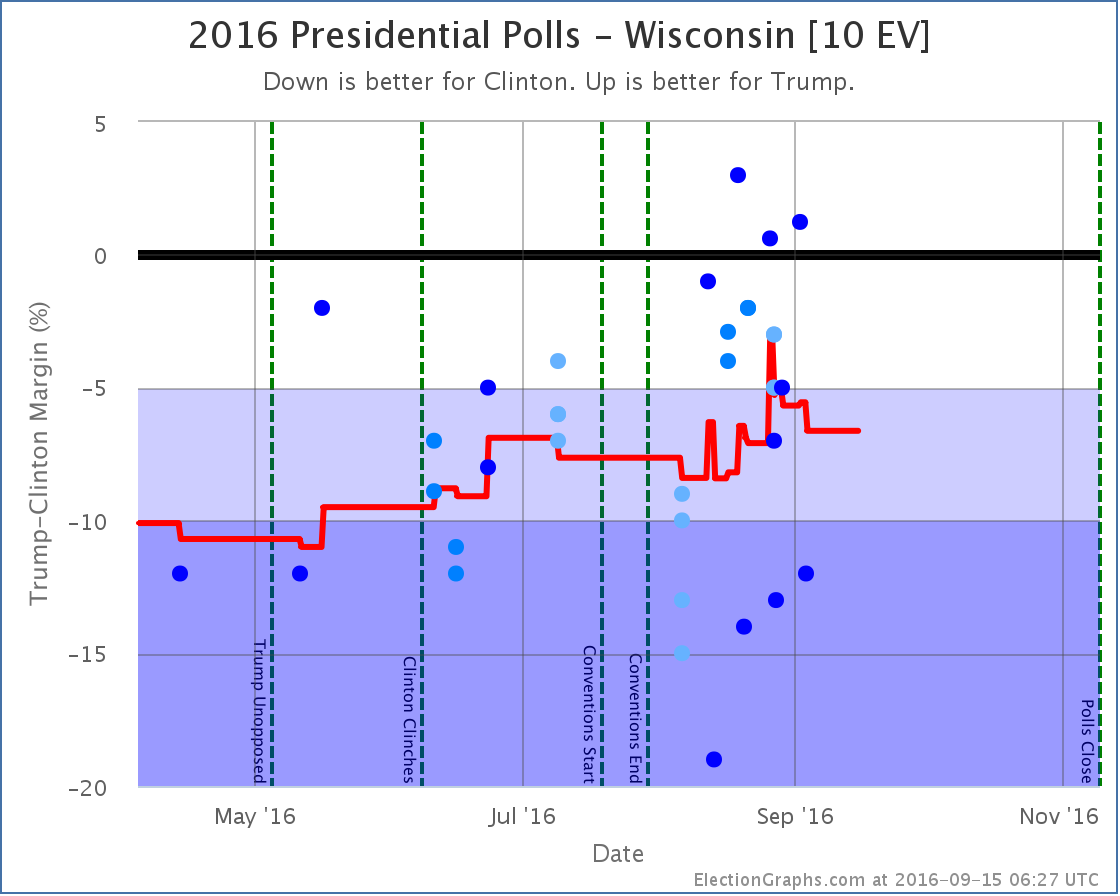
Now, despite the expected case moving in Trump’s direction, changes in Florida, Michigan, Wisconsin and Pennsylvania had the net effect of… zero. Well, to be precise the tipping point changed from a 3.4% Clinton lead in Florida to a 3.4% Clinton lead in Michigan. So the state that holds the balance shifted, but the actual percentage did not.
Looking at the trends though, rather than just the change in this update, while the expected case has clearly been moving in Trumps direction the last few weeks, the tipping point has been trending toward Clinton.
What does this mean?
At a basic level it means that while Trump has made the race closer, pulling over the next few states he needs to win is getting harder.
3.4% is still close, but if Trump is at or near his ceiling, it may be a tough last 3.4% to move.
To be absolutely clear, with all of the above Clinton is still a strong favorite. Trump has made it a lot closer than it was, but he still has a lot of work to do to pull the remaining states he would need past the line to secure an electoral college victory. It isn’t impossible. It is just very hard.
Individual States
OK, with the two national summaries out of the way, time for a run down of all the states that shifted in ways that caused changes to the expected or best cases. I’ll just do a run down of all the graphs without commentary on each one. For the most part they speak for themselves. Keep an eye out for the polls that look like outliers. In some cases if new polls don’t back those up, the changes described here may reverse themselves quickly as new polls come in.
States moving from Clinton to Trump:
States moving from Trump to Clinton:
States now in play for Trump:
States now in play for Clinton:
States no longer in play for Trump:
States no longer in play for Clinton:
What’s Next
This batch of polls was huge, so in the time it took me to complete it, there have already been a bunch of new polls which I will be adding as soon as I can. Even if those polls don’t change anything, there will be polls soon enough that do. This is a dynamic race, and as I post this we have 54.7 days left until we start getting the actual results. Hang on tight, we’re in for a nice ride before we are done.
Note: This post is an update based on the data on ElectionGraphs.com. Election Graphs tracks both a poll based estimate of the Electoral College and a numbers based look at the Delegate Races. All of the charts and graphs seen in this post are from that site. Additional graphs, charts and raw data can be found there. Follow @ElectionGraphs on Twitter or like Election Graphs on Facebook to see announcements of updates or to join the conversation. For those interested in individual general election poll updates, follow @ElecCollPolls on Twitter for all the polls as they are added. If you find the information in these posts interesting or useful, please consider visiting the tip jar.
States with new poll data added since the last update: All 50 states, plus the Maine congressional districts. Notable changes caused by Colorado, Florida, Missouri, New Hampshire, Maine (CD2), and South Carolina.
There were a ton of changes with this batch of new polls. Four of the changes favored Trump, two favored Clinton. We’ll look at each of these in order. The “good for Trump” states first, then the “good for Clinton” states, then we’ll review the net national changes due to all of these together.
Good for Trump
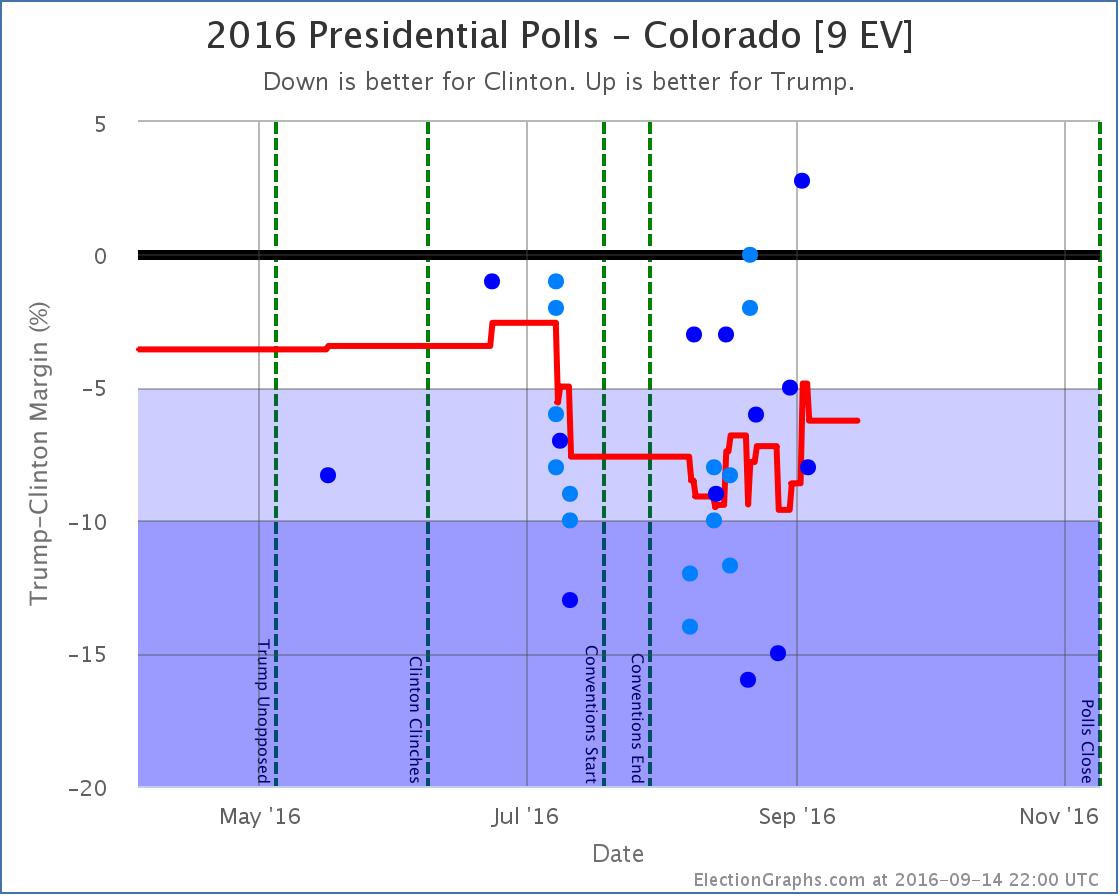
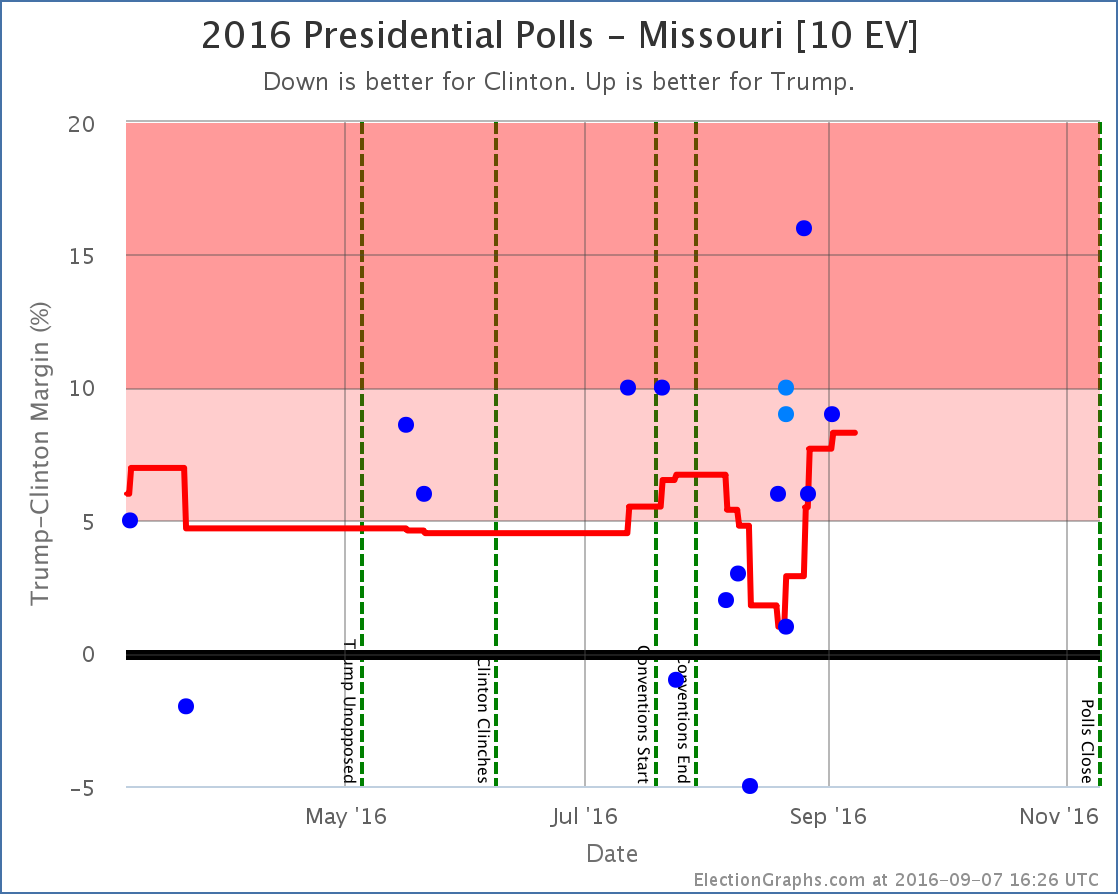
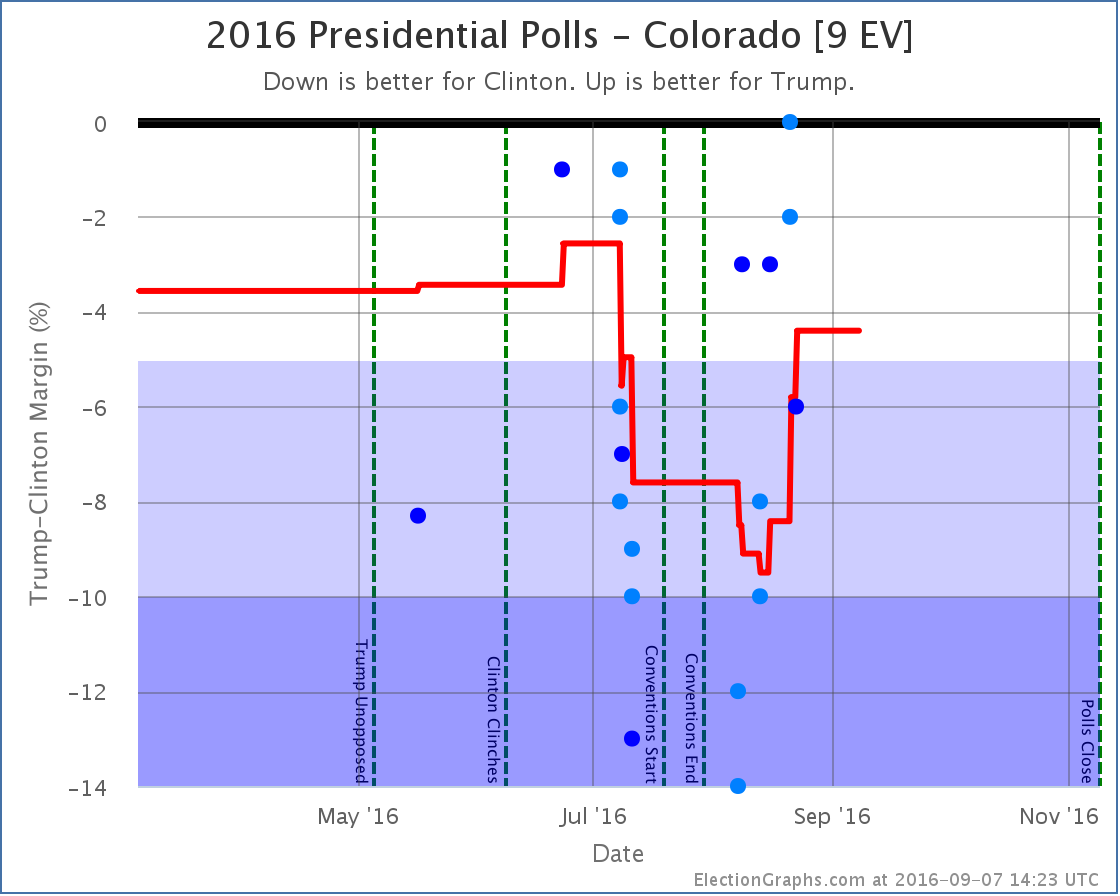
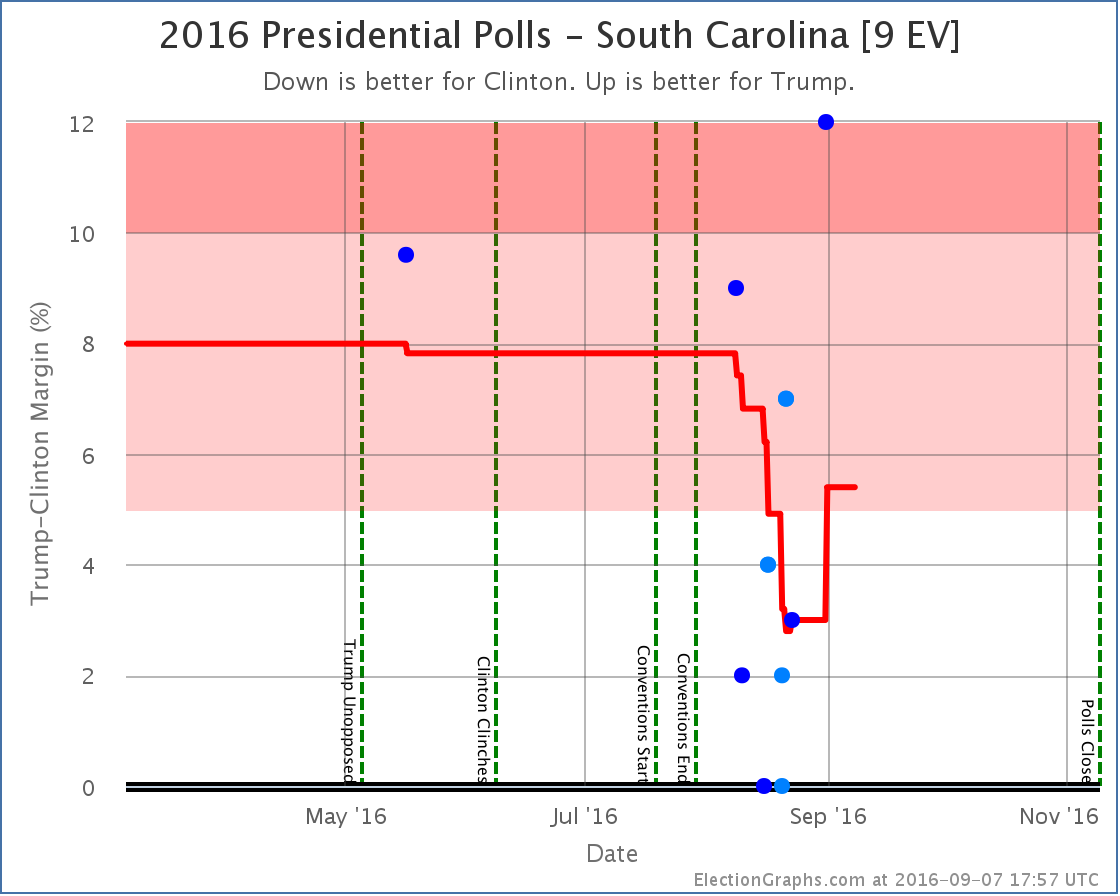
Missouri, Colorado and South Carolina all show the same general pattern… a Trump decline bottoming out in mid-August, followed by a Trump recovery. The specifics of the patterns are slightly different, but the dip followed by a rebound looks clear. (Although the rebound in South Carolina may turn out to be due to an outlier.)
Missouri and South Carolina had looked like states where Clinton was making it close, Trump now pulls them out of reach again. Meanwhile Clinton’s lead in Colorado looked like it was not at risk for her, but the last few polls show Trump making it close again.
So winning Missouri and South Carolina are no longer part of Clinton’s best case, while the possibility of winning Colorado is now included in Trump’s best case.
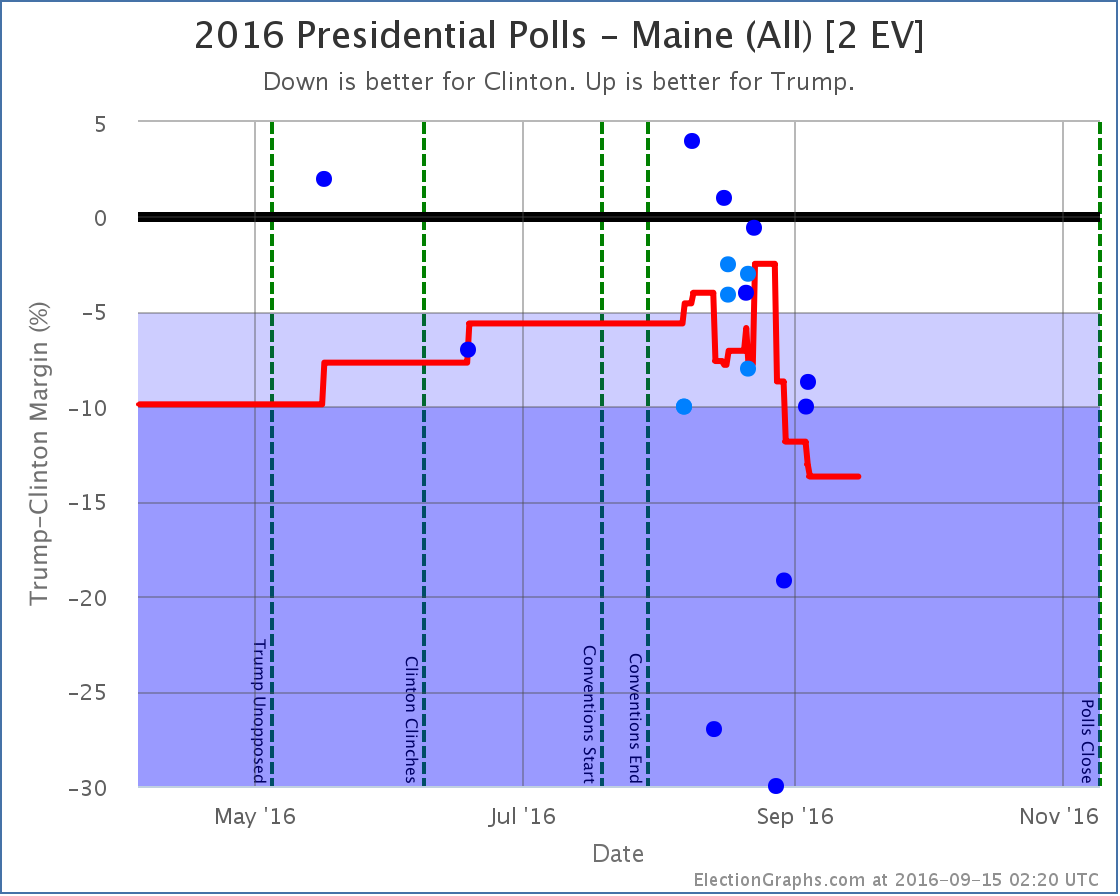
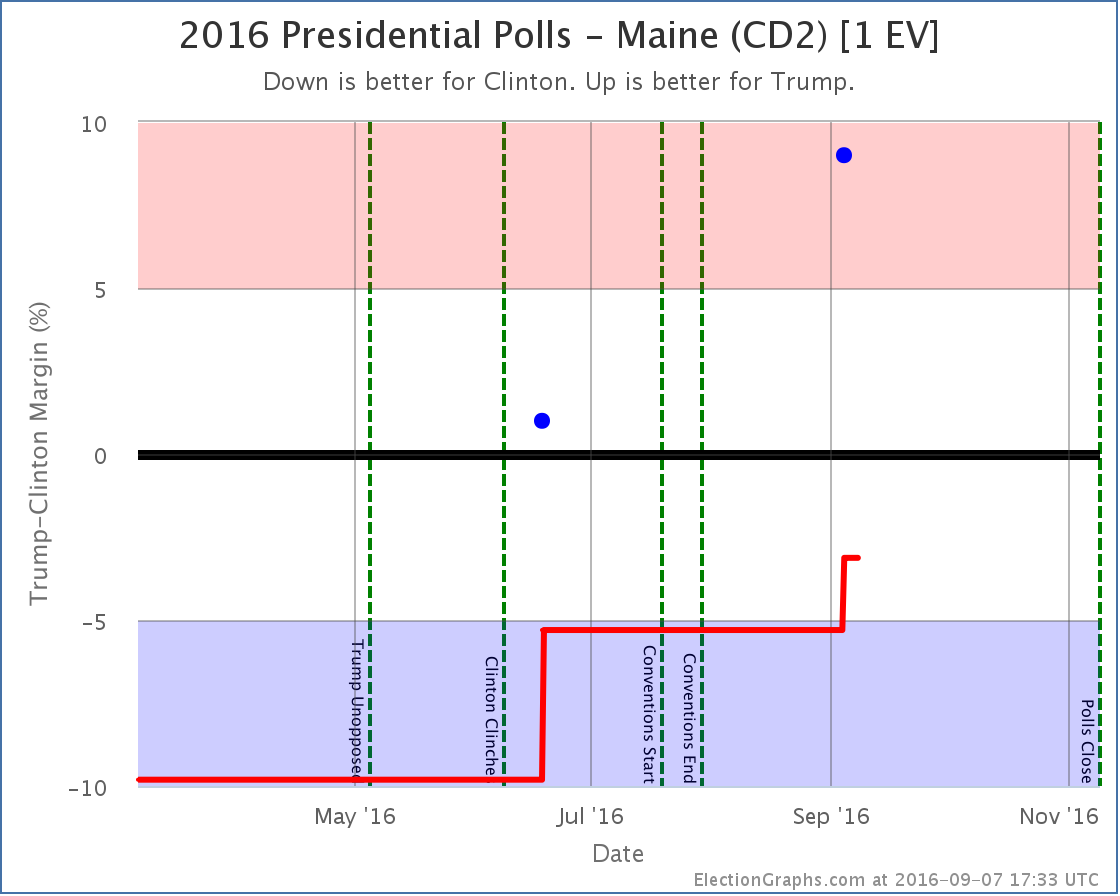
Maine and Nebraska are the only two states that can split their electoral votes. So far Nebraska has not been polled at all at the congressional district level. This week brings only the second time the Maine congressional districts have been. In both cases, the overall numbers for the states have moved toward the center line past all of the congressional districts. Mathematically, the state as a whole can’t be closer than all the parts making up the state, so we know this is wrong, but without congressional district polling, we can’t tell where the congressional districts should be.
In Maine, with the new CD2 polling result, we now have two polls showing Trump ahead. These are the only two polls. The average is filled out with the Maine CD2 results from 2004, 2008, and 2012. Given the strong Democratic wins in CD2 in those years, the two polls from this year aren’t quite enough for the poll average to flip the district to Trump, but the average now only has Clinton up by 3.1%, so we now consider Maine’s 2nd District to be a possible pick up for Trump.
Even with this new poll, Maine-CD2 is what I consider to currently be the “most needed poll” (followed by NE-CD2, NE-CD1, SD, and ME-CD1). Please pollsters! More congressional district level coverage of both Maine and Nebraska! They both look like they have a possibility of splitting this cycle. We need more polling to understand just how likely (or not) that possibility actually is!
Good for Clinton
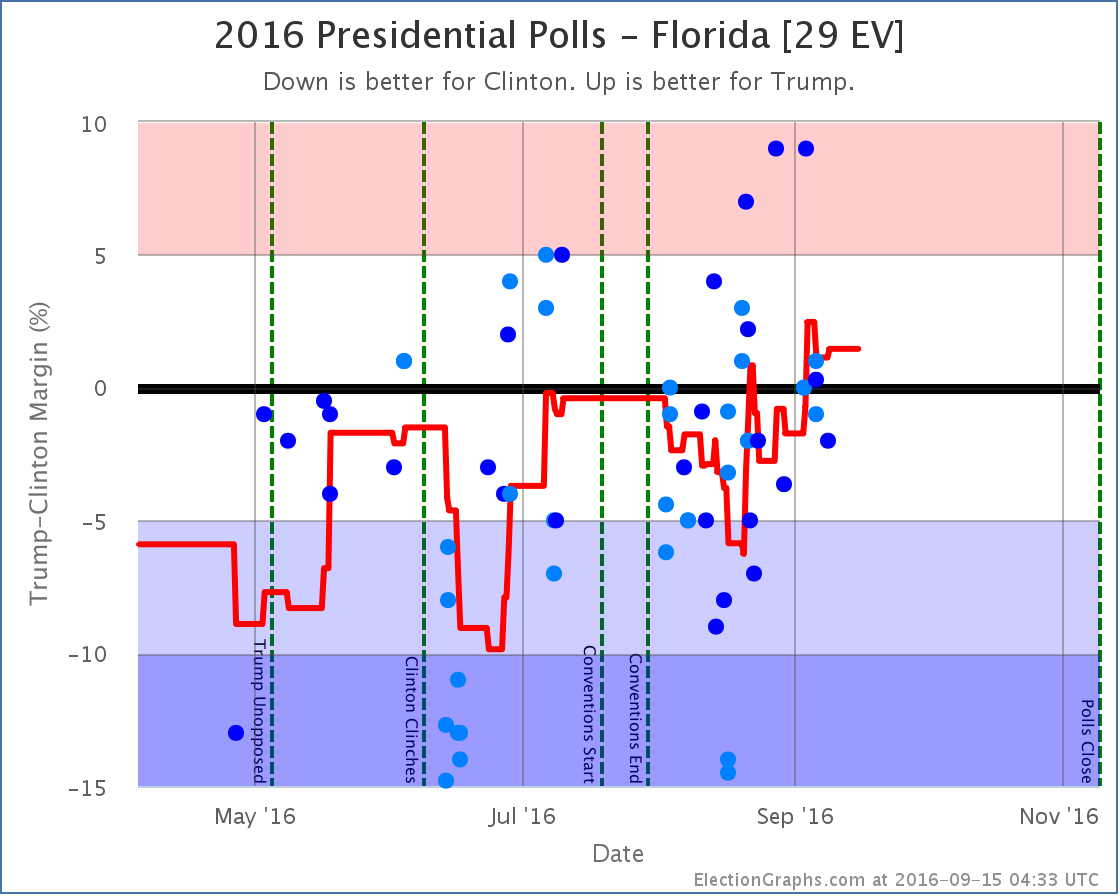
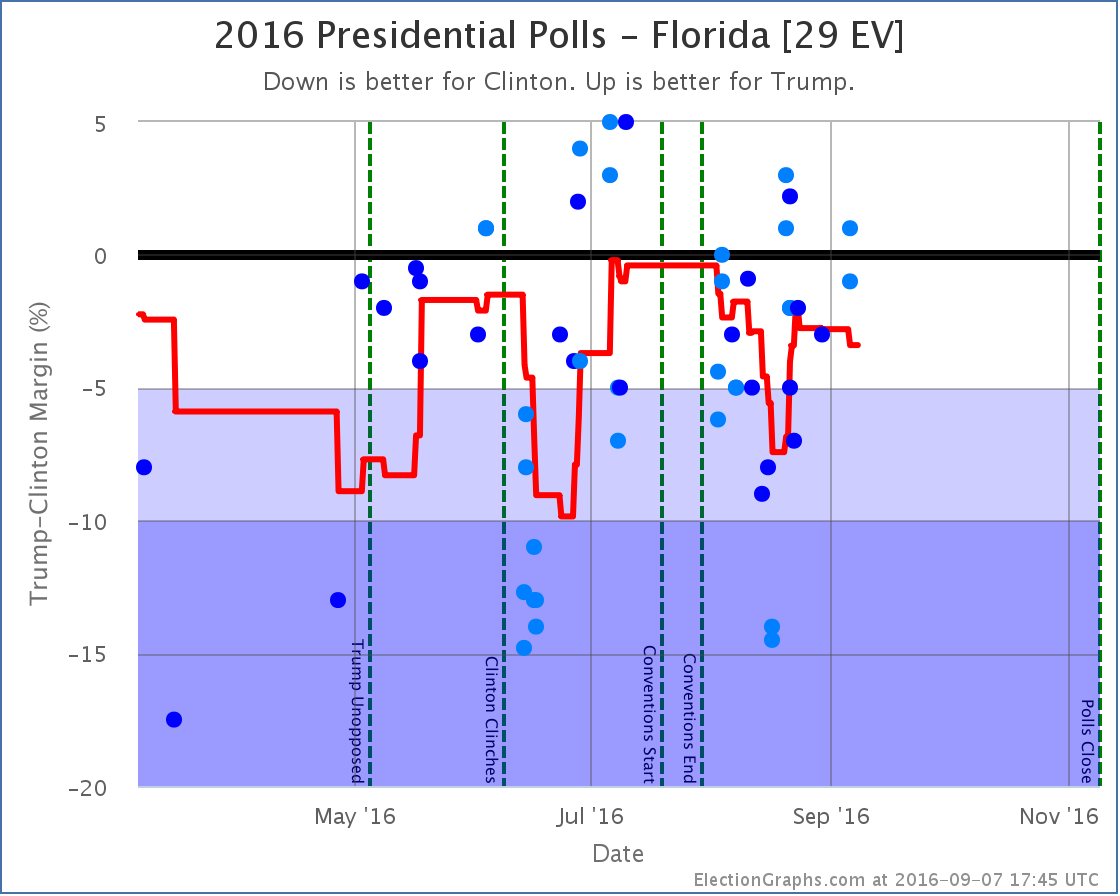
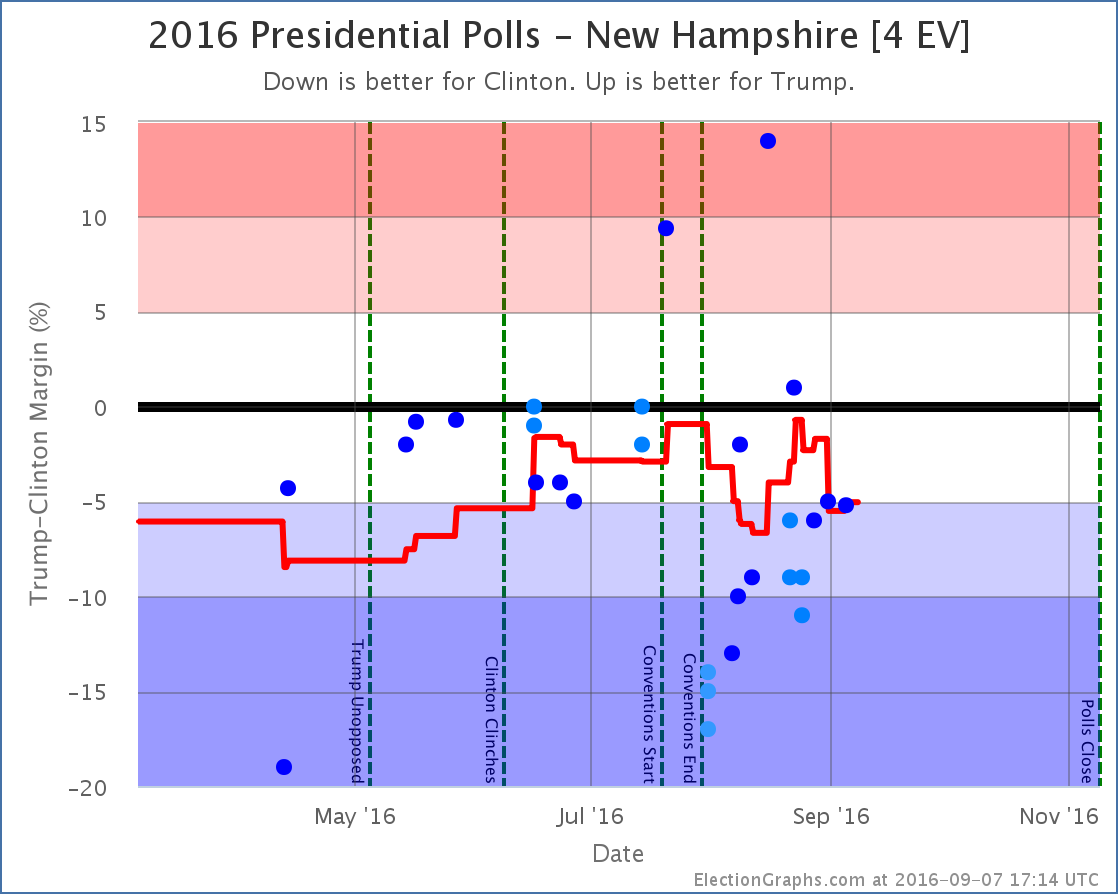
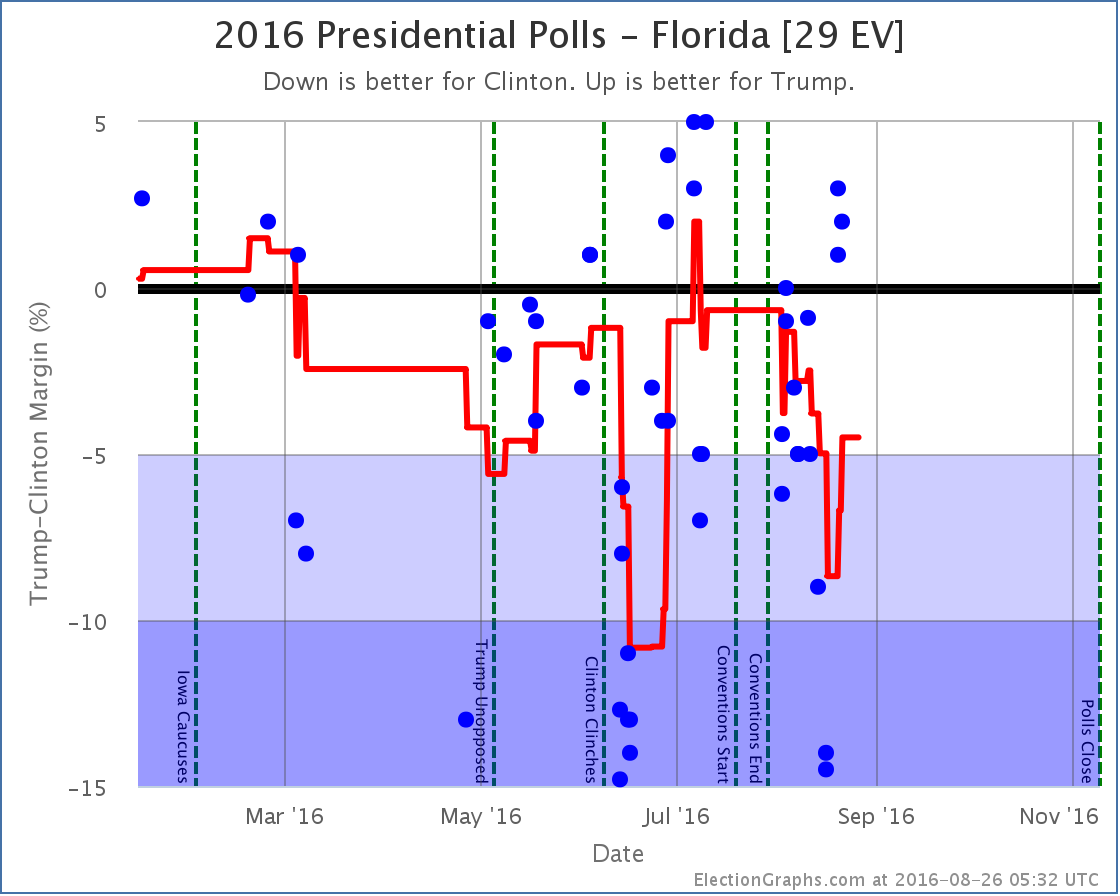
Both Florida and New Hampshire show the typical pattern of the Trump collapse followed by a Trump recovery. But in these two states, Trump peaked and is starting to drop again.
Florida does not change categories, but the change there changes the national tipping point.
In New Hampshire, the average just barely passes our 5% threshold to put the state back in the “Strong Clinton” category, which removes New Hampshire from Trump’s best case. It is right on the line though. Clinton’s lead still rounds to 5.0%. The next poll could easily move this back into “Weak Clinton”.
National View
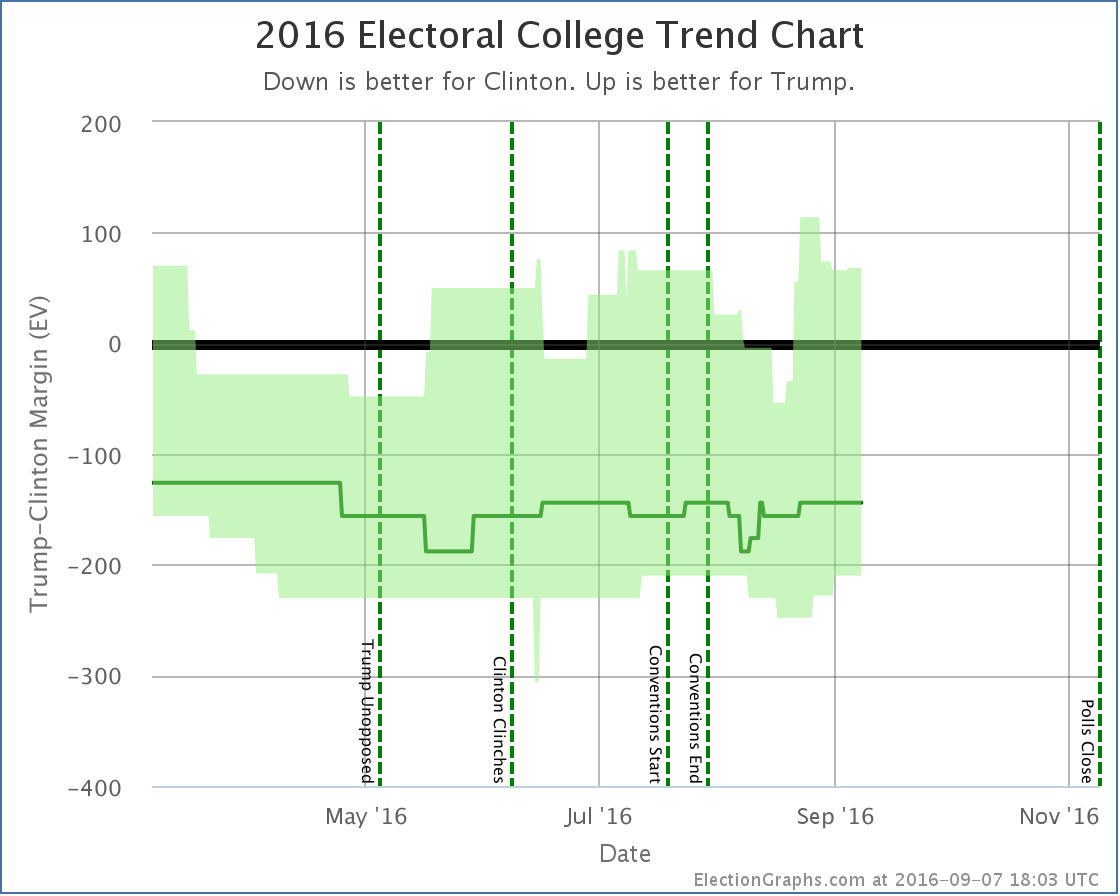
The change from today’s update to Trump’s best case is to move from winning by 56 electoral votes to winning by 66 electoral votes. So net improvement today.
But note the downward trend after August 27th. Even though today’s update was better for Trump, raising the level of the whole graph over the last week or so on the basis of some polls with older midpoints, it does look like his best case may have peaked and is receding a bit now.
Clinton’s best case is receding as well though. It drops in this update from winning by 248 electoral votes to only winning by 210 electoral votes.
And the center line has not shifted. We’re talking about changes in which states are close, not in who is leading where.
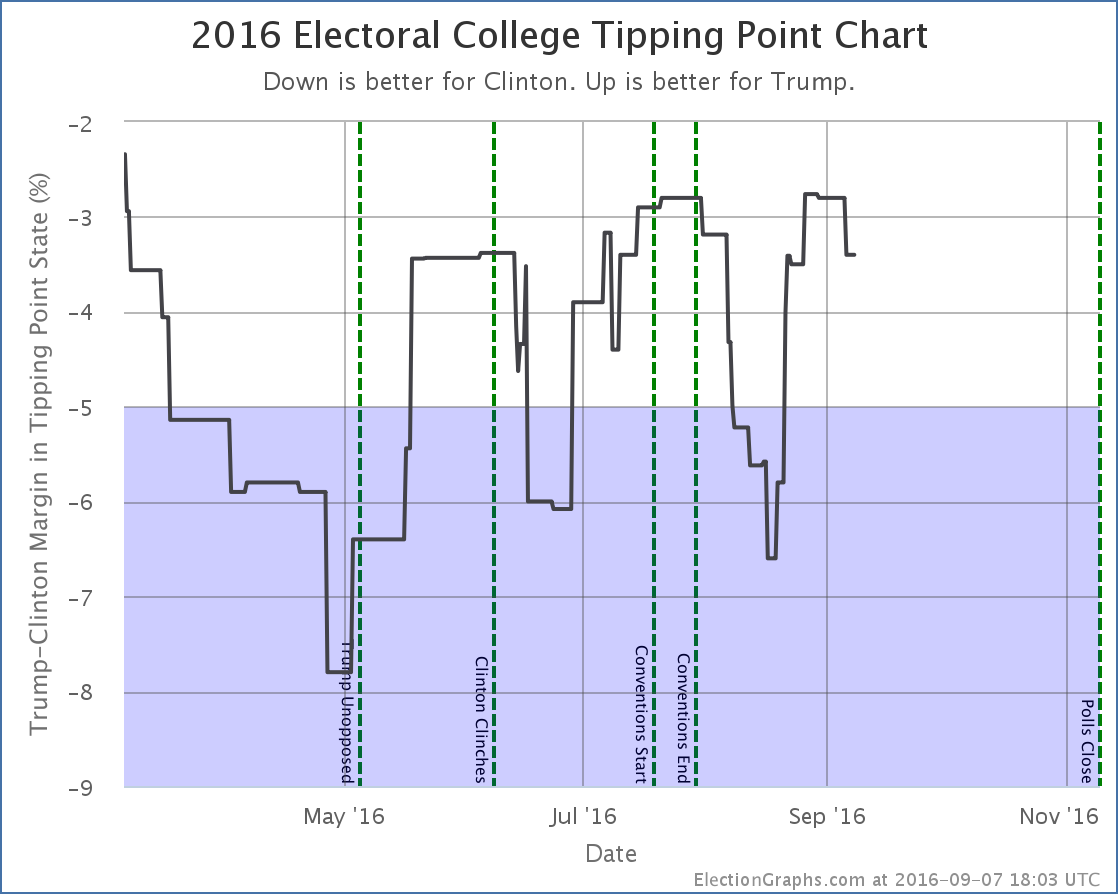
Today’s update moves the tipping point from Clinton by 3.0% in Florida to Clinton by 3.4% in Florida, but you can see that the tipping point peaked a little over a week ago and has been moving toward Clinton, similarly to how Trump’s best case has been moving.
So has Trump really already passed another peak? Is he on a downswing again? Or is this all just reversion to the mean on a race that really is pretty stable? Or does Clinton weakening in the red states she had hoped to pick up mean Trump still has some momentum left?
Stay tuned.
62.1 days until real election results start to come in.
Note: This post is an update based on the data on ElectionGraphs.com. Election Graphs tracks both a poll based estimate of the Electoral College and a numbers based look at the Delegate Races. All of the charts and graphs seen in this post are from that site. Additional graphs, charts and raw data can be found there. Follow @ElectionGraphs on Twitter or like Election Graphs on Facebook to see announcements of updates or to join the conversation. For those interested in individual general election poll updates, follow @ElecCollPolls on Twitter for all the polls as they are added. If you find the information in these posts interesting or useful, please consider visiting the tip jar.
States with new poll data added since the last update: Virginia, Iowa, New Hampshire, Ohio, California, Texas, Pennsylvania, Florida, New York, Illinois, North Carolina, Indiana, Georgia, Missouri, Arizona, Massachusetts, Wisconsin, Tennessee, New Jersey, Minnesota, Washington, Michigan, South Carolina, Maine (All), Louisiana, Utah, Oklahoma, Alabama, Nebraska (All), Oregon, Kansas, Maryland, Kentucky, Mississippi, Nevada, Connecticut, Arkansas, West Virginia, Colorado, Idaho, New Hampshire, Alaska
We have the weekly batch of polls from Ipsos, plus a handful of other scattered polls. One state changes category:
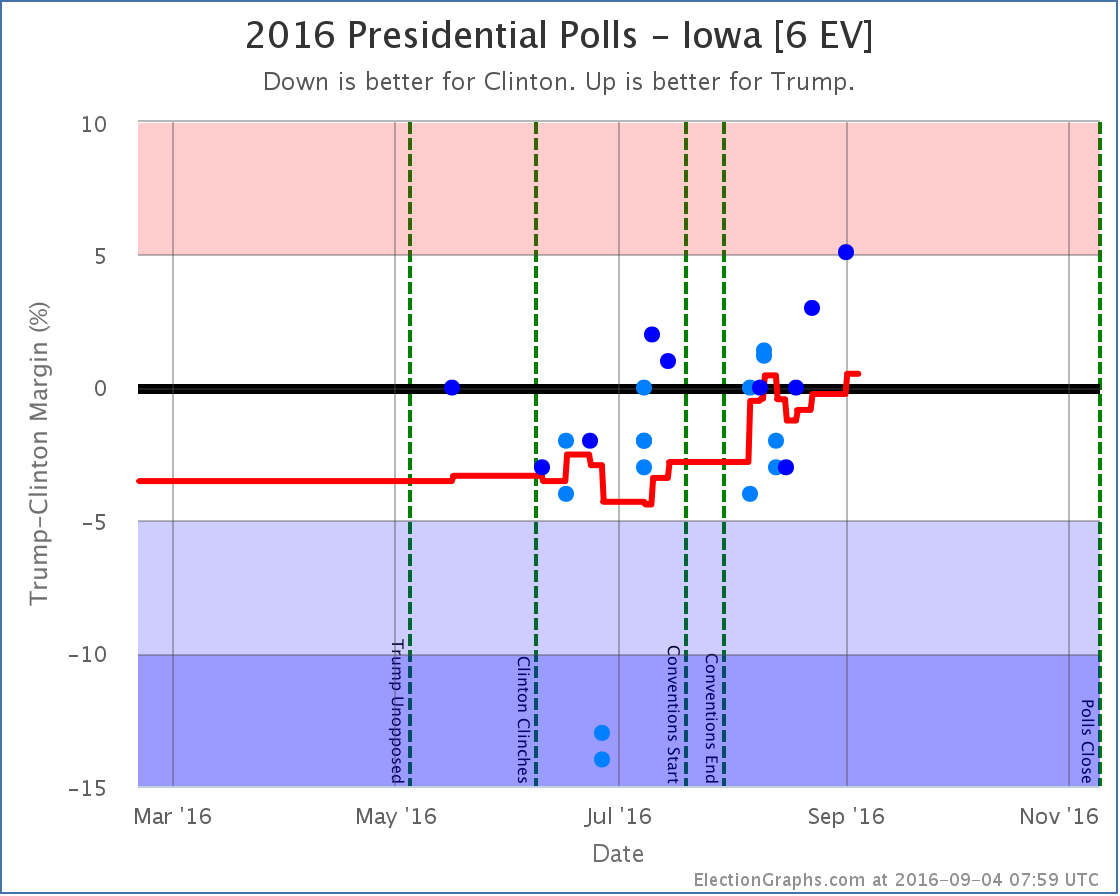
After having been “Weak Clinton” through July, for the last month the average in Iowa has been hovering right around the center line. It had become “Weak Trump” for a short time in the second week of August, but then quickly moved back to Clinton. With the latest couple of polls showing Trump leading, the average moves once again to the Trump side of the line.
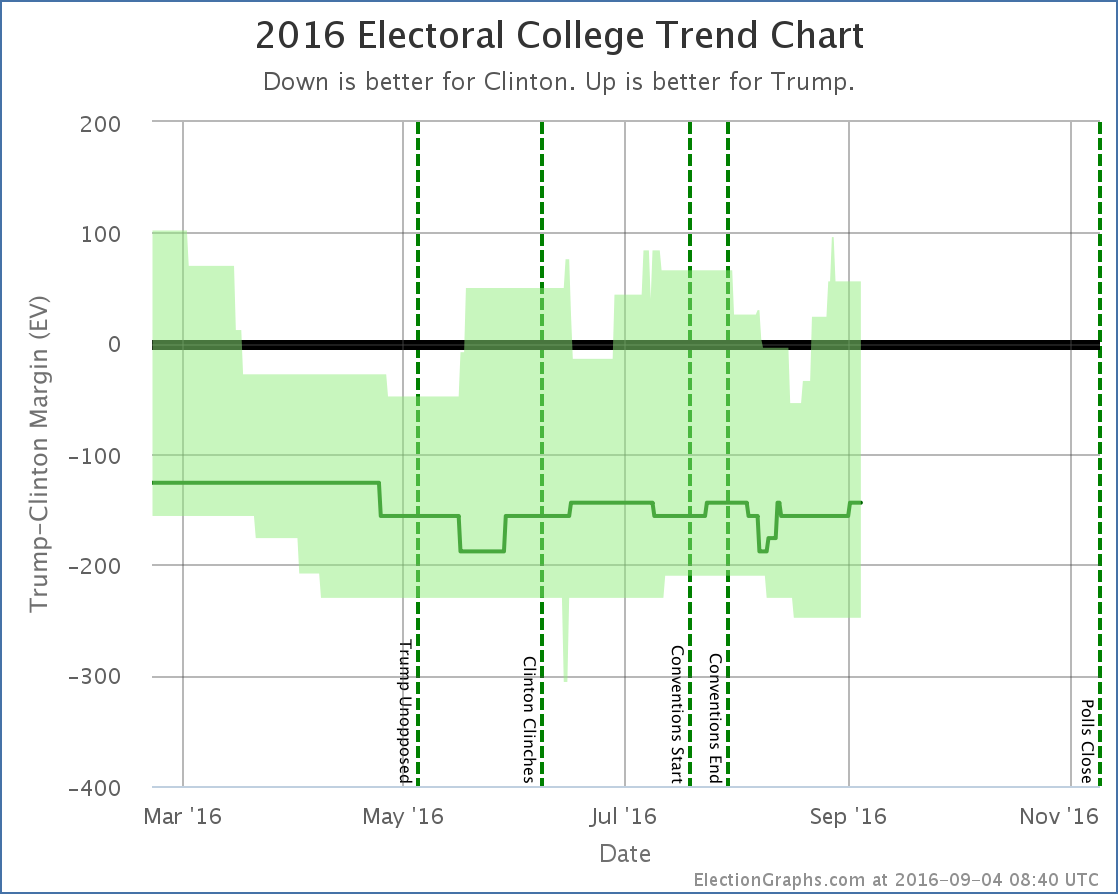
This is a narrow lead… 0.5%… it could move back to the other side of the line with the next poll. But for now, Trump leads in Iowa, and so this changes the expected results line:
This brings the expected case to a 144 electoral vote win for Clinton. This matches the best Trump has done since April. In terms of the expected case, the metric that actually matters the most, this has seemed like Trump’s ceiling ever since he locked up the nomination. He has been able to move his best case, but in terms of moving blue states over to his side of the line, he just hasn’t been able to push past this level.
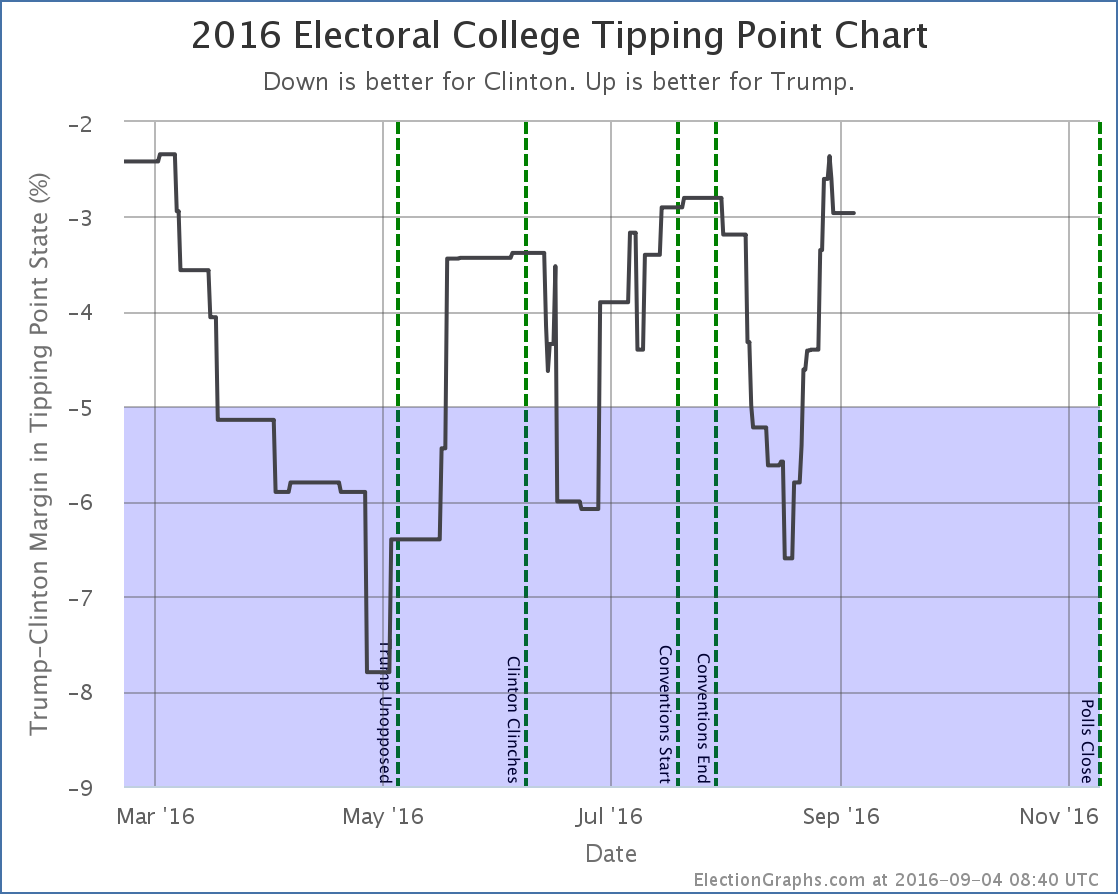
With average changes in Ohio and Florida, the tipping point also moved:
Prior to the current batch of polls, the tipping point was Clinton +3.8% in Ohio. The new polls exposed a brief spike to Clinton only leading by 2.4% in Michigan, but then falling back to Clinton +3.0% in Florida. The net change in this update is still a 0.8% movement toward Trump though.
As with the expected electoral college result, Trump is near the top of his recent range. A 3.0% Clinton tipping point means that only a small uniform shift across all states would push Trump into the lead. The race is actually relatively close here. So why is most of the talk still about how Clinton is clearly winning?
Well, first of all, because she is. Trump has never led in either the electoral college expected case or the tipping point. She is just objectively in the lead and always has been.
Second, we have seen the whole race wiggle around in a zone. Things move up and down within that zone, but seem to have trouble escaping it. On the one side Clinton can’t seem to break out to move things from just a regular comfortable win to doing better than Obama did against McCain, and on the other side, Trump can make the race tighter, but hasn’t been able to break the barrier of matching or improving on Romney’s performance.
Since April, it has looked like Trump would do better than McCain (192 EV loss), but not as well as Romney (126 EV loss). It just seems like that is where this race wants to be, at least in terms of the electoral college. Of course, both of those men lost. This range does not include winning.
So for Trump to win, things need to change and move into a zone they have not been in before. And he is running out of time. The next opportunity will likely be the debates. The first one is in 22 days. Then we have 65.3 days until results start rolling in.
Note: This post is an update based on the data on ElectionGraphs.com. Election Graphs tracks both a poll based estimate of the Electoral College and a numbers based look at the Delegate Races. All of the charts and graphs seen in this post are from that site. Additional graphs, charts and raw data can be found there. Follow @ElectionGraphs on Twitter or like Election Graphs on Facebook to see announcements of updates or to join the conversation. For those interested in individual general election poll updates, follow @ElecCollPolls on Twitter for all the polls as they are added. If you find the information in these posts interesting or useful, please consider visiting the tip jar.
On this week’s Curmudgeon’s Corner podcast Sam and Ivan talk about this week’s Election 2016 craziness… Trump in Mexico and Arizona, the FBI notes on Clinton, all of that stuff that you could possibly want. Before that though, they do a lightning round covering all sorts of other things… burkinis and Colombia, exploding phones and Anthony Weiner… and more. Oh, and they both want to sleep more. ZZZzzz…
Click below to listen or subscribe… then let us know your own thoughts!
1-Click Subscribe in iTunes View Podcast in iTunes View Raw Podcast Feed Download MP3 File Follow the podcast on Facebook Support us on Patreon
States with new poll data since the last update: Florida, Michigan, Arizona, North Carolina
In the last update, Clinton’s lead in Florida moved to more than 5% and therefore winning Florida was taken out of Trump’s best case. At the time, I said: “Now, a couple of the data points here look like they might end up being outliers. If so, expect the average to bounce back a bit in Trump’s direction as new polls come out.” That has indeed already happened…
After several polls showing Clinton with a very strong lead, the last few results have shown Trump with a narrow lead. So the average bounces back toward Trump. On balance, Clinton still leads, but now only by 4.5%. Since this is under 5% Florida once again looks like a possible Trump pick up and is included in Trump’s best case:
Trump’s best case is still too lose, but with Florida in the mix it is a lot closer. If Trump wins all the states he is ahead in, plus all the states where he is close, he now loses by only 8 electoral votes.
Since Florida was the tipping point, that metric also moves:
The tipping point is now back at a 6.0% Clinton lead in Connecticut, back where it was a couple weeks ago.
So does this mean Trump is bouncing back? We have had a couple of moves toward Trump in the last couple weeks… but we have had even more moves toward Clinton. It is too early to call a bottom for Trump and say he is on his way back. As usual, we need to keep watching.
74.4 days left until polls start to close.
Notice on Methodology: In my August 13th update I solicited opinions on possibly changing how this site deals with the case when a pollster releases multiple results from a single poll. See the discussion in that comment thread for more details. This weekend I will be working to change the site logic so that if two results are released from a poll, each counts as only half a poll for purposes of the averages here. As an example of the impact that would have: With the current method Florida shows a 4.5% Clinton lead. With the proposed new method Florida would show a 4.8% Clinton lead. Both would be “Weak Clinton”.
Note: This post is an update based on the data on ElectionGraphs.com. Election Graphs tracks both a poll based estimate of the Electoral College and a numbers based look at the Delegate Races. All of the charts and graphs seen in this post are from that site. Additional graphs, charts and raw data can be found there. Follow @ElectionGraphs on Twitter or like Election Graphs on Facebook to see announcements of updates or to join the conversation. For those interested in individual general election poll updates, follow @ElecCollPolls on Twitter for all the polls as they are added. If you find the information in these posts interesting or useful, please consider visiting the tip jar.
States with new poll data since the last update: Ohio, Iowa, South Carolina, North Carolina, Virginia, Utah, Missouri, Florida, New Mexico
More bad news for Trump, this time from Florida and South Carolina:
Florida
As has been somewhat the normal state of things in Florida, there is a huge range of poll results. At the moment the Election Graphs average includes results from Clinton leading by 14.5% to Trump leading by 2%. But on average, the polls have been trending toward Clinton, and with the latest additions, Clinton’s lead increases to 8.1%. Now, a couple of the data points here look like they might end up being outliers. If so, expect the average to bounce back a bit in Trump’s direction as new polls come out.
For the moment though, Clinton’s lead is big enough that Florida is no longer looking like a possible pickup for Trump. And Florida is part of almost any winning scenario for Trump. Without Florida a path to the White House is almost impossible.
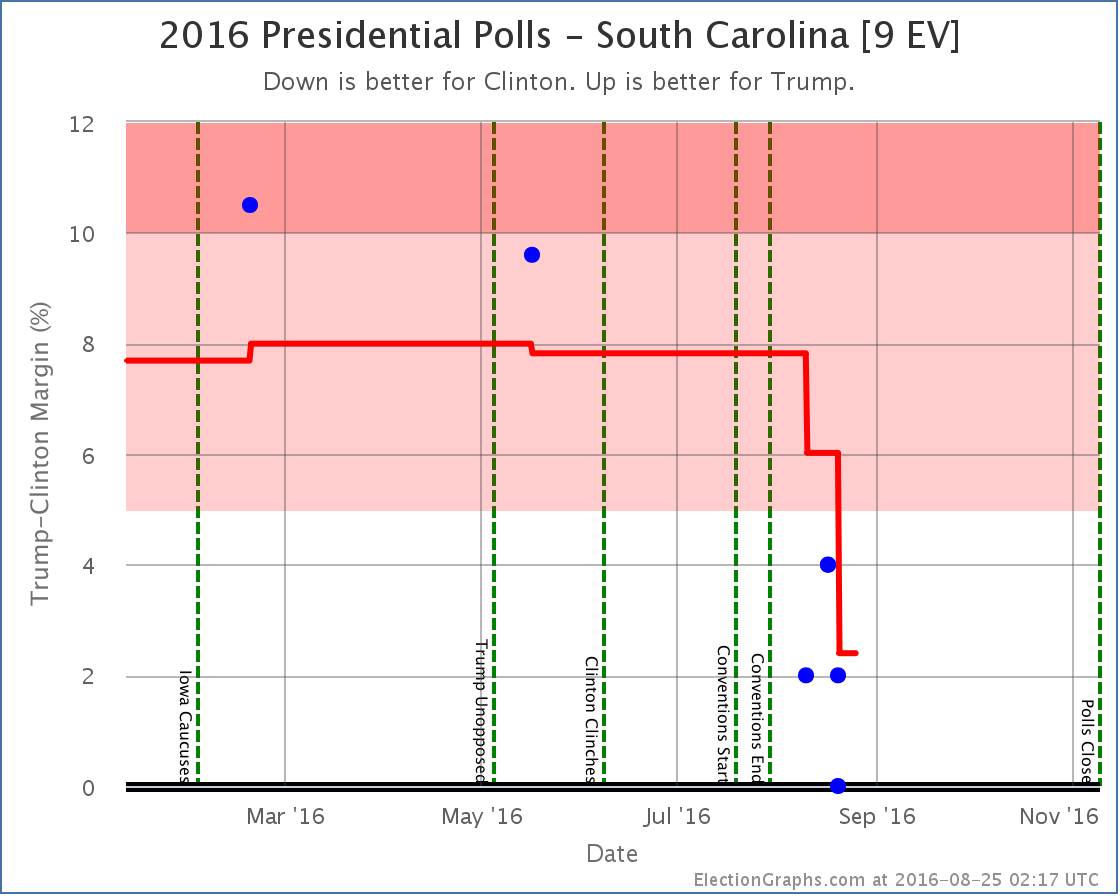
South Carolina
Meanwhile, Trump is also slipping in South Carolina:
South Carolina hadn’t been polled much, but prior to the conventions the average there was a 7.8% Trump lead. Every poll since the conventions has shown Trump with a much narrower lead though. To be sure, there has not yet been any poll showing Clinton ahead in South Carolina. But the poll average drops to a 2.4% Trump lead. Narrow enough that Clinton stealing it has to be allowed as a possibility.
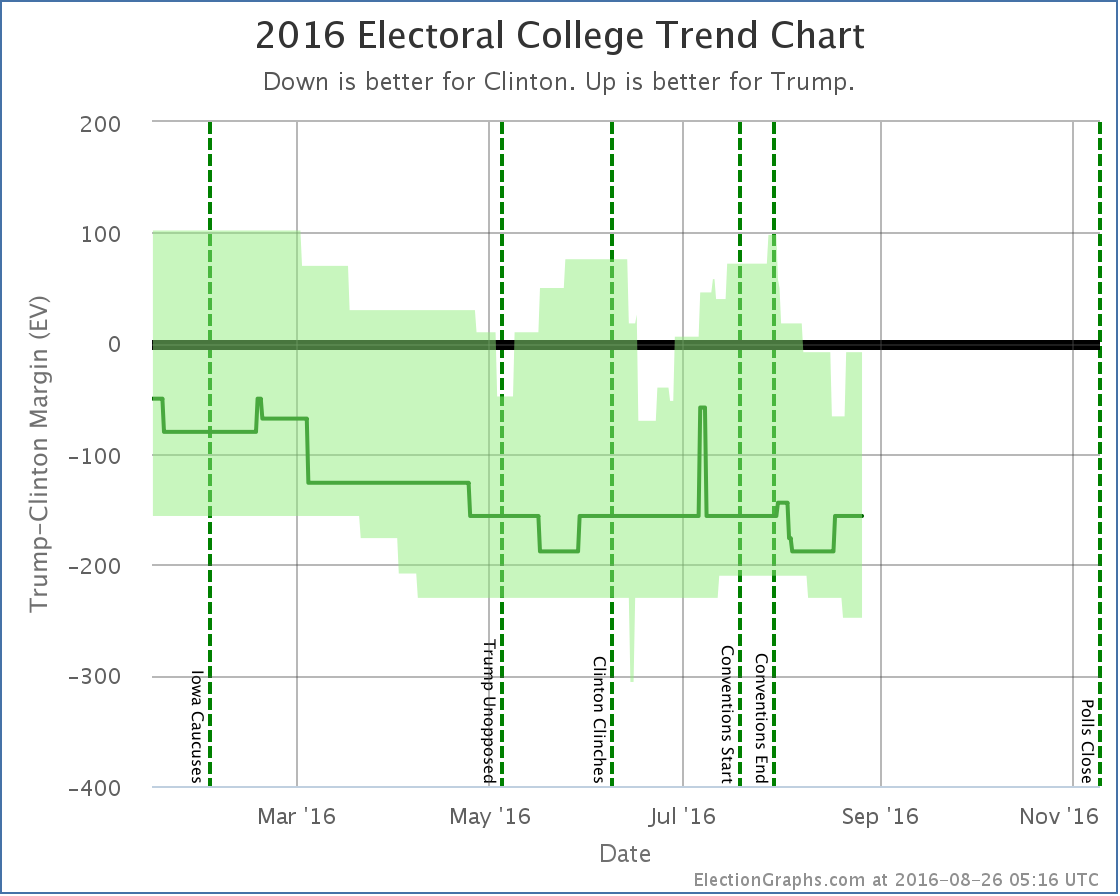
National View
With Florida no longer in play for Trump, and South Carolina now in play for Clinton, the “bubble” now looks like this:
Trump’s best case is now almost as bad as it was back in June. Clinton’s best case is now the best it has been aside from those two days in June when Texas looked close.
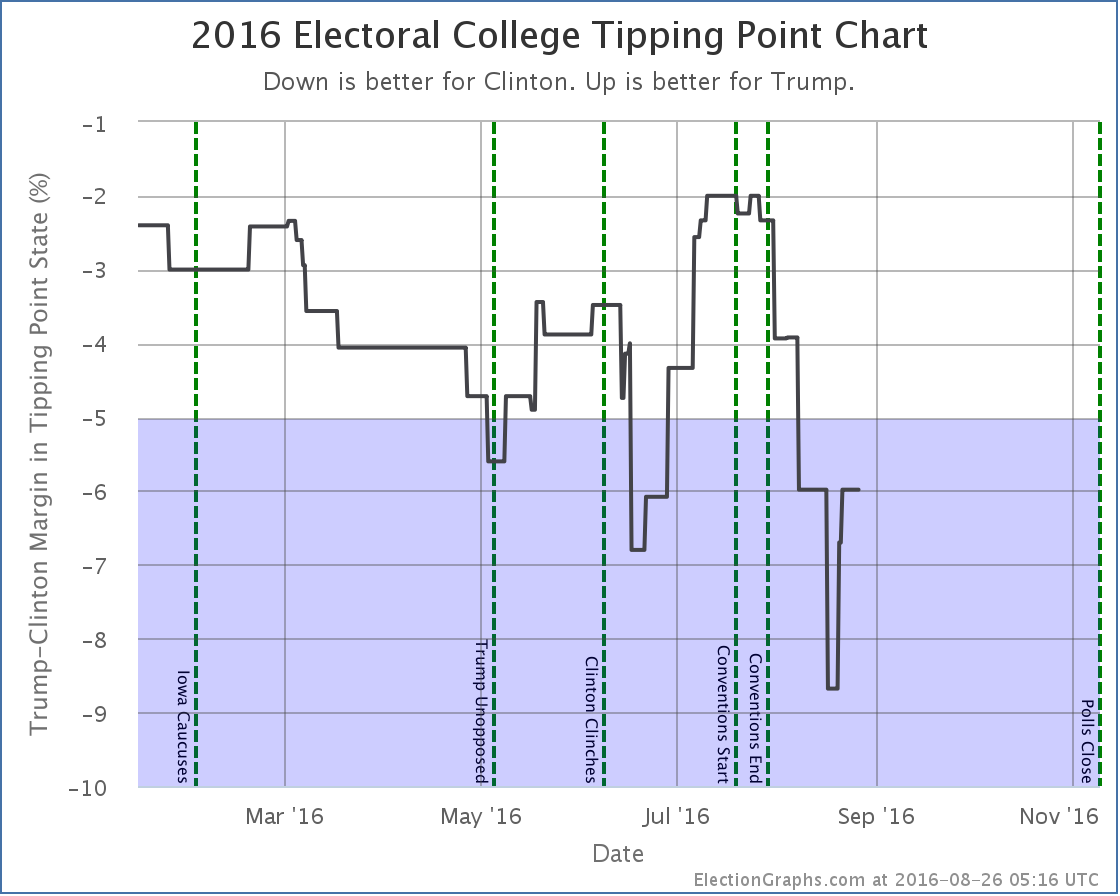
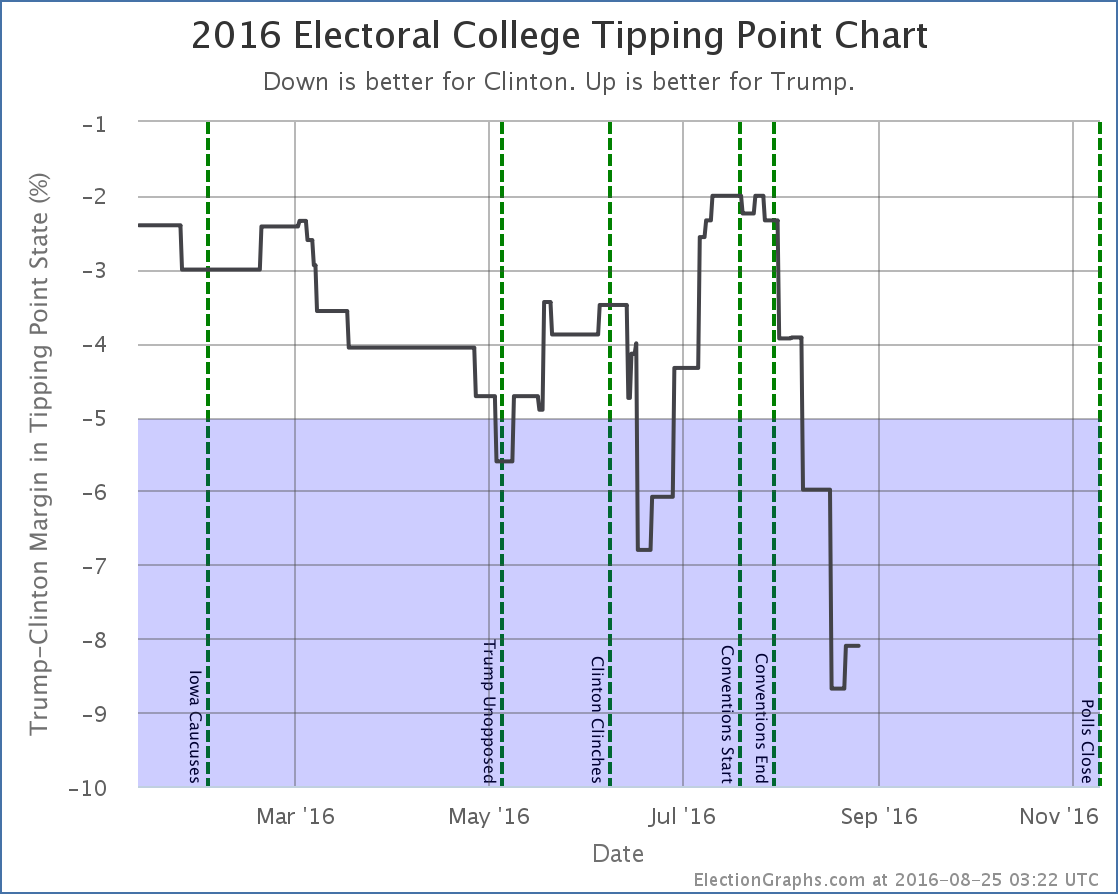
The most dramatic change however has been in the tipping point. With Clinton’s lead in Florida increasing dramatically, the tipping point moved from a 6.0% Clinton lead in Connecticut to an 8.1% Clinton lead in Florida:
There were actually two Florida polls in today’s update, the second one was more favorable to Trump, so you see above that the tipping point actually dipped down as far as a 8.7% Clinton lead before bouncing back to 8.1%.
The tipping point can be thought of as how much the polls in every state would have to move (if they all moved together) to flip the winner of the race. It is essentially the equivalent of looking at the national popular vote margin, but adjusted to take into account the structure of the electoral college. The downward trend here is brutal for Trump.
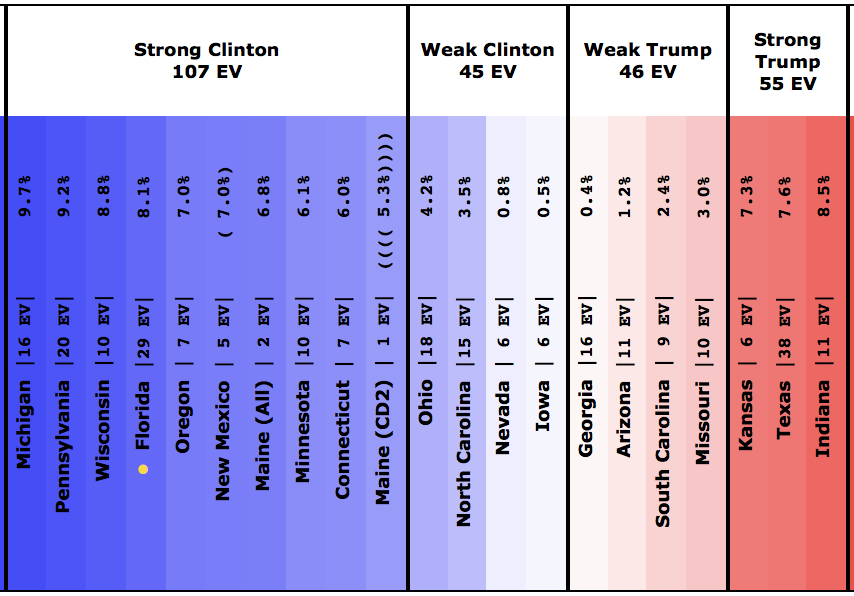
The center of the spectrum of states now looks like this:
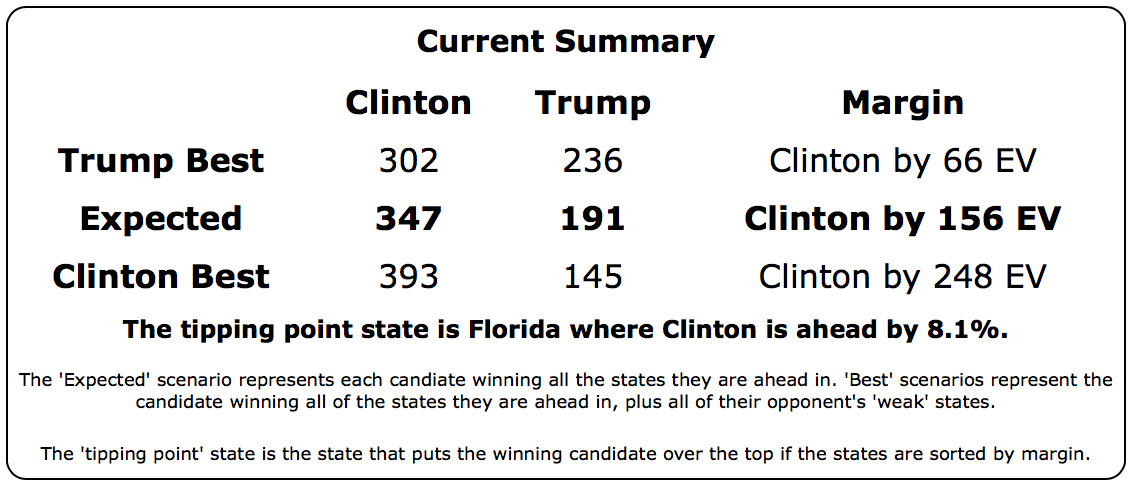
And the overall summary like this:
Even if you give Trump all of the close states, he still loses by 66 electoral votes.
Trump is currently losing, and losing badly. Even if he managed movement along the lines of what he saw from mid-June until the conventions, it would only get him back to having a narrow win in his best case scenario. He would still have quite some way to go in order to actually lead.
Things do happen in campaigns, but a comeback from this far behind would take an absolutely seismic change in how this campaign is going… and there are only 75.7 days left.
Notice on Methodology: In my August 13th update I solicited opinions on possibly changing how this site deals with the case when a pollster releases multiple results from a single poll. See the discussion in that comment thread for more details. I’ve concluded that I do want to make a change to re-weight those cases, so that if two results are released from a poll, each counts as only half a poll for purposes of the averages here. I am going to try to adjust the site this coming weekend to make this change. Although the overall picture will remain similar, some states will “jiggle”. For instance, with the current method the average in South Carolina is a 2.4% Trump lead. The drop to that level was one of the items highlighted in today’s post. But the five poll average includes 2 results from a Feldman poll and 2 from a Gravis poll. If the average was calculated in the proposed new way South Carolina would show a 5.4% Trump lead. So it would move back to being “Strong Trump” rather than “Weak Trump” because there would be less weight on the post-convention polls showing a close race, and two additional older polls showing a strong Trump lead would be included in the average. If all goes well, I’ll make a post about the new methodology and any resulting changes to the classifications of the states and such after the surgery on the site is complete. If my changes fail, I’ll roll things back and try again another weekend. :-)
Note: This post is an update based on the data on ElectionGraphs.com. Election Graphs tracks both a poll based estimate of the Electoral College and a numbers based look at the Delegate Races. All of the charts and graphs seen in this post are from that site. Additional graphs, charts and raw data can be found there. Follow @ElectionGraphs on Twitter or like Election Graphs on Facebook to see announcements of updates or to join the conversation. For those interested in individual general election poll updates, follow @ElecCollPolls on Twitter for all the polls as they are added. If you find the information in these posts interesting or useful, please consider visiting the tip jar.
States with new poll data since the last update: Tennessee, Arizona, Florida, Pennsylvania, Michigan, New Hampshire, North Carolina, Kentucky.
It looks like Trump’s last couple of bad weeks are starting to hit the state poll averages. In this update, we have model changes caused by the movement in three states. All three changes favor Clinton.
Going through them one by one…
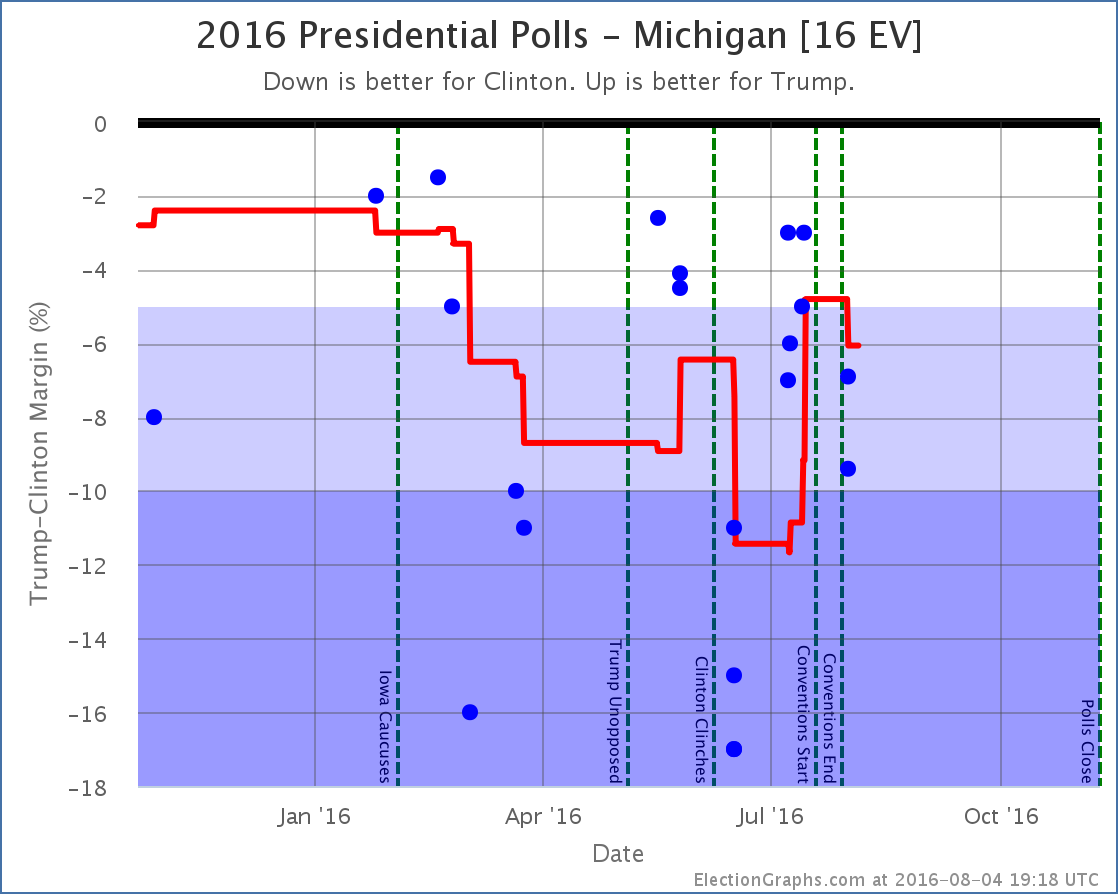
Michigan [16 EV]
First of all, I will point out a new feature on these charts. There are now vertical dotted lines marking significant campaign events. Right now that is the Iowa caucuses, when the candidates won their primaries and the conventions. When/if debates happen, they will get marked as well. This is helpful in understanding the moves vs what may be going on in the campaign.
In Michigan specifically, you can see that Trump was gaining on Clinton in the run up to the conventions. The average popped up into the “close state” zone right before the conventions started. But with the first post-convention polls, Clinton’s lead increases again. She now has a 6.1% lead in Michigan, and the state is no longer included in Trump’s “best case”.
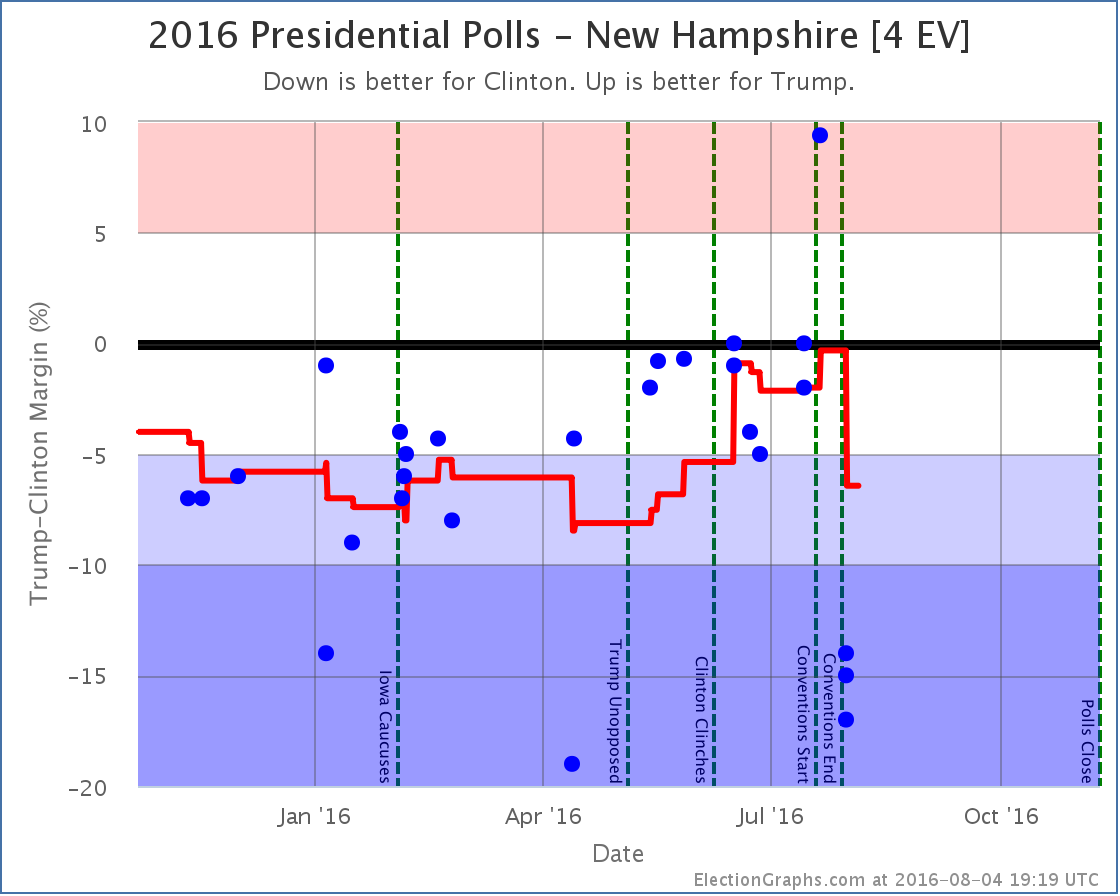
New Hampshire [4 EV]
A poll taken during the Republican convention was the best result Trump has ever gotten in New Hampshire. This had moved the average to an very narrow 0.3% Clinton lead. The first results from after the Democratic convention on the other hand are some of the worst results Trump has seen in New Hampshire, and Clinton’s lead rises to 6.4%. So, like Michigan, New Hampshire is no longer looking like a possible Trump pick up. Since New Hampshire also moved past the tipping point, the tipping point also moved.
Now, both the Trump result during the Republican convention, and these new results look like outliers. Every other poll since May has been between a tie and Clinton +5%. So polls showing Trump up by 9.4%, or polls showing Clinton up by 17% should all be taken with a massive grain of salt. Given national trends some swing toward Clinton is expected, but we need to see more polls before concluding that the swing toward Clinton in New Hampshire is quite as large as the new polling indicates.* This is of course why we only look at averages rather than individual polls. The average moved quite a bit, but it doesn’t instantly snap to these new results. But it still moves enough to make a difference.
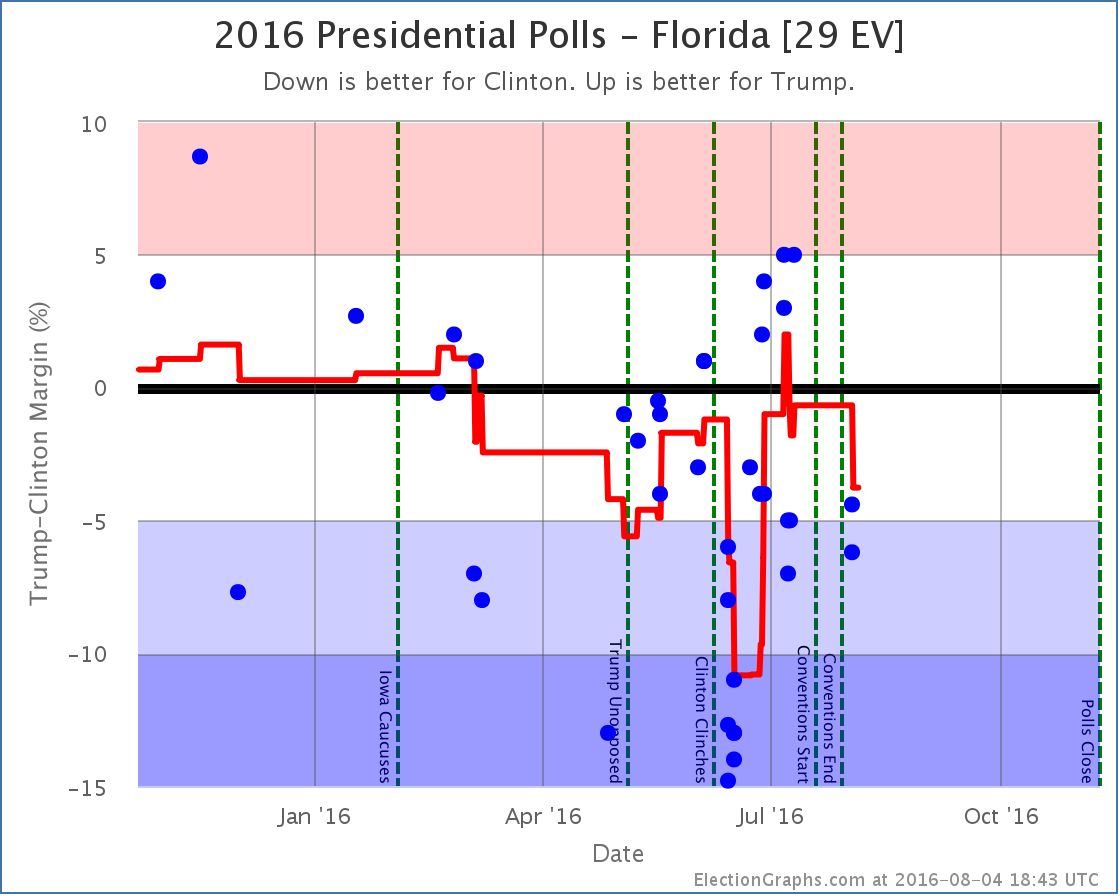
Florida [27 EV]
The first post-convention results in Florida move the average toward Clinton. Florida goes from a 0.7% Clinton lead to a 3.8% Clinton lead. No category change here. Florida is still weak Clinton, but since the average passes the tipping point, the tipping point gets shifted.
National View
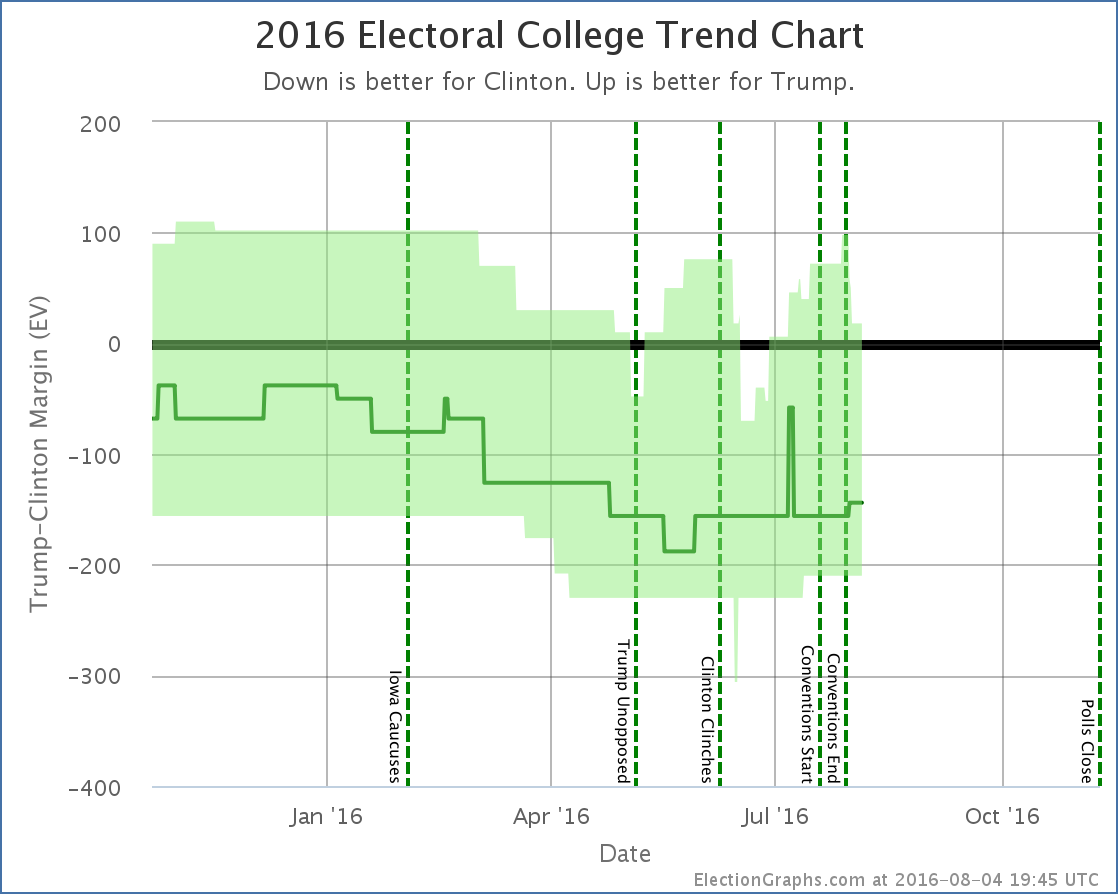
With each of the three states that caused changes out of the way, time to look at the national picture.
First the “bubble” showing the best and expected cases over time:
Right before the Democratic convention ended, Trump’s best case was up to winning by 98 electoral votes. Since then Pennsylvania, Michigan, and New Hampshire have slipped out of reach. His best case is now down to winning by only 18 electoral votes. He is one bad poll in Virginia, Florida, or North Carolina away from once again having his best case be a loss.
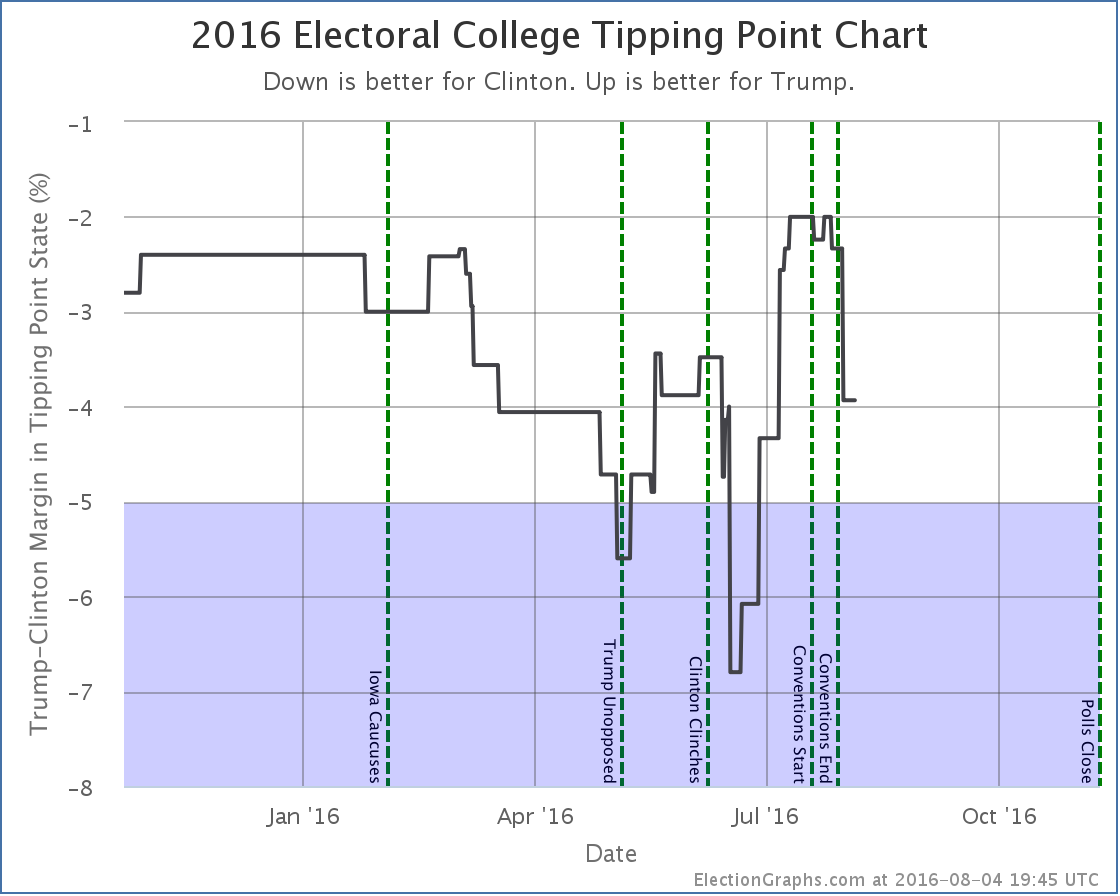
And with the movements in Florida and New Hampshire the tipping point moves dramatically as well:
The tipping point margin… that is the margin in the state that would put the candidate “over the top” if you order the states by how strongly they support the candidates, moves from Clinton by 2.3% in North Carolina to Clinton by 3.9% in Virginia.
Before the conventions, Trump had dramatically improved his position in the tipping point. He was still losing, but by much less than before. He has now given up about 40% of the margin he gained.
A 3.9% tipping point margin… which is basically equivalent to the national popular vote margin, but adjusted for the structure of the electoral college… is still a close race. But not as close as it was before the conventions… and there are many close states that have not yet had post-convention polls.
Given where national polling is right now, once we do get more state polls, it would not be surprising to see Trump continue to drop in the short term.
95.7 days until the first polls start to close on election day.
* For the wonkiest of you out there: All three results showing Clinton up by double digits were from the same underlying WBUR poll sliced in different ways, so were not actually fully independent samples, so they don’t count as additional confirmation. This election cycle when I have a single poll that reports multiple results… just 2 candidates along side with 4 candidates, or registered voters and likely voters, or first response vs pushing leaners, I’m including ALL of the results rather than having some set of rules for picking only one. There are strong arguments for NOT doing this, specifically what I just mentioned about the results not being truly independent of each other, so you essentially end up giving more weight than you would otherwise to that pollster, simply because they reported their results in several different ways. I am simply defaulting to including everything on the theory that being more complete is better. I do understand the downsides though. I may decide to handle this a different way in 2020, but this is how it is for 2016. :-)
Note: This post is an update based on the data on ElectionGraphs.com. Election Graphs tracks both a poll based estimate of the Electoral College and a numbers based look at the Delegate Races. All of the charts and graphs seen in this post are from that site. Additional graphs, charts and raw data can be found there. Follow @ElectionGraphs on Twitter or like Election Graphs on Facebook to see announcements of updates or to join the conversation. For those interested in individual general election poll updates, follow @ElecCollPolls on Twitter for all the polls as they are added. If you find the information in these posts interesting or useful, please consider visiting the tip jar.
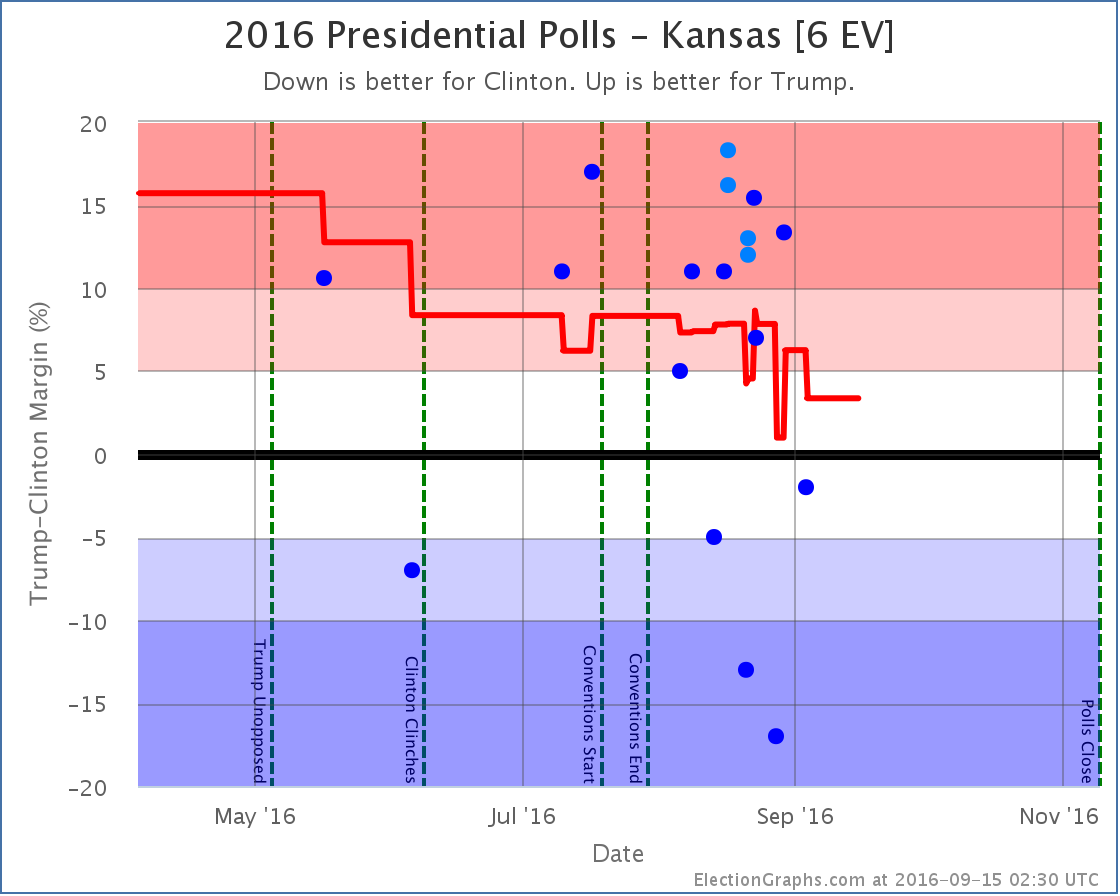
States with new poll data since the last update: Colorado, Florida, North Carolina, Virginia, Kansas, Missouri
Florida is close. Less than a week ago Trump took the lead for the first time since March.
With the latest polls, Clinton once again has a narrow lead.
With close states, do not be surprised if they go back and forth across the line.
With a big state like Florida, this can cause big fluctuations in the electoral college picture:
So we now have a big spike where Trump very very briefly led narrowly in both Florida and Pennsylvania. Then later polls almost immediately reversed those gains.
We are now back at Clinton 347 to Trump 191 in the “expected case” where everybody just wins all the states they are ahead in. This is a familiar place to be.
The Republican convention starts in 2.0 days. The Democratic convention in 9.1 days. It will probably take until at least a week after both conventions are over, maybe even two or three weeks, to fully know if there have been any enduring changes due to the conventions. So be patient.
Historically, conventions produce short term “bounces” that are fairly transient. They may even be too short to see on a state by state basis. But if any longer lasting changes happen, you’ll see them here.
115.3 days until polls start to close.
Note: This post is an update based on the data on ElectionGraphs.com. Election Graphs tracks both a poll based estimate of the Electoral College and a numbers based look at the Delegate Races. All of the charts and graphs seen in this post are from that site. Additional graphs, charts and raw data can be found there. Follow @ElectionGraphs on Twitter or like Election Graphs on Facebook to see announcements of updates or to join the conversation. For those interested in individual general election poll updates, follow @ElecCollPolls on Twitter for all the polls as they are added. If you find the information in these posts interesting or useful, please consider visiting the tip jar.
States updated with new poll data since last update: Nevada, Florida, Kentucky, New Hampshire
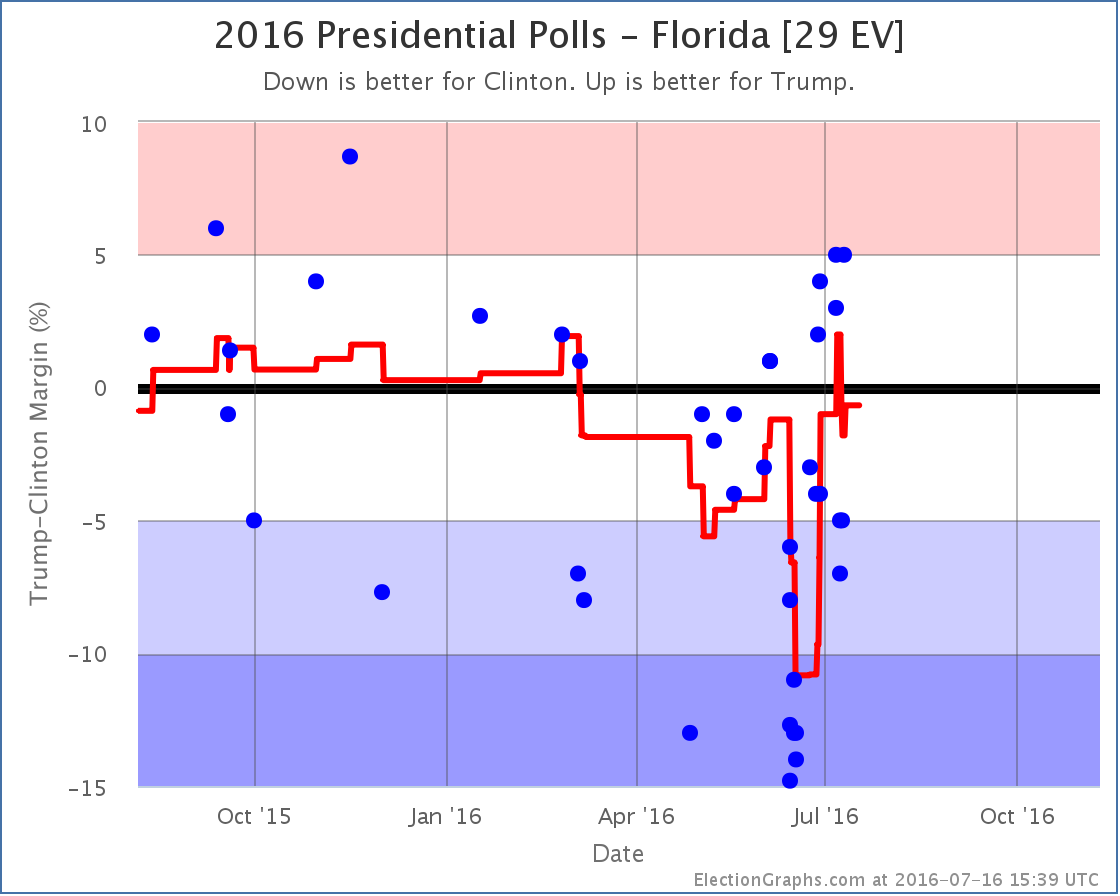
Just a couple weeks ago we were talking about how Clinton’s lead in Florida had gotten quite large, and it moved out of the possible pickups for Trump. This was on the strength of a number of polls that covered mid-June that were very positive toward Clinton, showing leads as high as 15% in the state. The worst mid-June poll for Clinton still showed her ahead by 6%. Those polls have now rolled off the average, replaced by new polls much more favorable to Trump. With the two new Florida polls added in this update, things move very rapidly in Trump’s direction:
With the two new polls in the mix, the average moved from Strong Clinton to Weak Clinton on June 28th. But things kept getting better for Trump. On July 10th the average moved from Weak Clinton to Weak Trump.* Trump takes the lead in Florida for the first time since March. At 29 electoral votes Florida makes a huge difference.
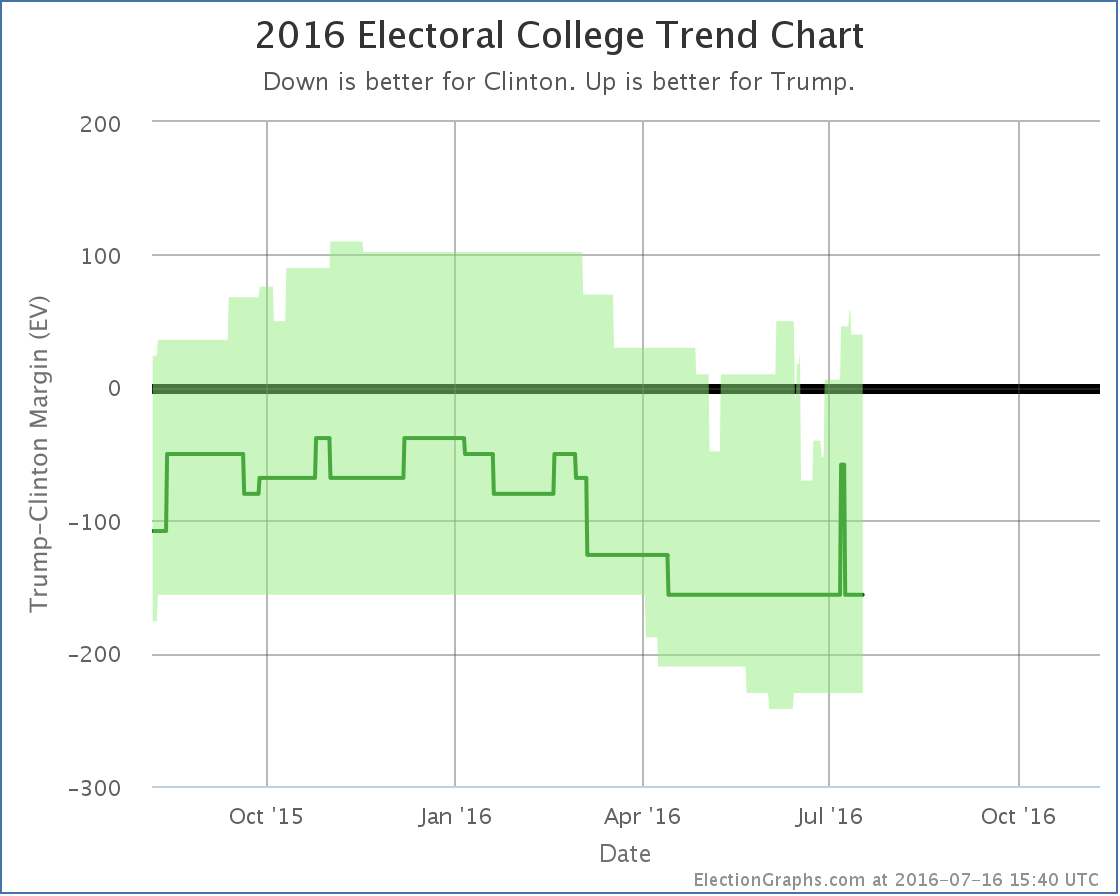
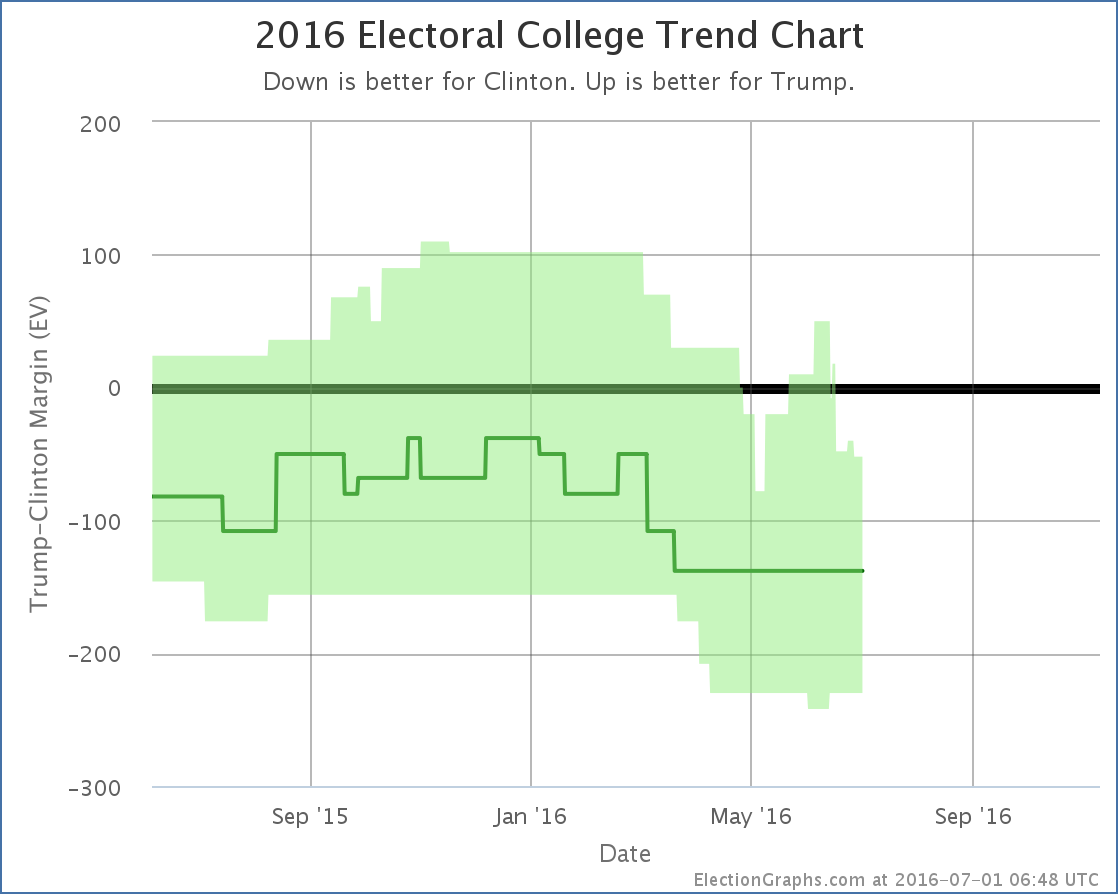
You can now see an upward movement on Trump’s best case a couple weeks ago, followed by the bump upward in the expected case more recently.
The electoral college view can move very quickly, especially when a big state like Florida swings its weight around. So after a few weeks of bad news for Trump and the trend looking like it was heading relentlessly against him, we now have the chart showing movement back toward Trump.
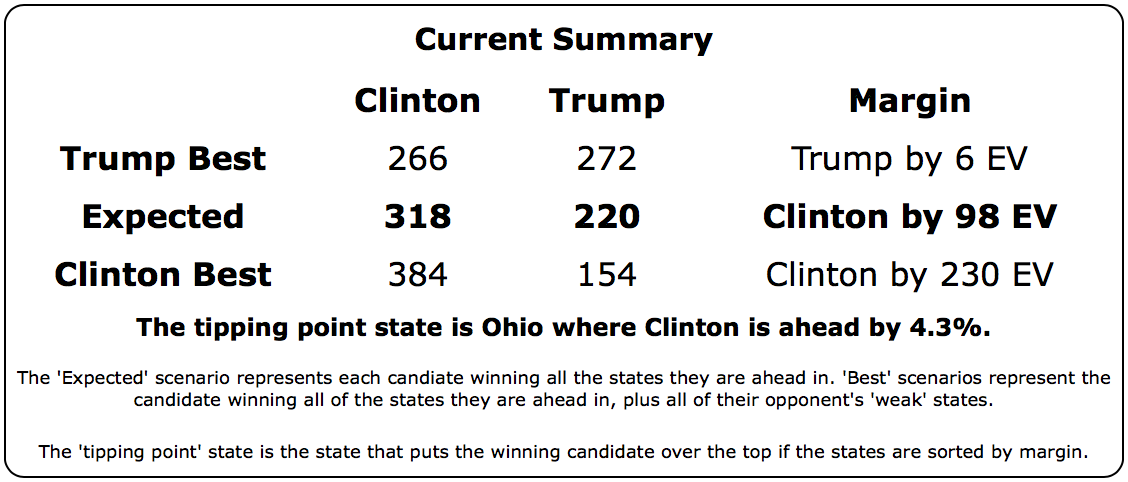
Trump is still behind, but once again he has a “best case” that includes him winning. With Florida not just in play, but actually on his side for the moment, if Trump wins all the states he is ahead in, plus all the states where Clinton leads by less than 5%, he squeaks out a narrow 6 electoral vote win.
In the “expected case” were each candidate wins the states they are ahead in, Trump now only loses by 98 electoral votes. This is now better than Romney’s 126 electoral vote loss as well as McCain’s 192 electoral vote loss. So while Trump is still losing, with current polling he is actually improving on the performance of the last two Republican candidates.
With Florida moving, the “tipping point” also moves:
Before this update the tipping point was a 5.7% Clinton lead in Florida. Now it is a 4.3% Clinton lead in Ohio.
One thing to point out in both of the graphs above is that we see a lot of volatility in the “Trump best case” and “tipping point” lines in the last couple of months. This is the natural result of general election polling ramping up once the nominations were settled. States that are near the tipping point or near category boundaries will “twinkle” as new polls cause the averages to bounce around. This will only increase as we get closer and closer to November. Although I post updates each time states move around in this way, it is important to watch the longer term trends, while remembering that things can sometimes shift quickly.
For now though, the current summary looks like this:
It is hard to overstate the importance of Florida here. With Florida out of reach, Trump’s best case was to lose. With Florida on his side, a win is once again in reach, although he still needs to flip every single one of Nevada, New Hampshire, Colorado, North Carolina, and Ohio to do it.
119.7 days until polls close on election day. Less than 6 days until the gavel drops on the Republican convention.
* For those wondering why in this single update we start referencing changes that happened in the average on June 28th and July 10th rather than a change that happens as of this update, this is because the graphs reflect changes due to polls at the mid-dates of the time they were in the field, not at the time the poll is announced, or the time I enter the poll into my data. So today two polls were added, the first covered June 26 to 28 and the second covered July 9 to 10. These became the most recent and 4th most recent polls I know about in Florida, and the line showing the average adjusts to reflect changes at the midpoint of those date ranges.
Note: This post is an update based on the data on ElectionGraphs.com. Election Graphs tracks both a poll based estimate of the Electoral College and a numbers based look at the Delegate Races. All of the charts and graphs seen in this post are from that site. Additional graphs, charts and raw data can be found there. Follow @ElectionGraphs on Twitter or like Election Graphs on Facebook to see announcements of updates or to join the conversation. For those interested in individual general election poll updates, follow @ElecCollPolls on Twitter for all the polls as they are added. If you find the information in these posts interesting or useful, please consider visiting the tip jar.
New polls since last update: Iowa, Florida, New York, North Carolina, Nevada, Arizona, Ohio, New Hampshire, Pennsylvania, Wisconsin, Michigan.
This is now the sixth day in a row that there has been movement in the Election Graphs models. I didn’t expect this kind of pace until September or October. Hopefully it won’t be this way the entire time until November, or your faithful commentator will be a burned out cinder by then.
In any case, in today’s update two changes contribute to the changes:
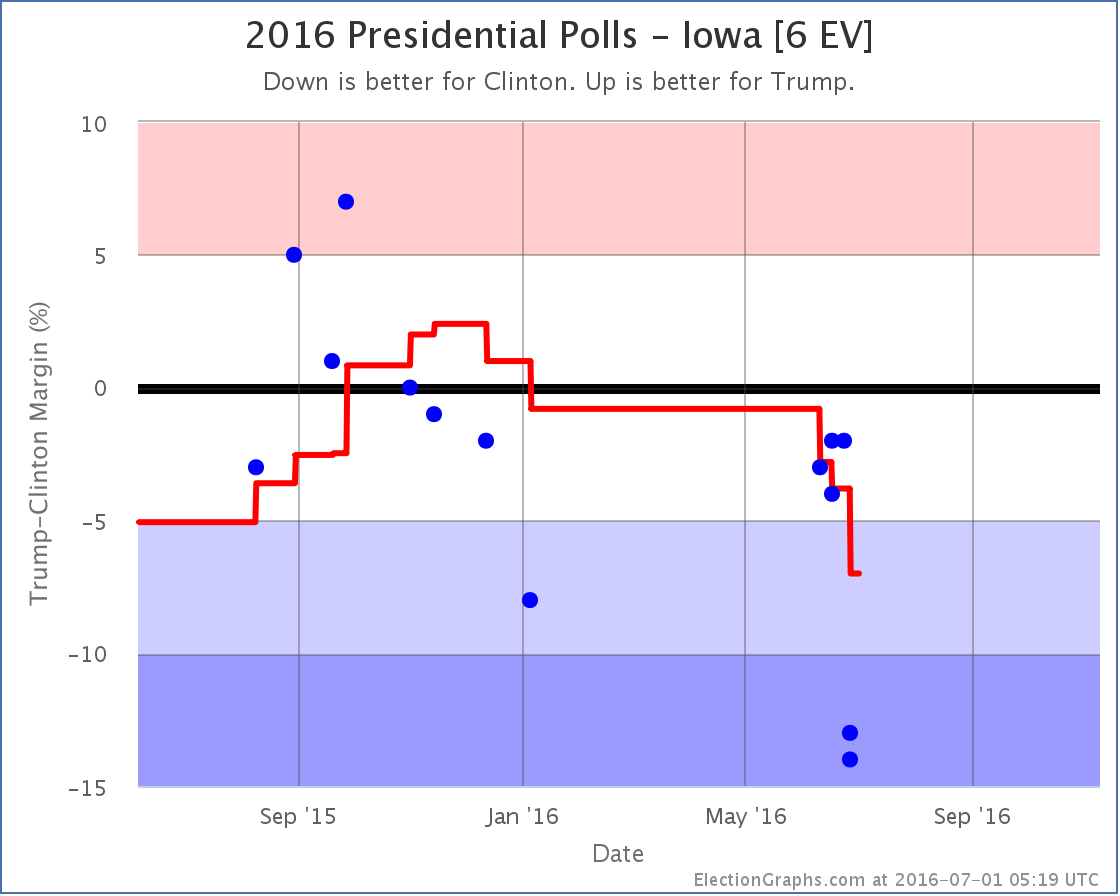
Iowa [6 EV]
The new Iowa polls by Loras (one with Johnson and Stein, one without) initially look like outliers. But there has been a wave of these polls showing bigger Clinton leads than we had seen previously this week. Are they all outliers? There will be no way to tell for sure until there is more polling. But do not be surprised if this “movement” reverses once these particular polls roll off of the average.
In the mean time though, we include all the polls in the average, and Iowa moves from Weak Clinton to Strong Clinton, which means it is no longer included in Trump’s best case.
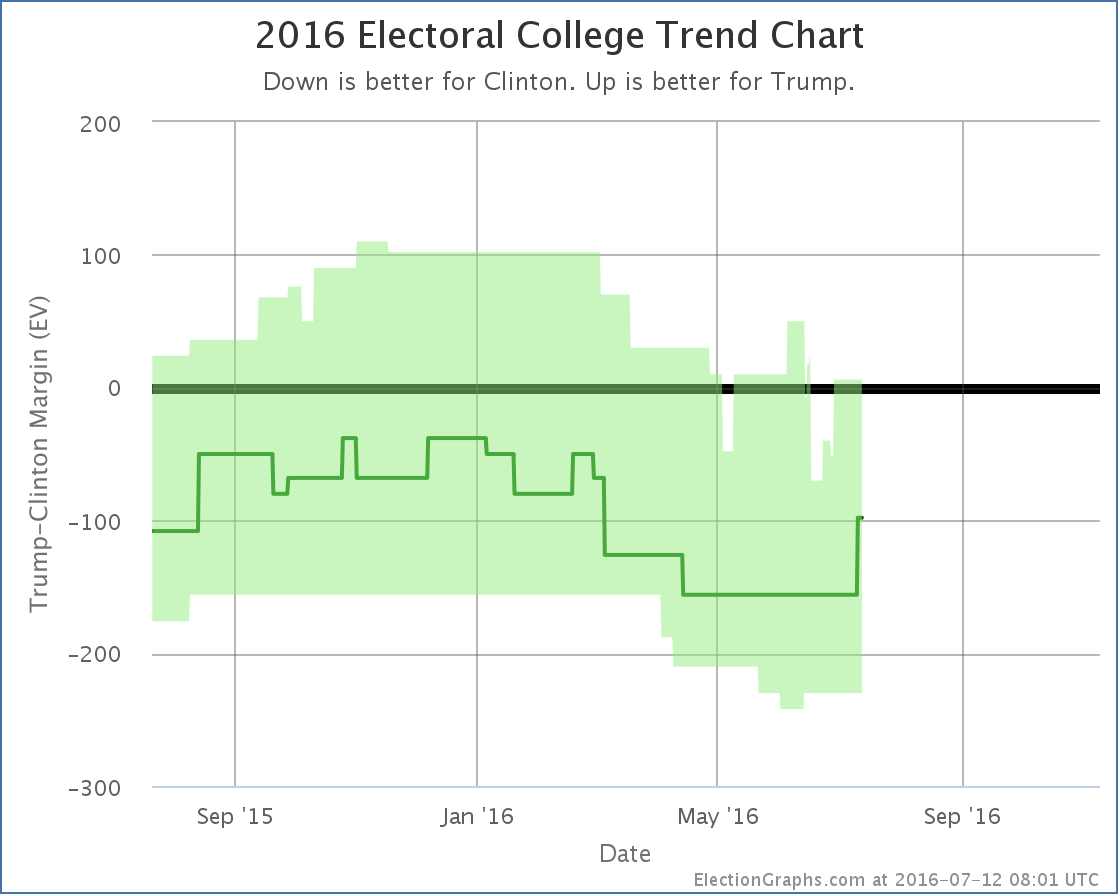
With Iowa not in play, Trump’s best case moves from losing by 40 electoral votes to losing by 52 electoral votes. This is still better than the picture was at the beginning of May, which Trump’s best case was to lose by 78 electoral votes, but even so, this isn’t a pretty picture for Trump.
After weeks of saying here that a Trump collapse was not yet visible in the state polls, you can now clearly see a Trump bump, followed by a collapse. Notable though is the fact that this is only visible in Trump’s “best case”, not the “expected case”. Trump made a number of states look close, but aside from some transitory short term changes that were erased as more polls were added, Trump has not moved any states over to his side of the line.
The expected electoral college result has been static at Clinton 338, Trump 200 since March.
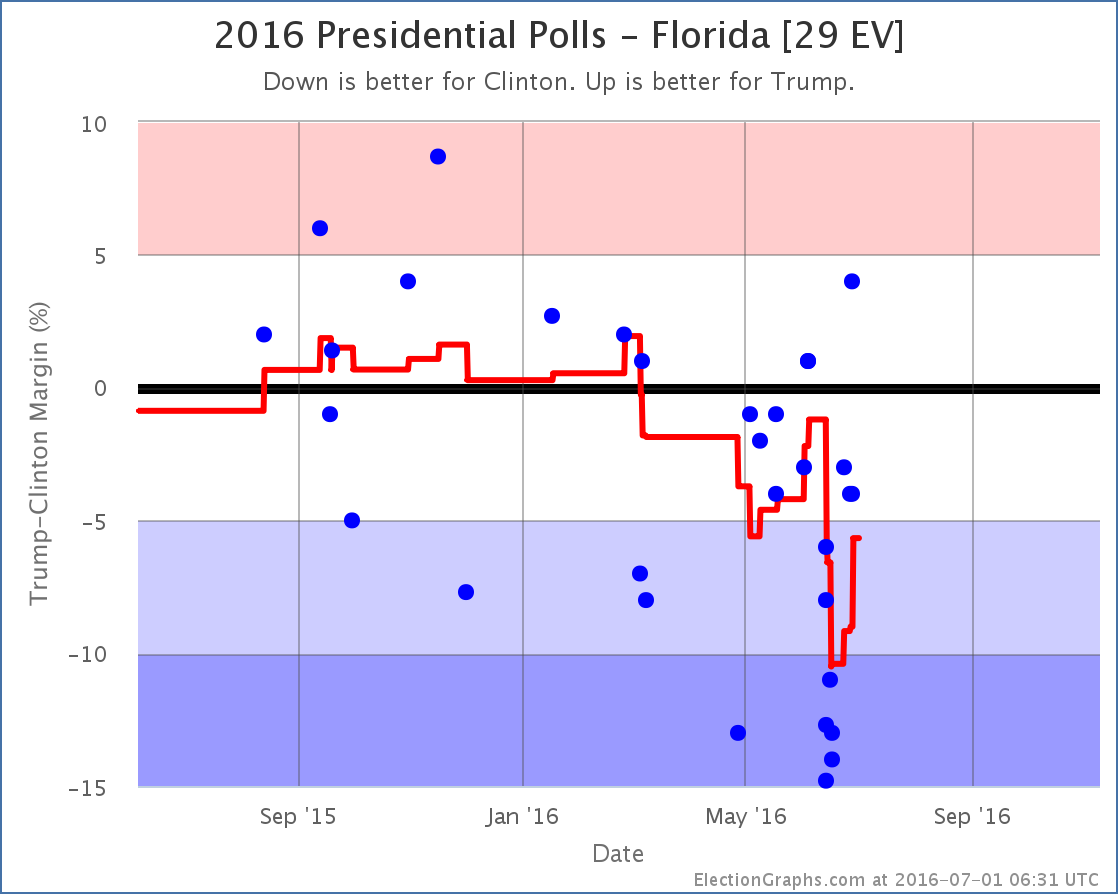
Florida [29 EV]
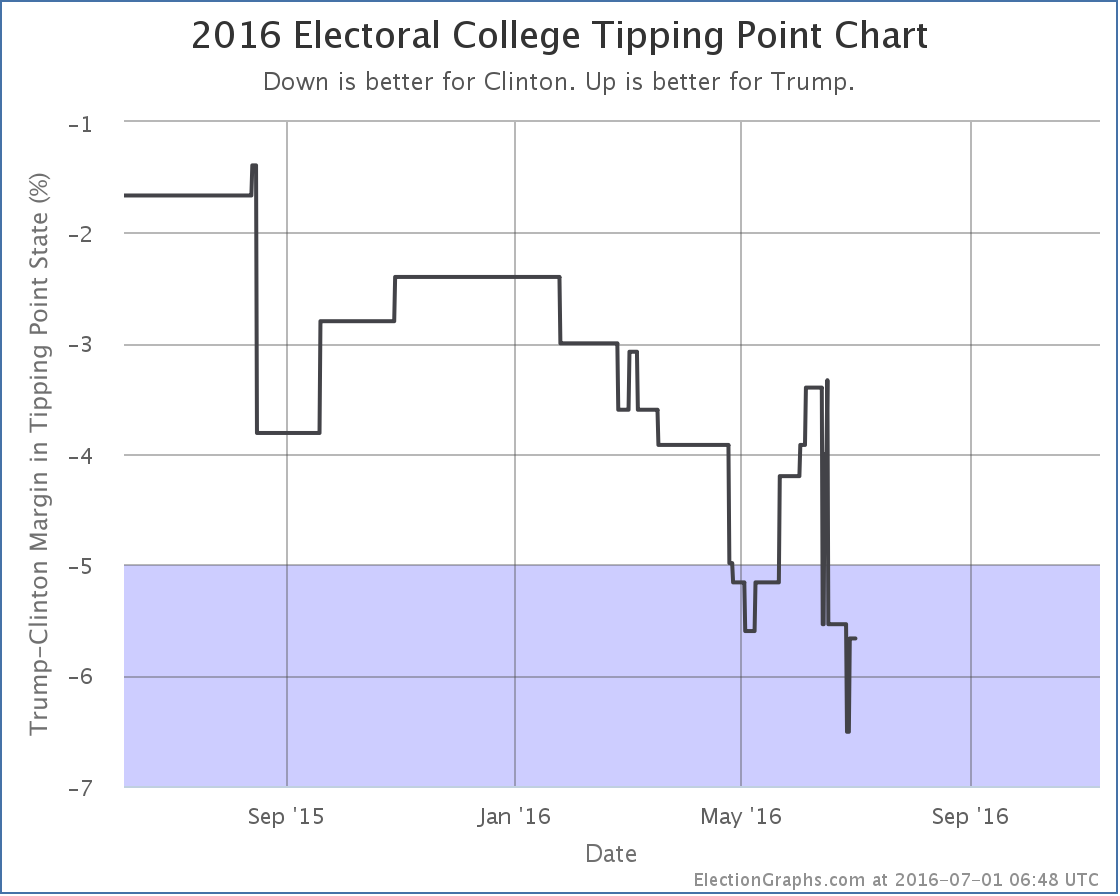
Florida does not change categories this time, but along with Iowa moves the tipping point.
Iowa moved toward Clinton. The Iowa poll covered a slightly earlier timeframe than the Florida poll. Iowa moved the tipping point from Clinton by 5.5% in Minnesota to Clinton by 6.5% in New Mexico.
But then Florida moved a bit toward Trump and almost immediately moved the tipping point back to Clinton by 5.7% in Florida.
You can see the spike down to 6.5% then immediate movement back to 5.7% on the chart. Net change is still a 0.2% movement toward Clinton.
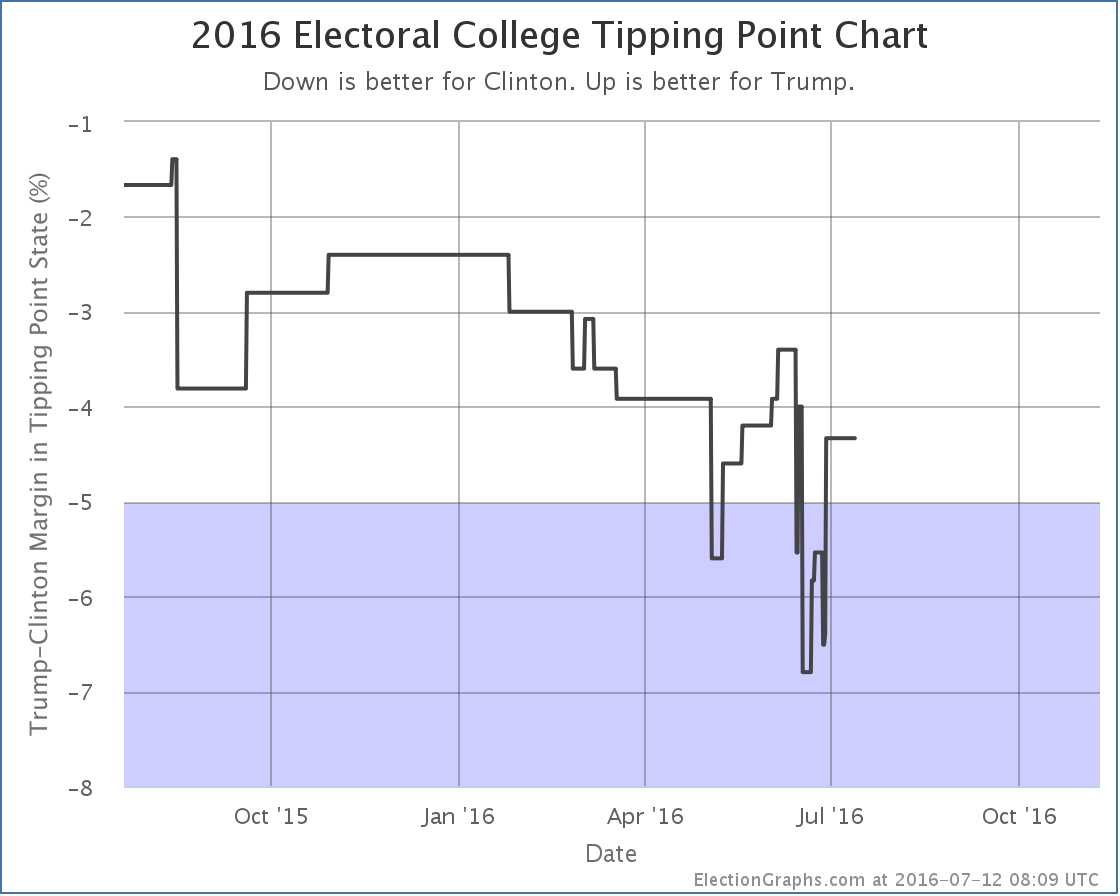
The Trump bump followed by a collapse is now clearly visible on the tipping point chart as well. Note that the “bump” only moved Trump to the zone he was in back in March. It never completely reversed the negative trend of the primary months. And this entire graph is on the blue side of the center line. Trump has never had a lead.
On this metric, with the recent collapse just hit his worst level ever (then bounced back a bit).
The way to read this trend along with the flatness in the expected electoral college result is that while Trump hasn’t fallen further behind in the electoral college, the states he would need to flip in order to win are moving further away from him, making the task of catching up with Clinton look harder and harder.
The picture has changed dramatically in just the last two to three weeks though, so it is important to keep in mind how volatile these numbers can be. Especially since a number of the polls that caused these changes initially look like they might be outliers.
It would not be surprising at all to see some movement back in the trump direction in the two weeks prior to the Republican convention. And of course the “usual” pattern is a bump after the Convention.
So keep watching. 130.3 days until polls start to close on election day.
Note: This post is an update based on the data on ElectionGraphs.com. Election Graphs tracks both a poll based estimate of the Electoral College and a numbers based look at the Delegate Races. All of the charts and graphs seen in this post are from that site. Additional graphs, charts and raw data can be found there. Follow @ElectionGraphs on Twitter or like Election Graphs on Facebook to see announcements of updates or to join the conversation. For those interested in individual general election poll updates, follow @ElecCollPolls on Twitter for all the polls as they are added. If you find the information in these posts interesting or useful, please consider visiting the tip jar.