This is the website of Abulsme Noibatno Itramne (also known as Sam Minter).
Posts here are rare these days. For current stuff, follow me on Mastodon
|
Aside from that one blip of good news in August every single update I’ve posted in many months has been more bad news for Clinton. This update is no exception, with two changes worth noting, both in favor of the Republican.
Clinton vs Bush
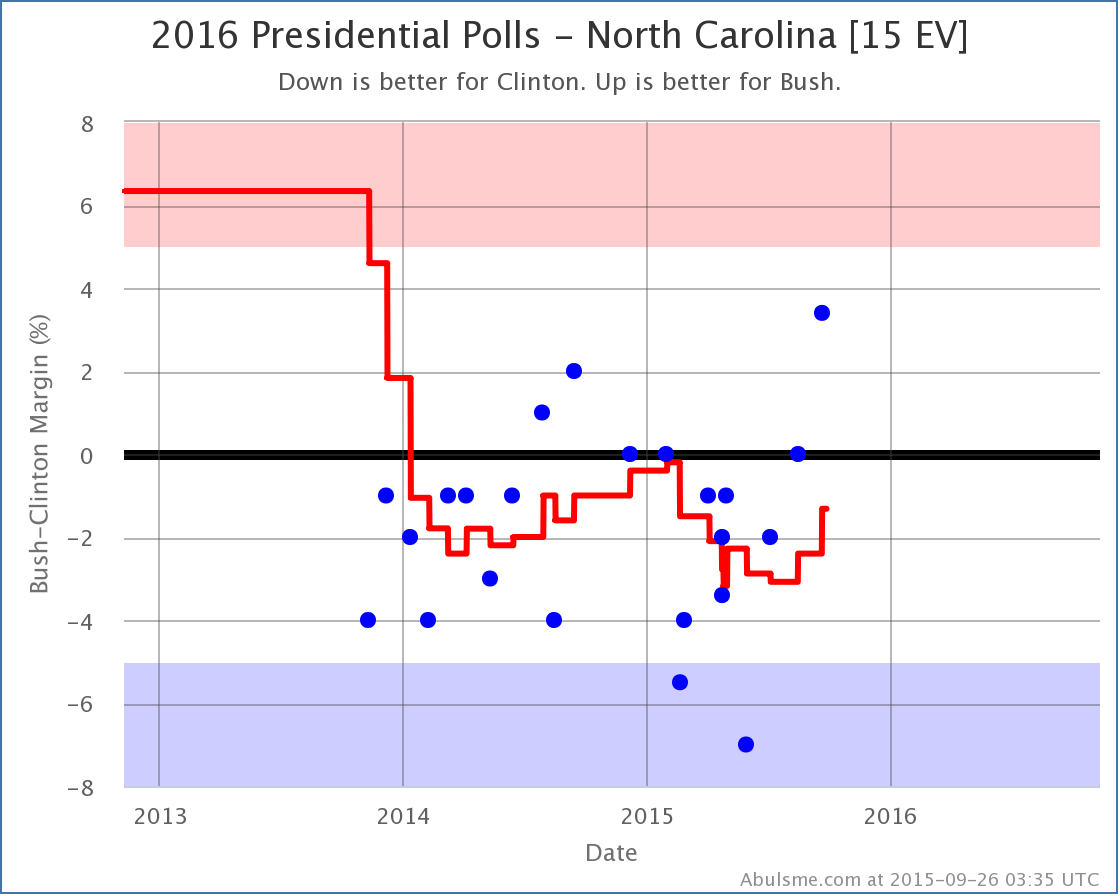
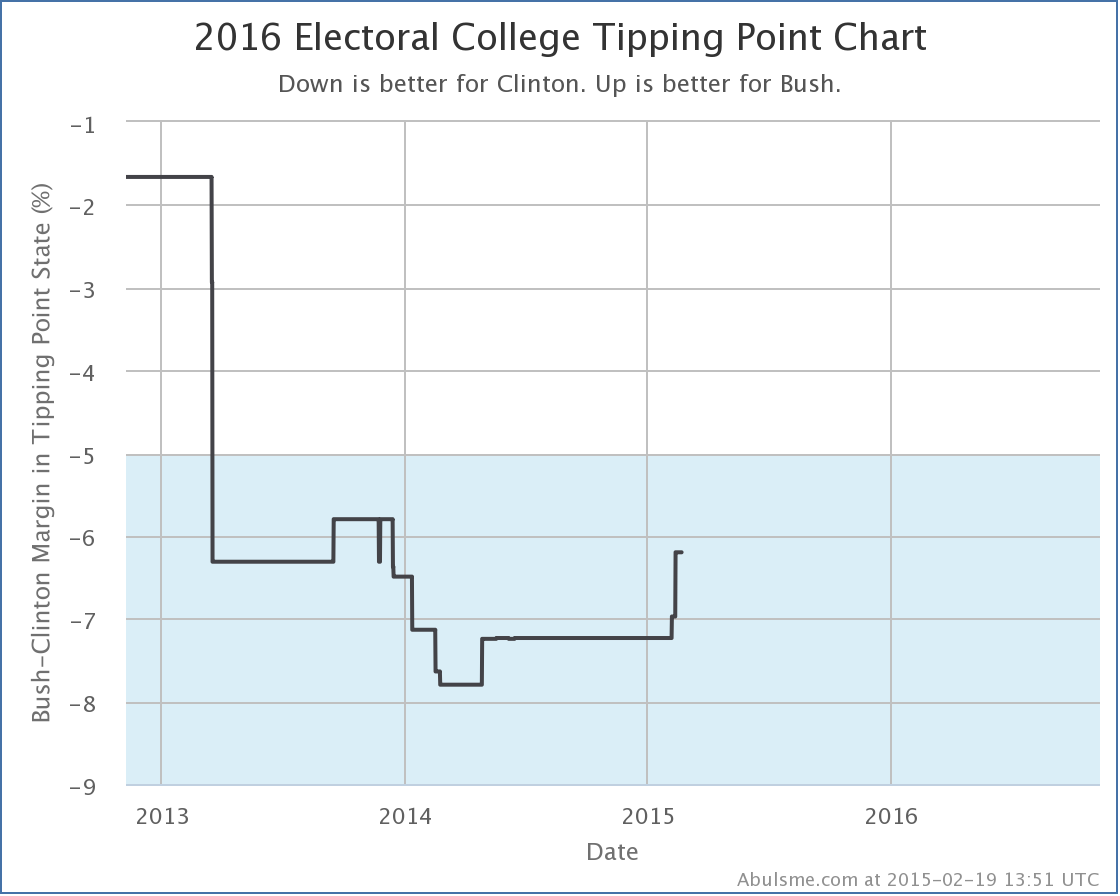
The new poll in North Carolina didn’t shift move the state to a new category, but the move from a Clinton lead of 2.4% down to a Clinton lead of 1.3% moved the tipping point, which had been North Carolina. With North Carolina shifting Bushward, the tipping point becomes Colorado, where Clinton is ahead by 2.2%.
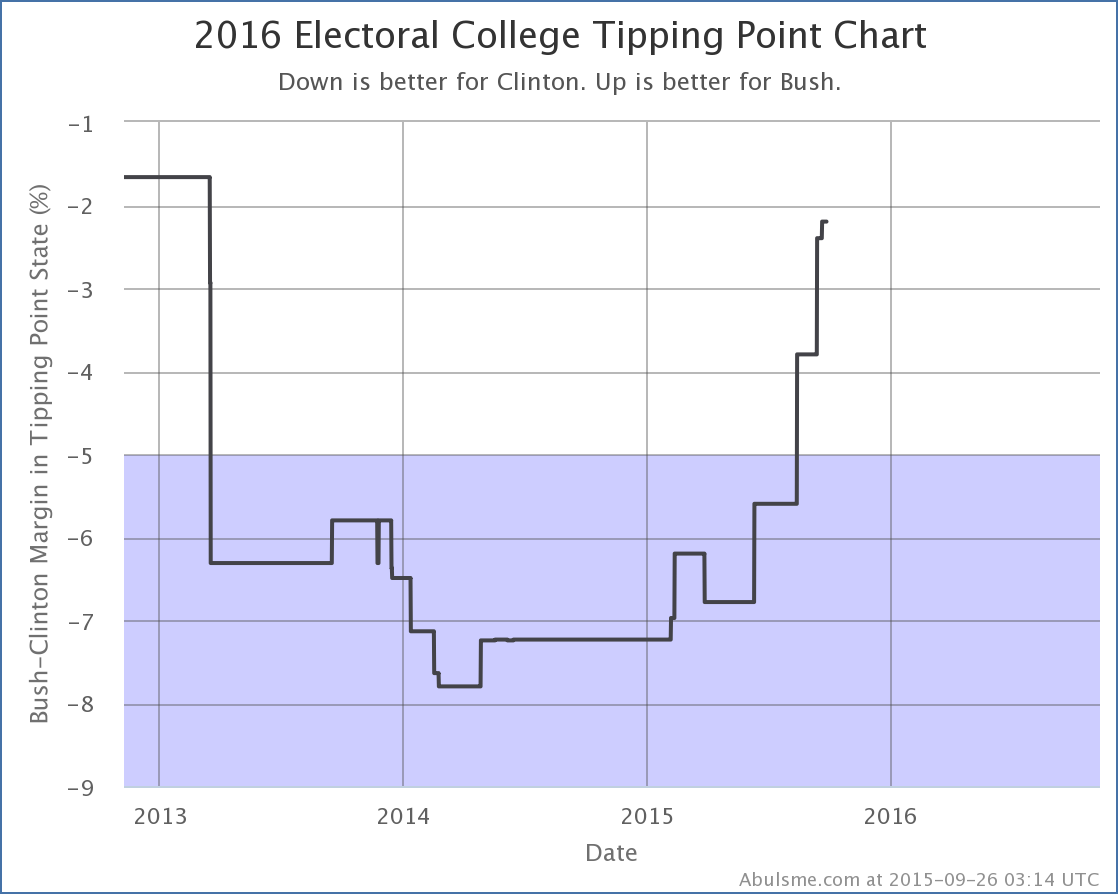
This is a relatively small blip upward for the tipping point, but it continues the trend. This race just keeps getting closer. Remember, the tipping point is how far polls have to move nation wide in order to flip the result of the election. The gap is now only 2.2%. That is tiny. A 2.2% lead can disappear over night, or be an illusion cased by a bias in the polls. Right now, Bush and Clinton are effectively neck and neck. Yes, Clinton has a lead, but it is extremely narrow.
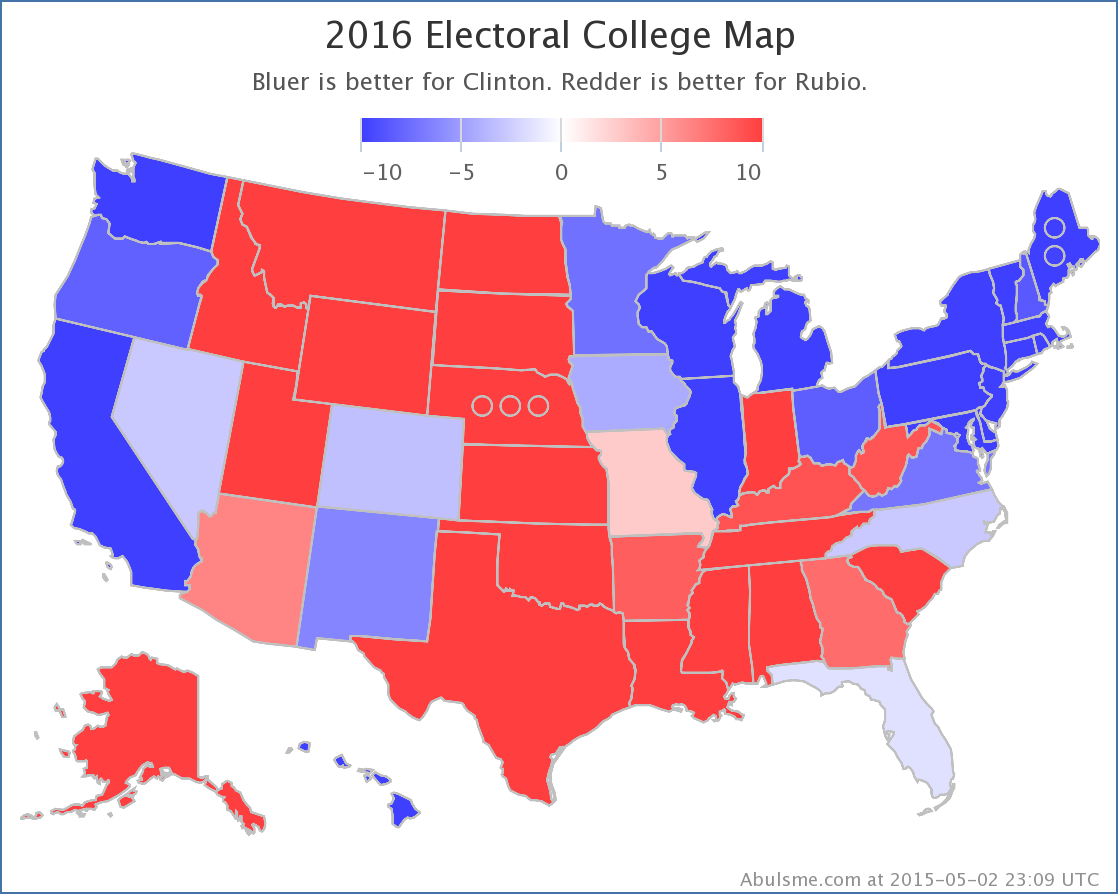
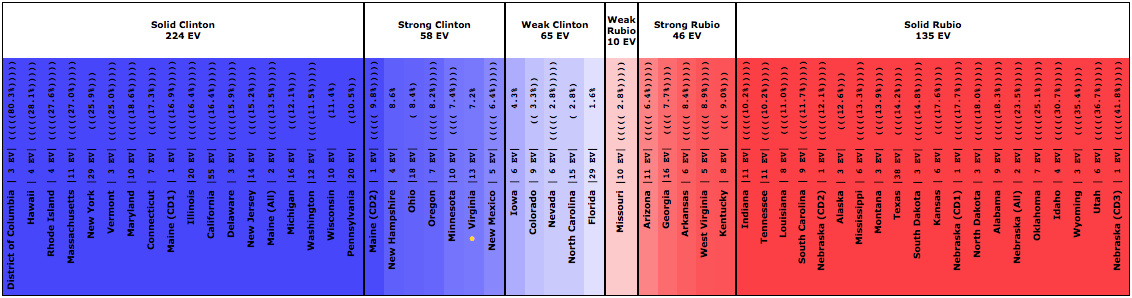
The spectrum of the states now looks like this:
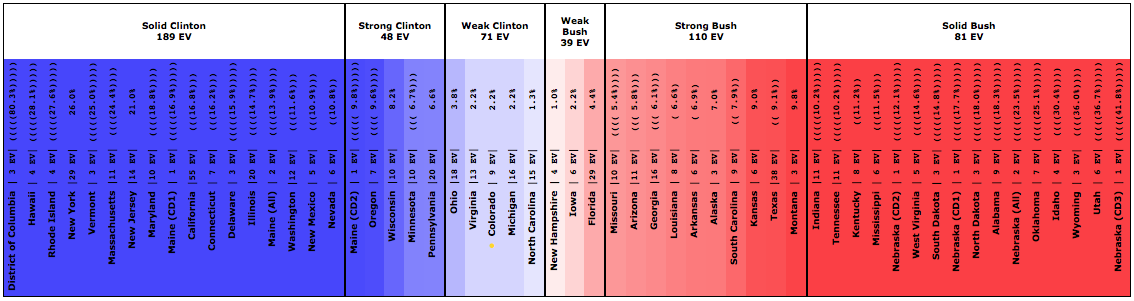
Clinton’s buffer is down to just Colorado, Michigan and North Carolina, all states where her lead is less than 2.2%. We’re only a few Republican leaning polls in those three states away from having a Republican in the lead for the first time since I launched this site.
Clinton vs Walker
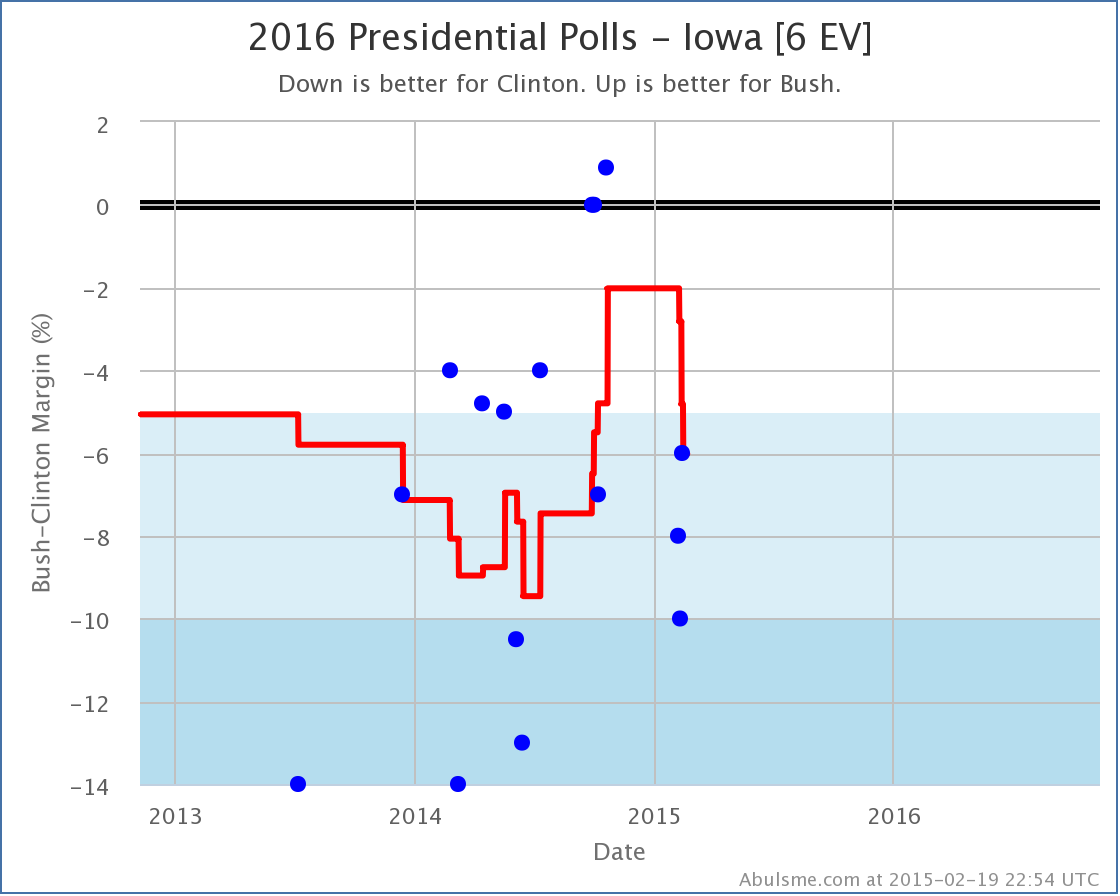
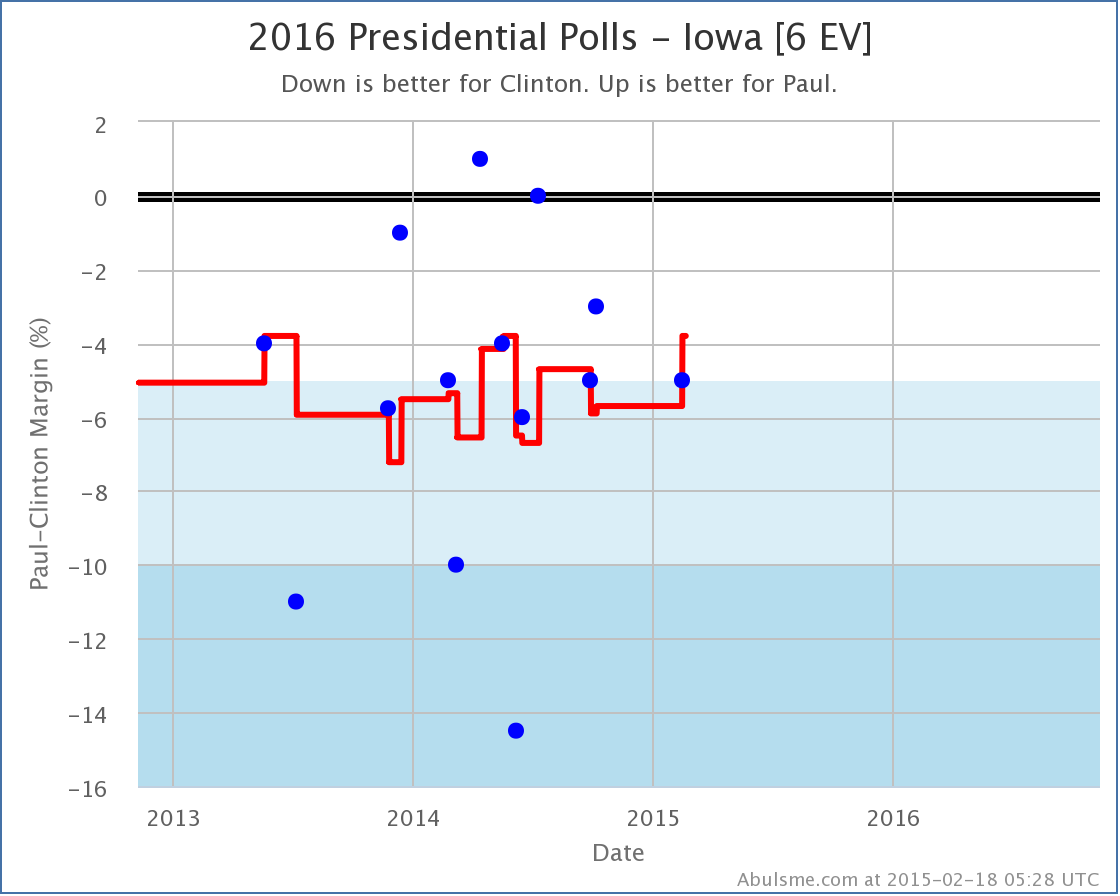
Well, he dropped out. But a poll in Iowa that included him wrapped up just before his announcement. And that poll was good for Walker. So, one last hurrah…
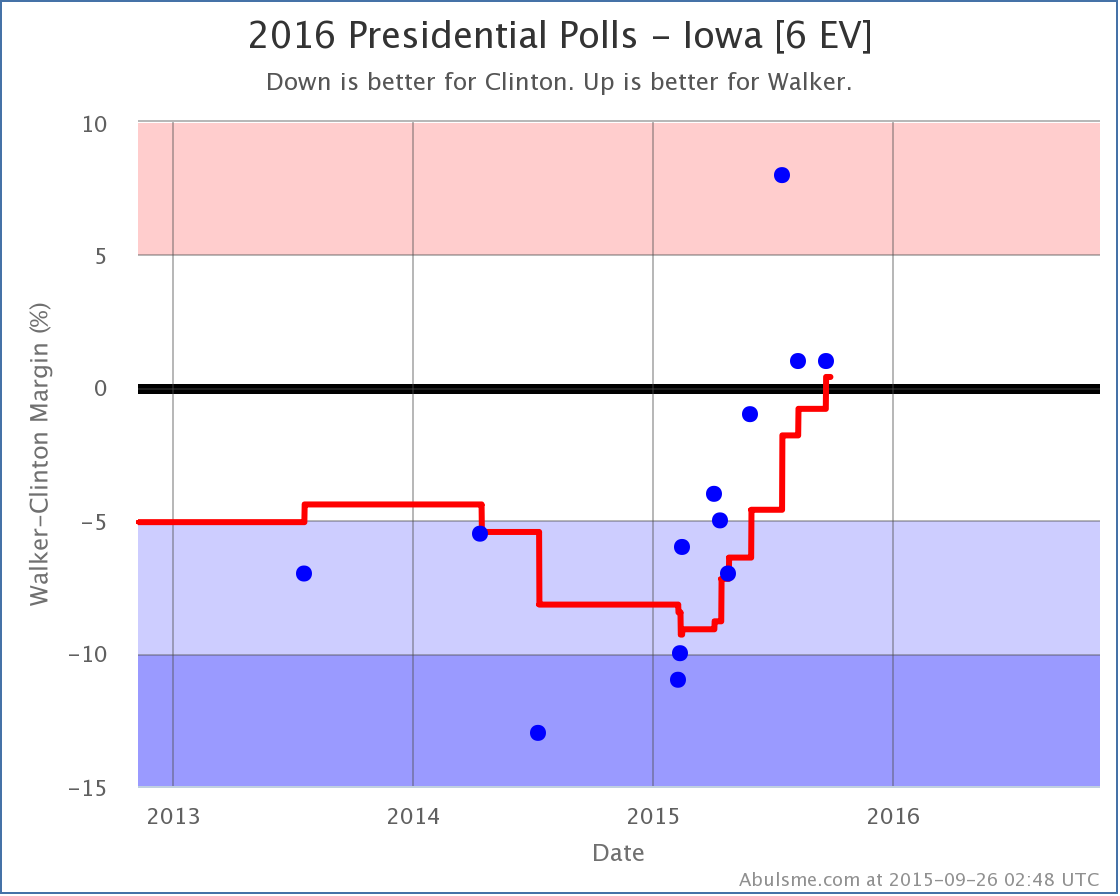
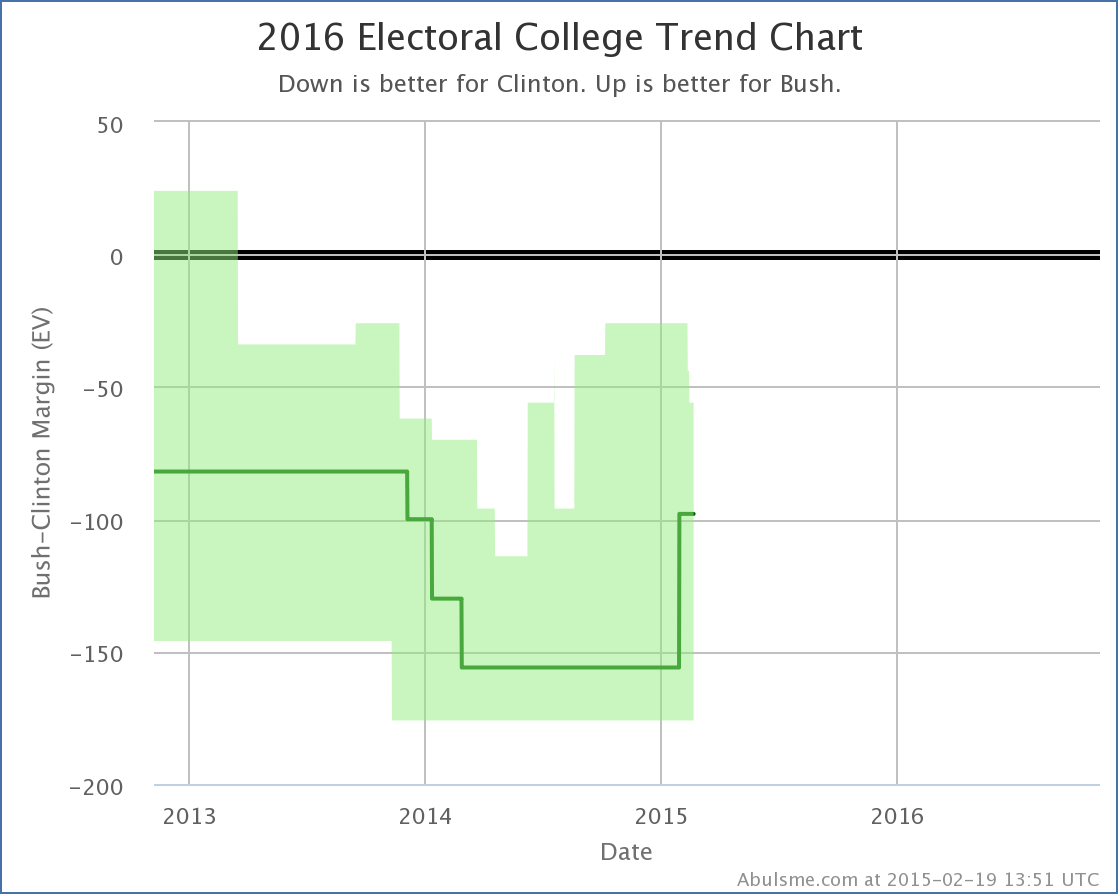
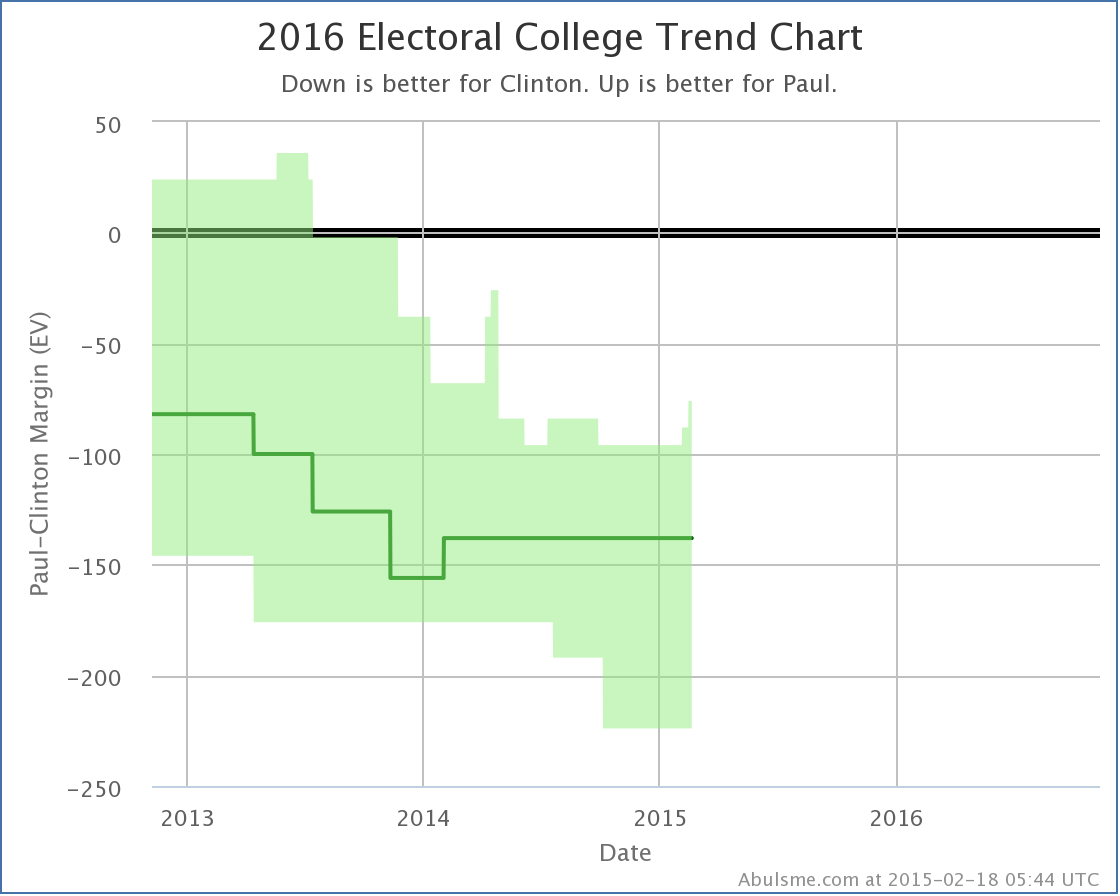
With this last poll… and it will be surprising if there are any more with Walker… Walker takes a narrow lead vs Clinton, and so moved Iowa into his column, increasing his “expected” result against Clinton…
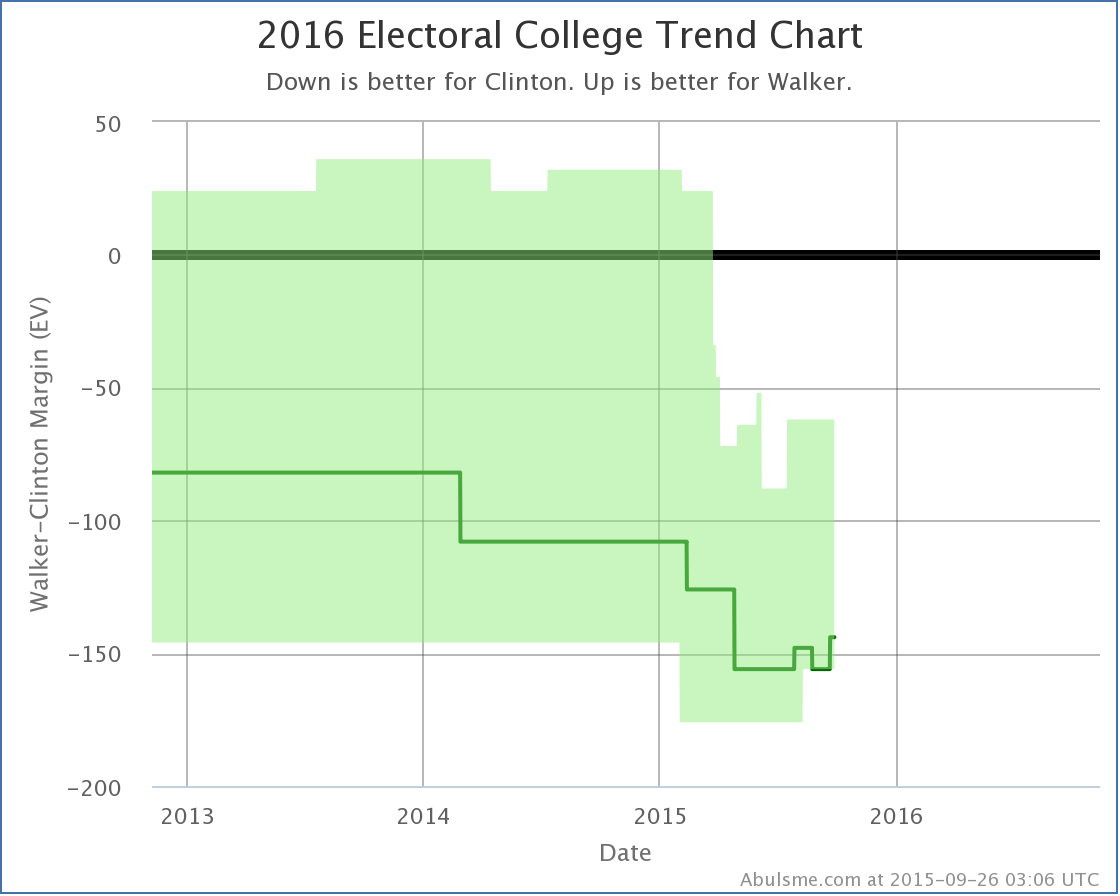
He increases his expected result to… losing by 144 electoral votes! Well, OK, Walker wasn’t the most competitive of the Republican candidates against Clinton.
Goodbye Walker.
409.8 days until polls start to close.
Note: This post is an update based on the data on ElectionGraphs.com. All of the charts and graphs seen here are from that site. Graphs, charts and raw data can be found there for the race nationally and in each state for every candidate combination that has been polled at the state level. In addition, comparisons of the best polled candidate combinations both nationally and each in each state are available. All charts above are clickable to go to the current version of the detail page the chart is from, which may contain more up to date information than the snapshots on this page, which were current as of the time of this post. Follow @ElecCollPolls on Twitter for specific poll details as I add them.
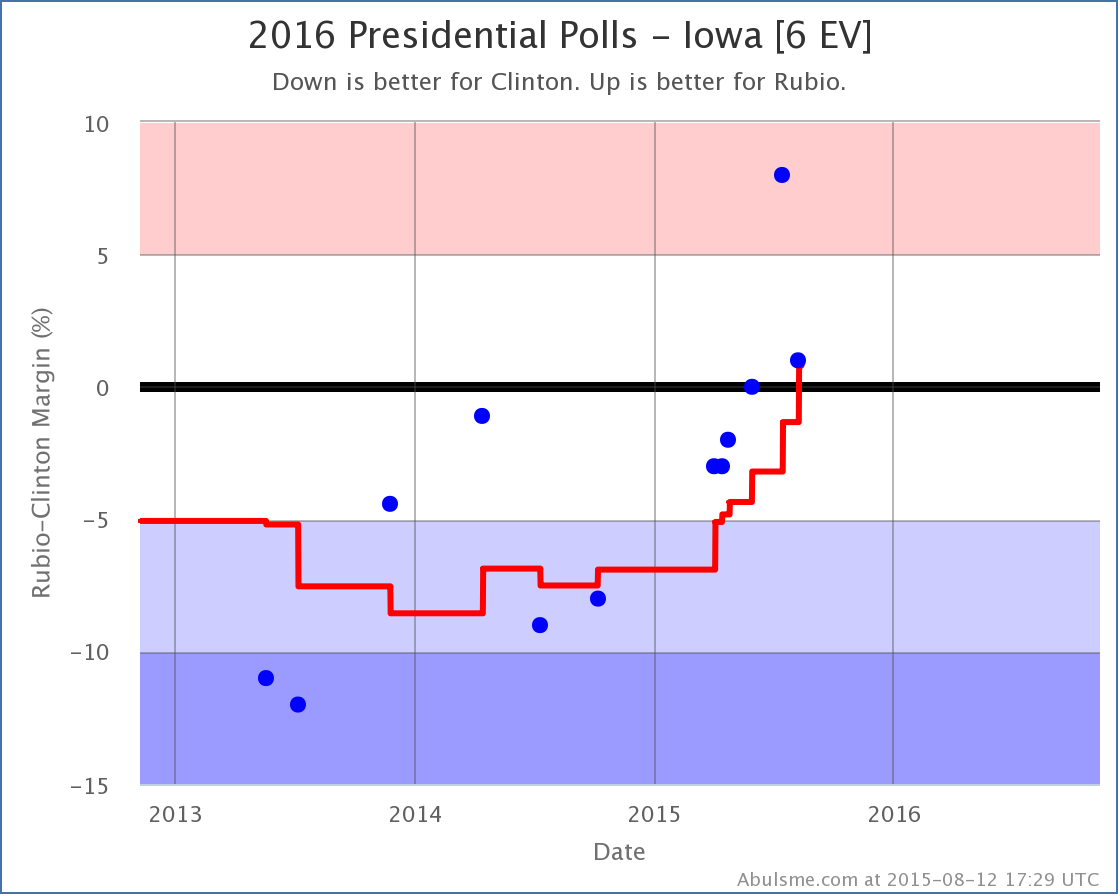
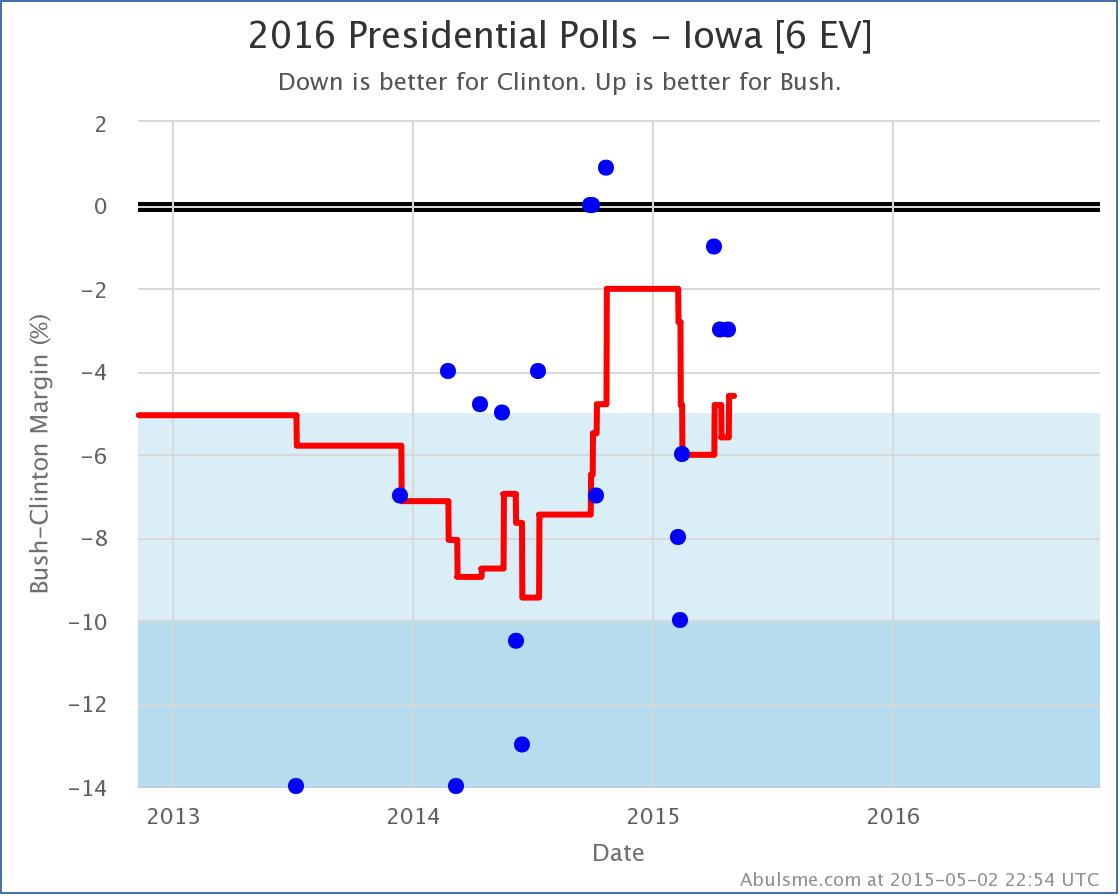
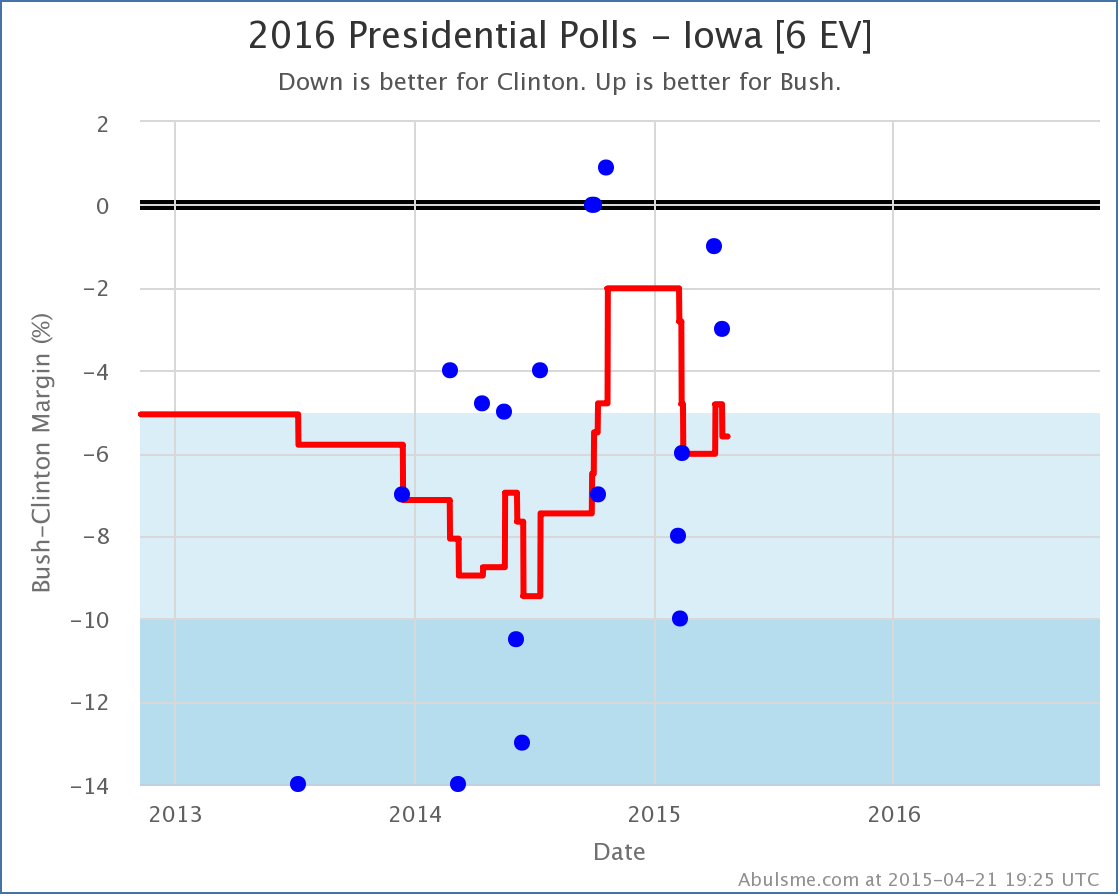
Well, last time I noted the “First good news for Clinton in months!“. I mentioned then that one data point does not make a trend. And today, with the next change worth noting to the five best polled candidate combinations, we indeed don’t get more good news for Clinton. Instead, this time we get Iowa flipping to Bush:
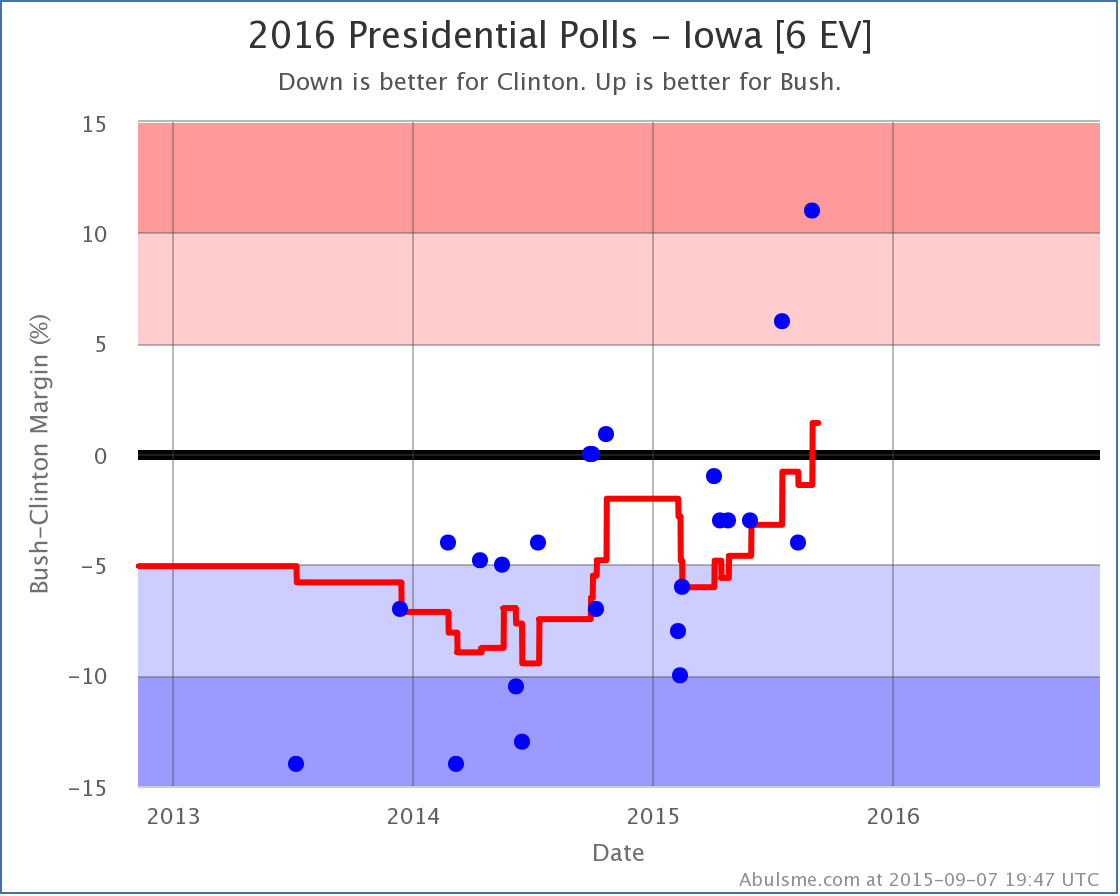
Only two of the last five polls in Iowa show a Bush lead, but they both show big leads. When averaged out, you have a 1.4% Bush margin… and a trend which has been moving away from Clinton since February. If the moves toward Hillary in New Hampshire mentioned in that last post were the start of any bottoming out for Clinton, there is no evidence of it here in Iowa. Indeed, if anything, the trend away from Clinton seems to be accelerating.
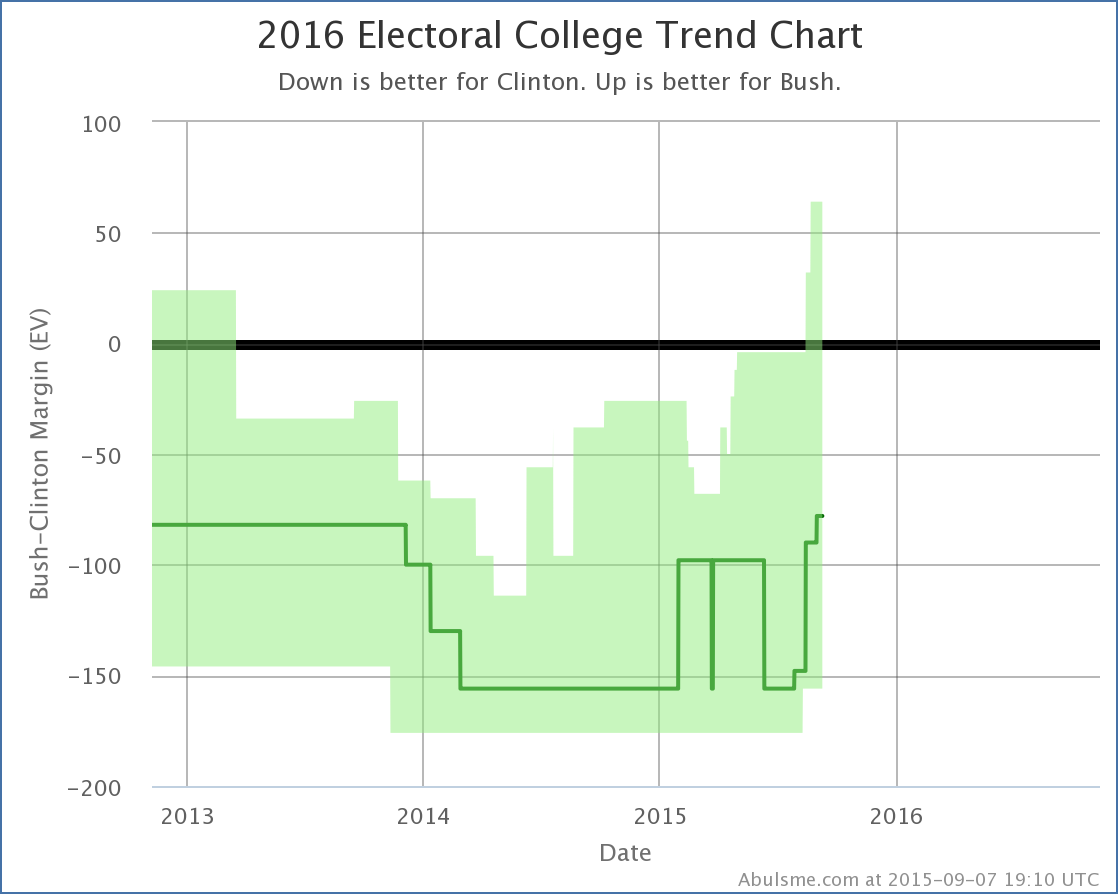
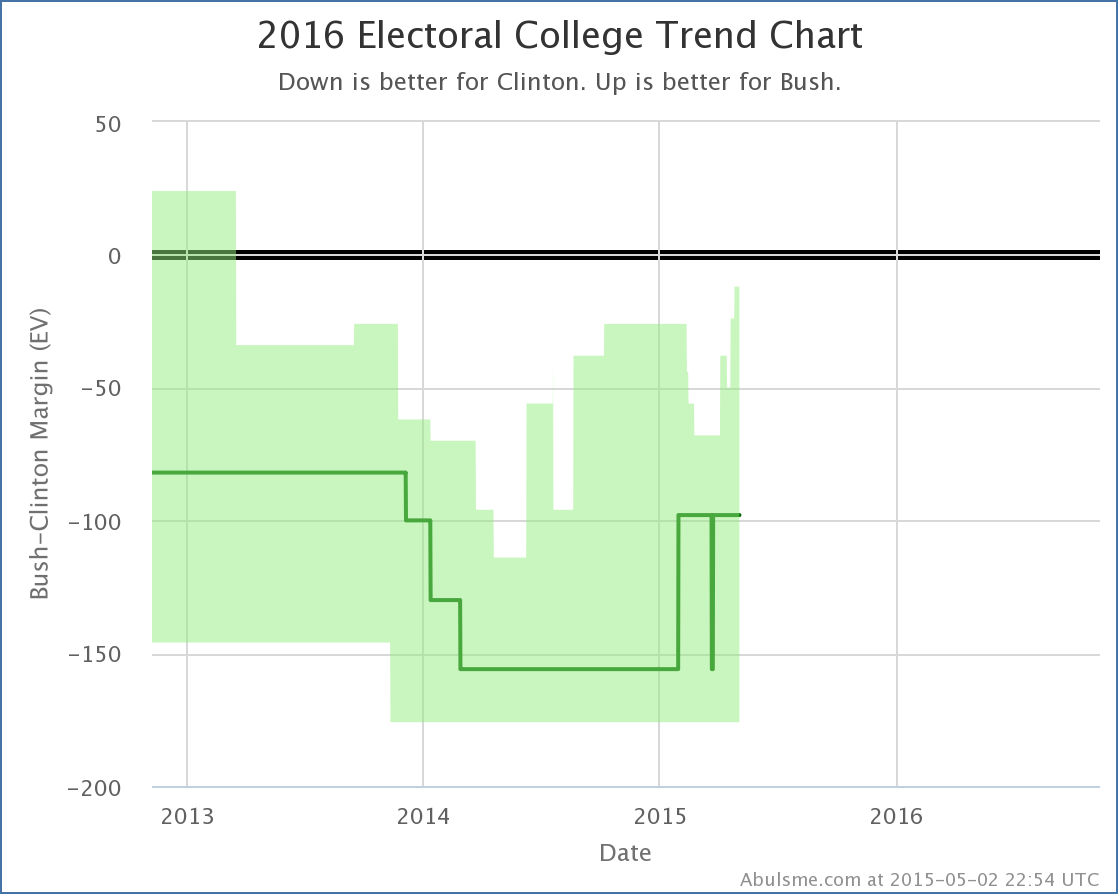
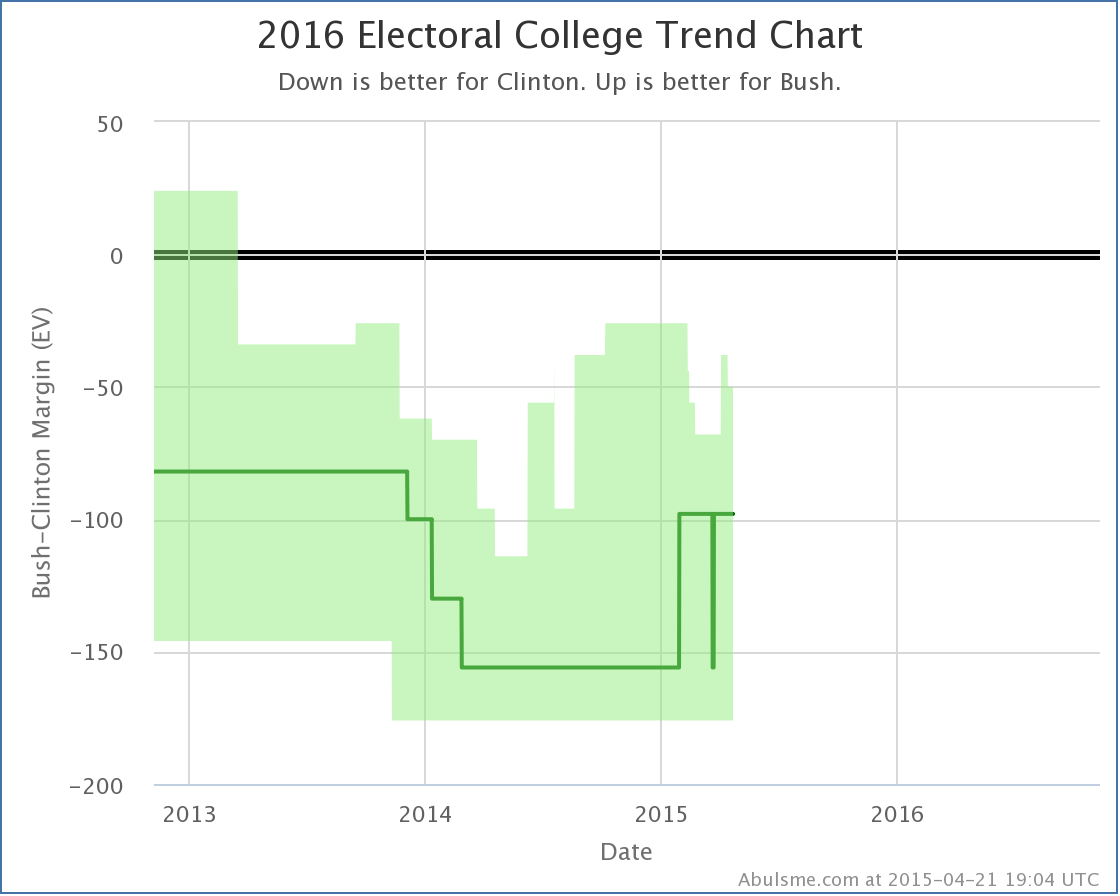
In the national Bush vs Clinton view, Bush is now losing by 78 electoral votes in the “expected” case where each candidate wins every state where they lead the poll averages. Yes, this is still a loss, but it is better than Bush has done in this matchup since the start of polling for 2016.
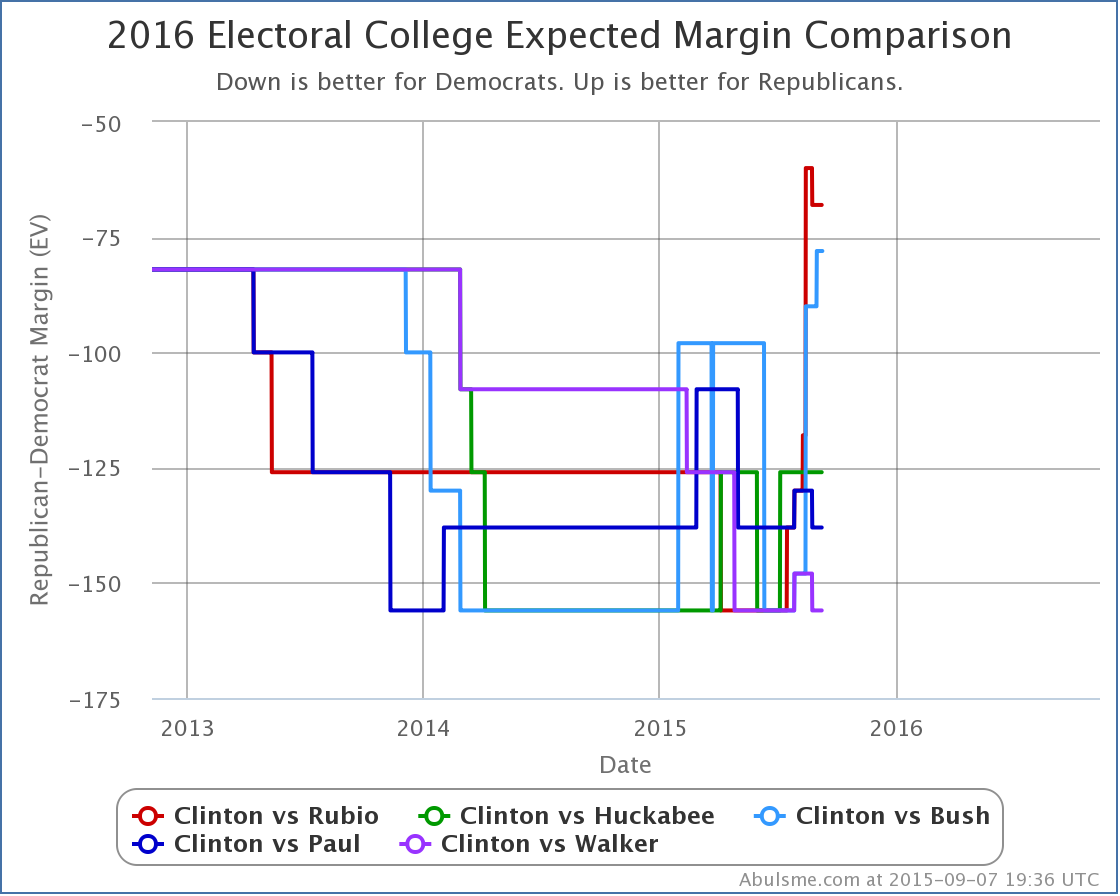
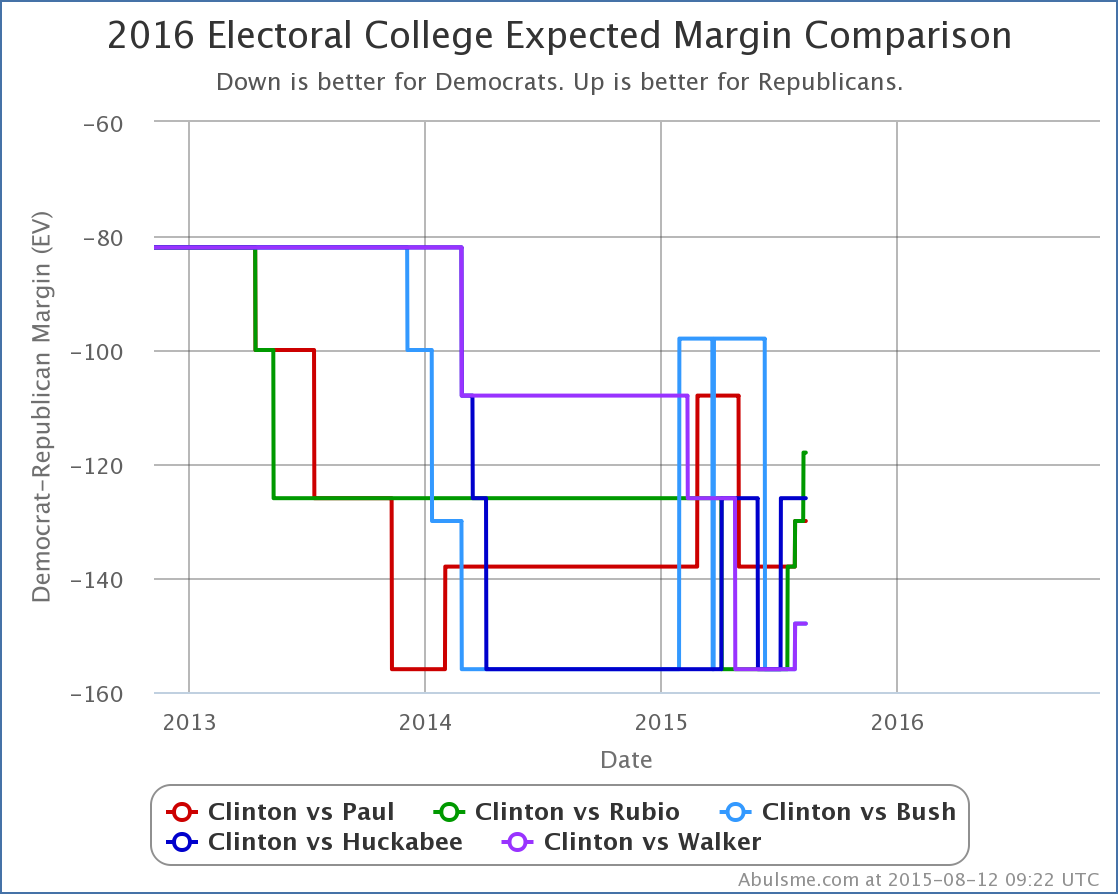
Looking at how Bush is doing compared to the rest of the best polled Republicans, Rubio is still doing better against Clinton, but Bush isn’t far behind. Huckabee, Paul and Walker’s margins against Clinton are significantly worse. In this particular view, they aren’t really gaining on Clinton at all. This doesn’t give the full picture though, as a quick look at the tipping point shows:
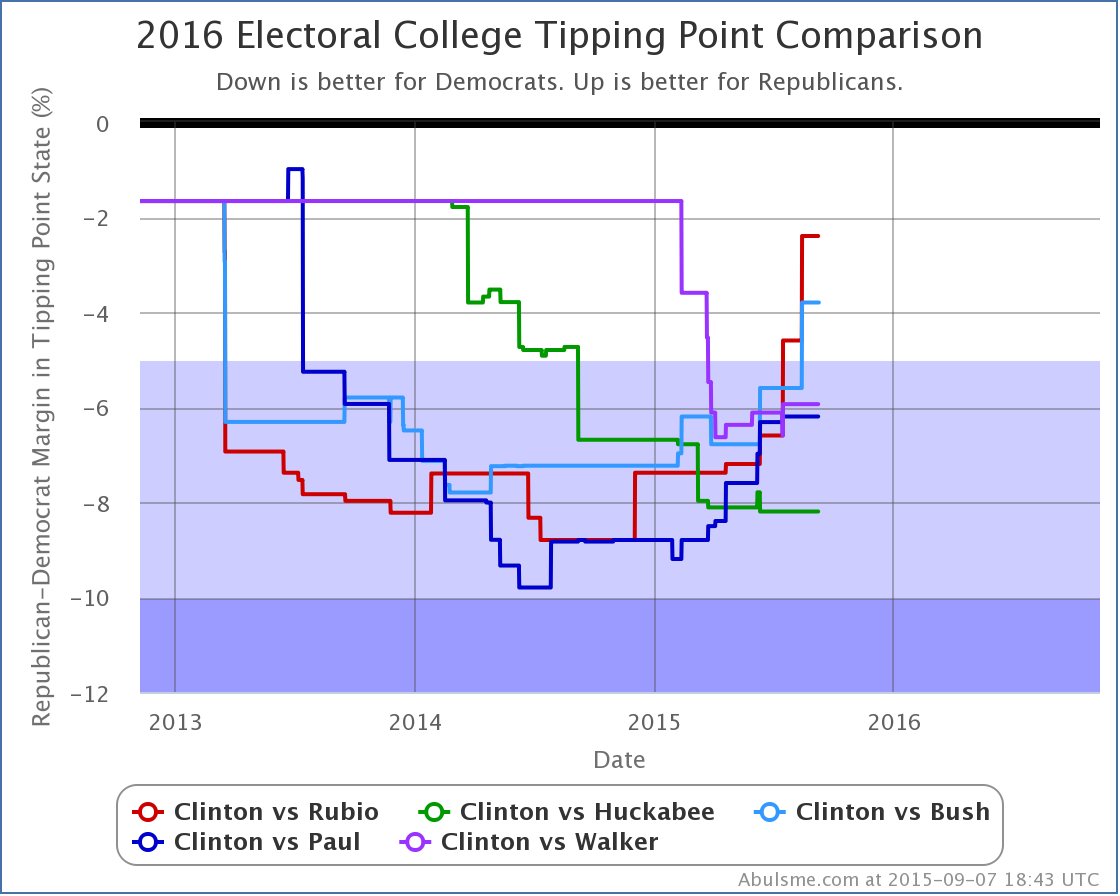
Bottom line, despite the move in her direction last time, the overall trends continue to be against Clinton. When and if this deterioration stops, and how that affects the primary races, is the big question of the campaign at the moment.
428.1 days until the first general election polls close.
Note: This post is an update based on the data on ElectionGraphs.com. All of the charts and graphs seen here are from that site. Graphs, charts and raw data can be found there for the race nationally and in each state for every candidate combination that has been polled at the state level. In addition, comparisons of the best polled candidate combinations both nationally and each in each state are available. All charts above are clickable to go to the current version of the detail page the chart is from, which may contain more up to date information than the snapshots on this page, which were current as of the time of this post. Follow @ElecCollPolls on Twitter for specific poll details as I add them.
Two sets of changes worth noting today triggered by new PPP polls in Iowa and Missouri. The streak of changes going against Clinton and in favor of the various Republicans continues. As I mentioned before, the last time one of my updates was unequivocally good news for Clinton was in May!
Iowa
The July Qunnipiac Poll showing Rubio with an 8% is looking kind of like an outlier, and without it we wouldn’t be quite there yet, but there has been a clear trend toward Rubio in the average going back a year. With the newest poll (plus that possible outlier) the average moves from “Weak Clinton” to “Weak Rubio”. This changes the “expected” result in this matchup:
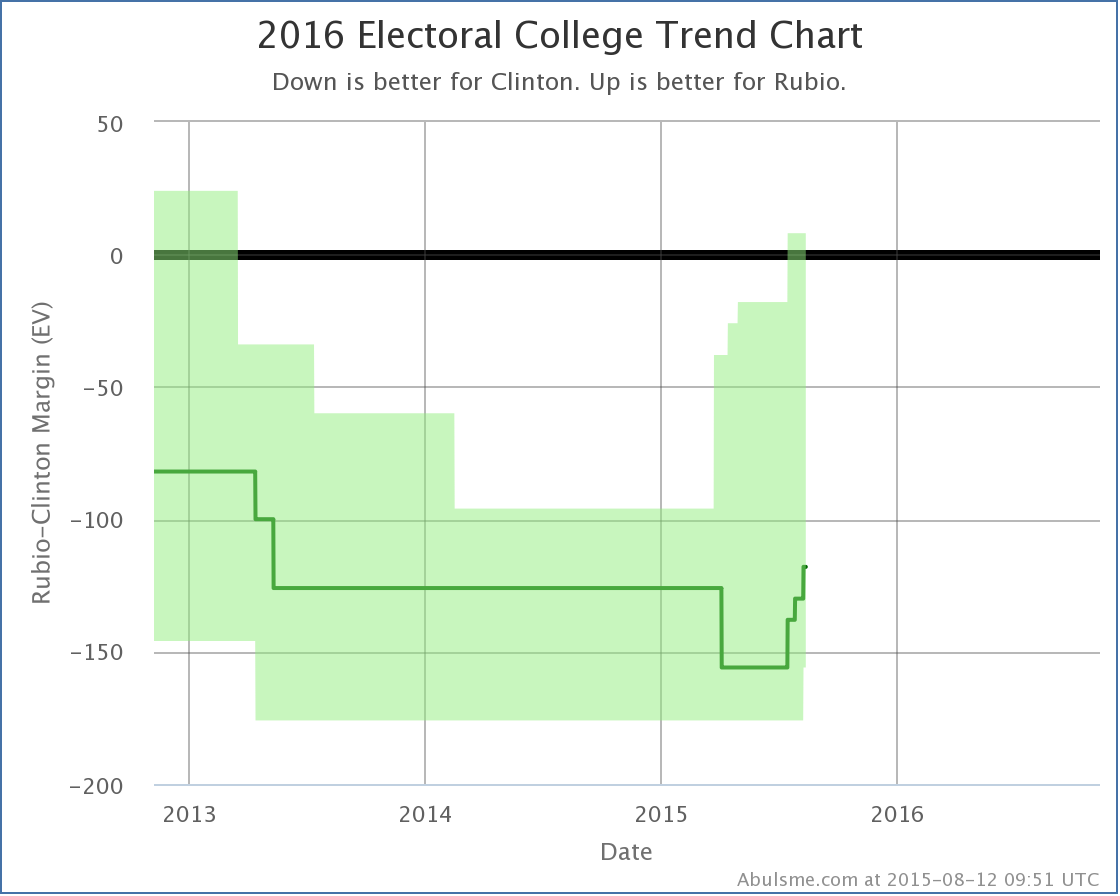
The expected result is now Clinton 328 to Rubio 210, which is a 118 electoral point loss by Rubio. Now, while this is still of course a significant loss, it is significant because it beats Romney’s 126 electoral vote loss against Obama in 2012. The last time one of the five best polled candidate combinations had the Republican outperforming Romney was back in June when Bush had pulled his expected loss down to only 98 electoral votes.
While there has been a general drumbeat of bad news for Clinton in my updates for the last three months, this particular chart doesn’t yet show an clear and indisputable breakout move beyond the range where these candidates have been bouncing around. If you only look at the changes since June, it starts to look like a trend though, and given the movement in other metrics, it is still reasonable to interpret this as a bad trend for Clinton.
The question though will be if the Republicans can start an actual breakout move where instead of talking about how it looks like they might beat Romney, we start talking about how it looks like they might beat Clinton. We aren’t close to that yet.
One thing people have been speculating about has been if the prominence of Trump on the Republican side right now is actually harming the party overall, specifically in terms of the ability of the other candidates to compete against Clinton. So far, there is no evidence for that at all in the numbers we track here.
Missouri
When I officially launched the election tracking site and posted my first analysis for 2016 I mentioned that if you looked at the average results for the last five general elections… the data I used to “seed” the analysis before there were actual state polls… there were only SIX states where the average margin in these five elections was less than 5%. They were Nevada (Dem+2.8%), Ohio (Dem+1.7%), Florida (Dem+0.9%), Colorado (Rep+0.0%), Virginia (Rep+1.6%) and Missouri (Rep+2.8%). All of these states were polled long ago, some many times… except Missouri. Today’s PPP poll is the first 2016 polling for Missouri that I am aware of. So finally, we get a current view of the state.
Missouri was basically on this “Close State” list because Bill Clinton won the state by 6.3% in 1996, the oldest of the five elections I used for the initial average. Since then the Republicans won by 3.3%, 7.2%, 0.1%, and 9.4%. OK, that 0.1% in 2008 was really close. And the 3.3% in 2000 wasn’t a complete blow out. But in general it seems like the trend has been redder in Missouri.
The new poll tested Clinton against 11 different Republicans. She lost by between 7% and 15% depending on which Republican you looked at. (They also tested Sanders against 4 Republicans with similar results.)
Bottom line, looks like 2016 is looking a lot more like 2012 or 2004 than 2008 or 2000. That is, a pretty strongly Republican state. Now, it is just one poll, but the results are strong enough that the state immediately moved from “Weak Republican” to “Strong Republican” for all five of the best polled candidate combinations. (And actually for all the rest of the combinations they polled too.)
The chart of this isn’t actually all that interesting on a state level. But Missouri no longer being a close state means that Clinton’s “best case” against all five Republicans weakens a little bit, so lets have a quick look at that graph:
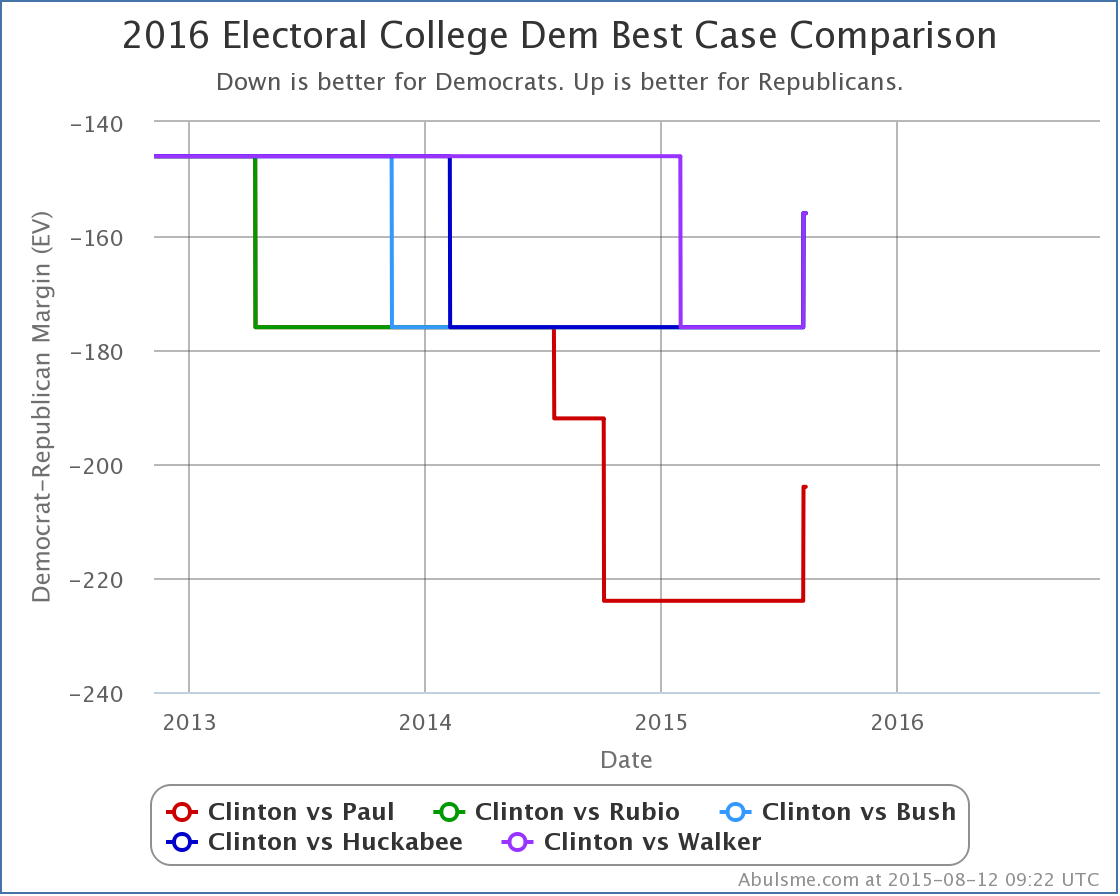
You don’t see a lot of volatility in this chart, simply because there are a lot fewer polls of the states that make a difference here. You see a lot of polls around the tipping point, and around the states that are really close, because they give insight into if the Republicans are catching up. Given the current state of Clinton’s lead, polling of the states Republicans are generally already ahead in only gives insight into how much extra Clinton could win by if everything possible went her way, which is fundamentally less interesting.
Never the less, with Missouri’s 10 electoral votes out of play at the moment, Clinton’s best case margin drops by 20 electoral votes against all these candidates. In the case where she wins all the states she is ahead in, plus all the states where the Republican currently leads by less than 5%, she now beats Paul by 204 electoral votes. Rubio, Bush, Huckabee and Walker get beaten by a more modest 156 electoral votes. These are of course pretty good margins in today’s polarized electorate. But to get to these kinds of numbers, just about everything would have to go Clinton’s way… which is not the trend today.
But of course, we have 454.2 days until the election. Lots can change in 454.2 days. :-)
Best Polled List
I should also mention that the “best polled” list got shuffled a bit with the latest updates. Clinton vs Paul once again grabs the “best polled” spot and becomes the default view on election2016.abulsme.com. Meanwhile Clinton vs Christie drops to 6th place and out of the group we highlight here, replaced by Clinton vs Huckabee returning to the top five after a short absence. Clinton vs Huckabee is just barely out of the top 5, but any other candidate combinations are far behind in terms of the volume and breadth of available polling on the state level at the moment. We’re currently giving the most attention here to Clinton vs Paul, Rubio, Bush, Huckabee and Walker.
Note: This post is an update based on the data on my 2016 Electoral College Analysis Site. All of the charts and graphs seen here are from that site. Graphs, charts and raw data can be found there for the race nationally and in each state for every candidate combination that has been polled at the state level. In addition, comparisons of the best polled candidate combinations both nationally and each in each state are available. All charts above are clickable to go to the current version of the detail page the chart is from, which may contain more up to date information than the snapshots on this page, which were current as of the time of this post. Follow @ElecCollPolls on Twitter for specific poll details as I add them.
With today’s batch of polls added, Clinton vs Paul goes back to being the “best polled” candidate combination by my metric and thus is again the default view on election2016.abulsme.com. No status changes on Clinton vs Paul though.
There were however two other status changes of note that I’ll highlight here. (There were status changes below the five best polled candidate combinations as well, see @ElecCollPolls for those, or for details of the specific polls added today.)
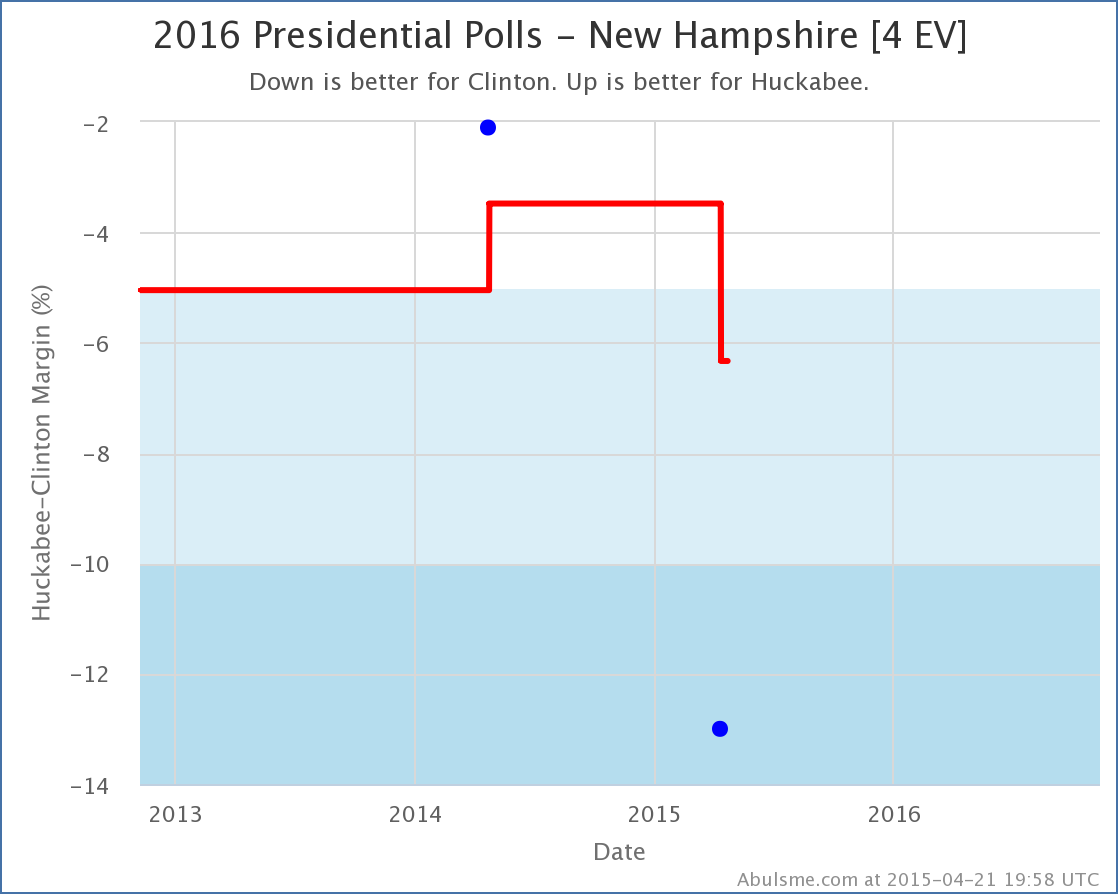
Clinton vs Huckabee
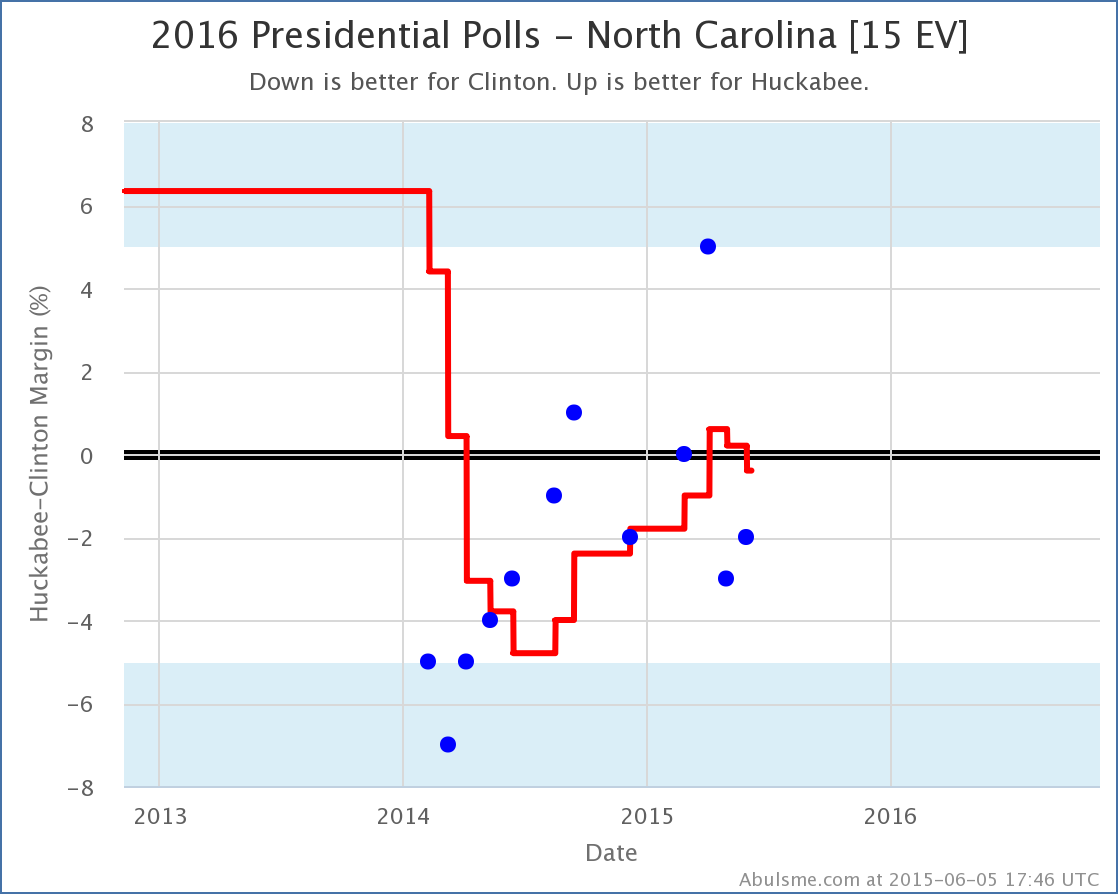
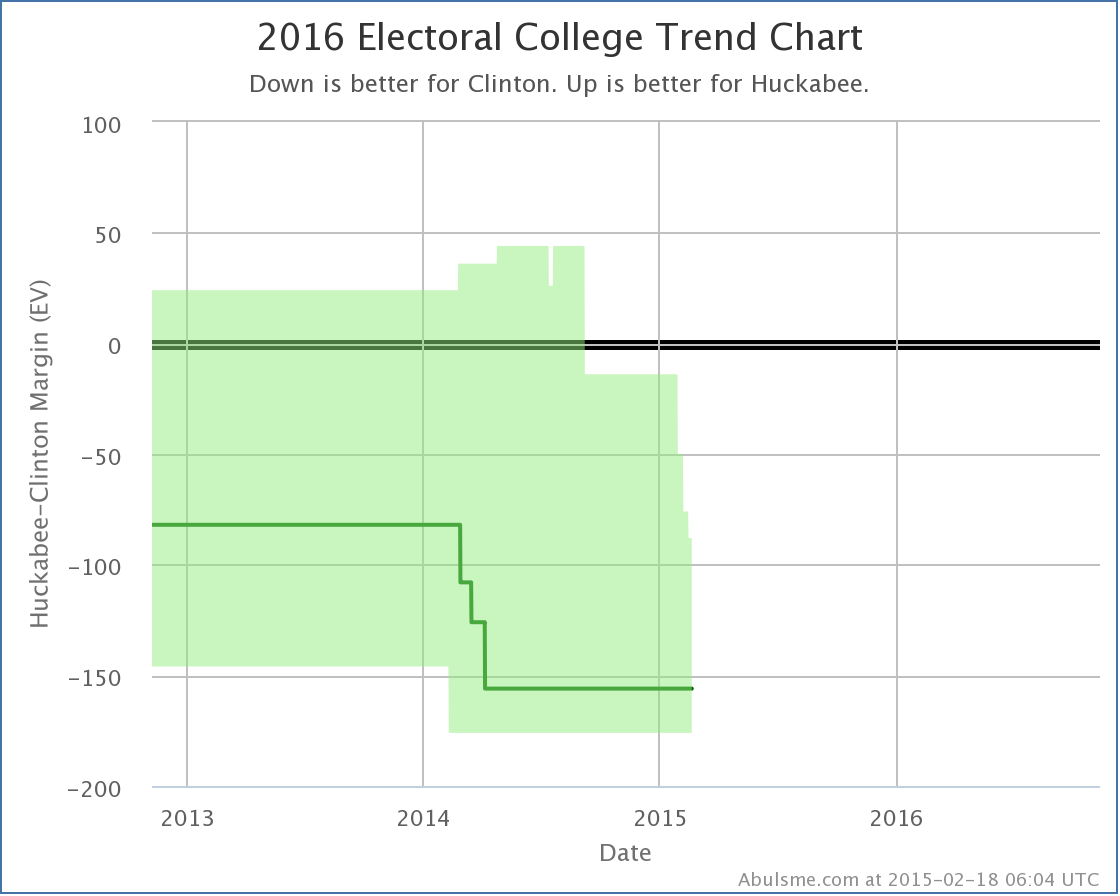
After a flirtation in April and May with actually leading Clinton in North Carolina, the state moves from just barely Huckabee, to just barely Clinton. Either way, North Carolina looks close in this matchup for the moment. This does however change the “expected” result in this match up in Clinton’s favor:
With this, the expected result… where each candidate wins all the states where they are currently ahead… returns to Huckabee losing by 156 electoral votes. (Specifically Clinton 347, Huckabee 191.) This has been the “expected” Clinton vs Huckabee result for most of the last year.
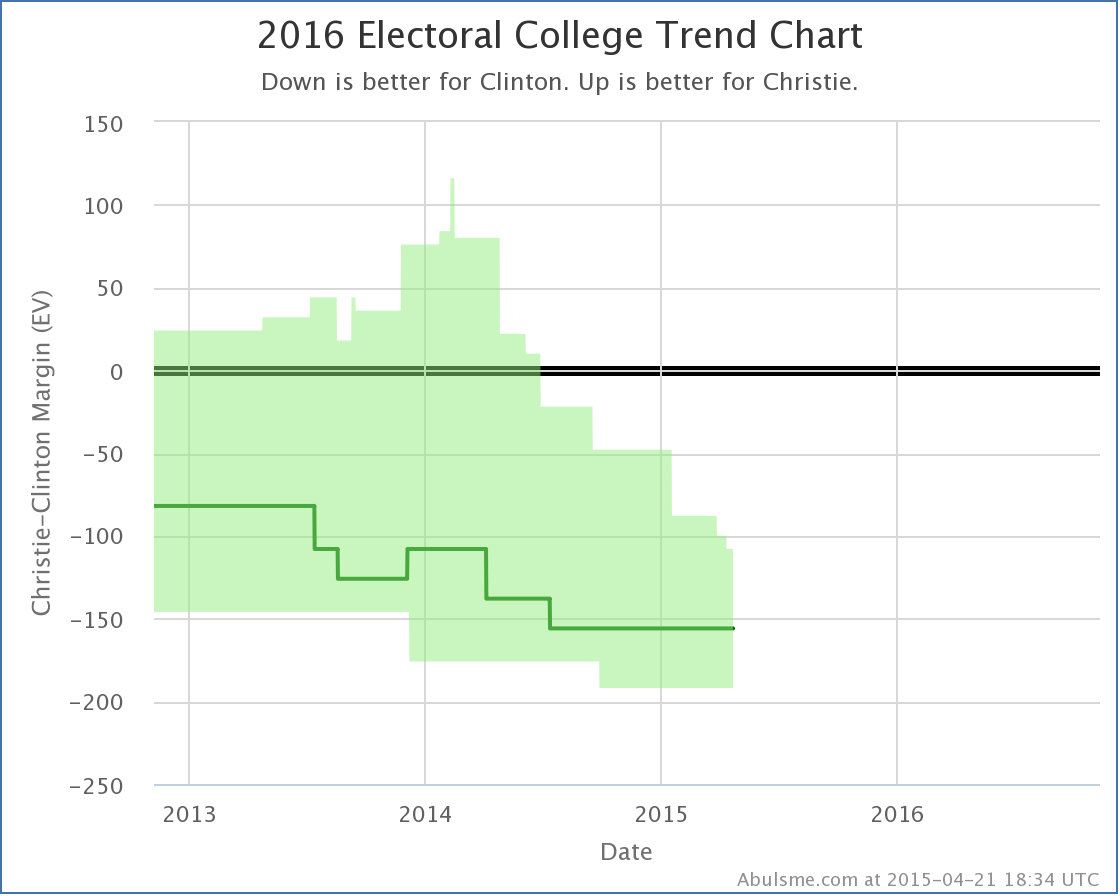
Clinton vs Christie
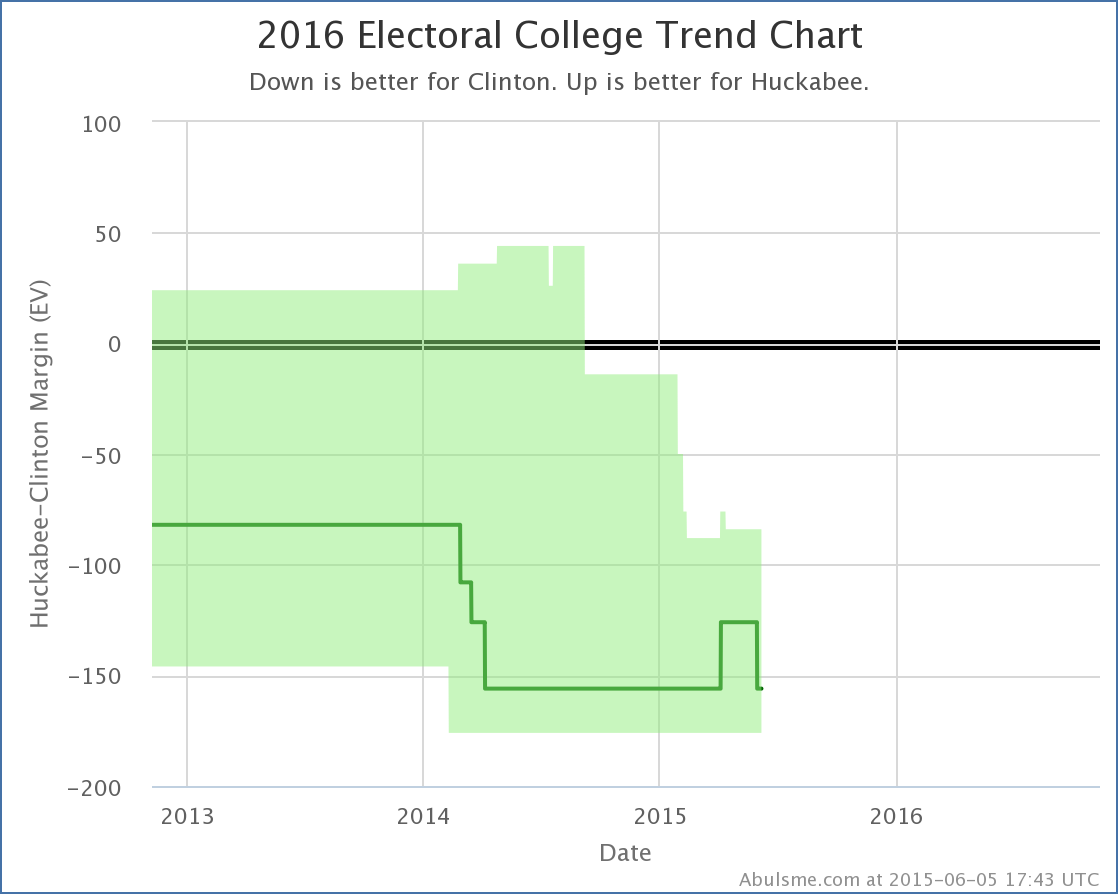
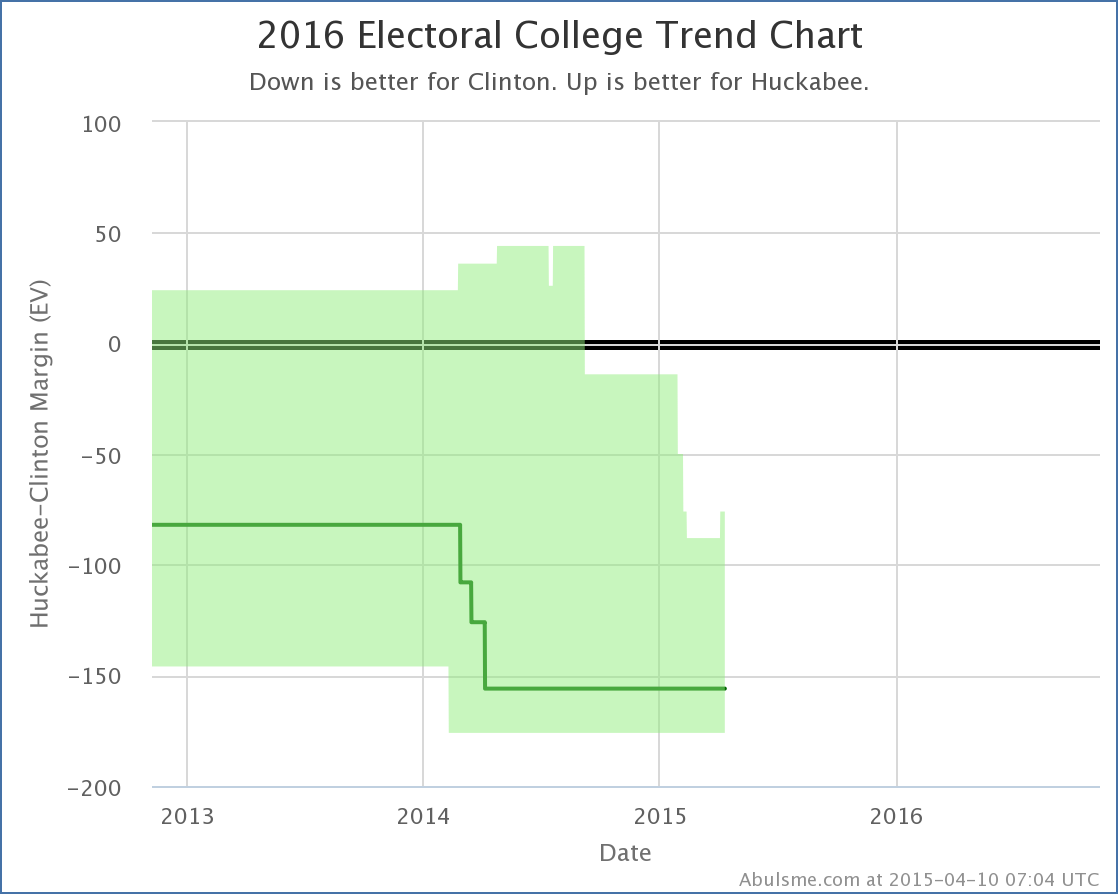
With the latest poll, the poll average for Clinton vs Christie in Iowa show’s Clinton’s lead below 5% for the first time since almost exactly a year ago. A 4.8% lead is still nothing to sneeze at, but it is close enough that we now allow for the possibility of Christie winning Iowa in our range of reasonably possible outcomes, so Christie’s “best case” improves:
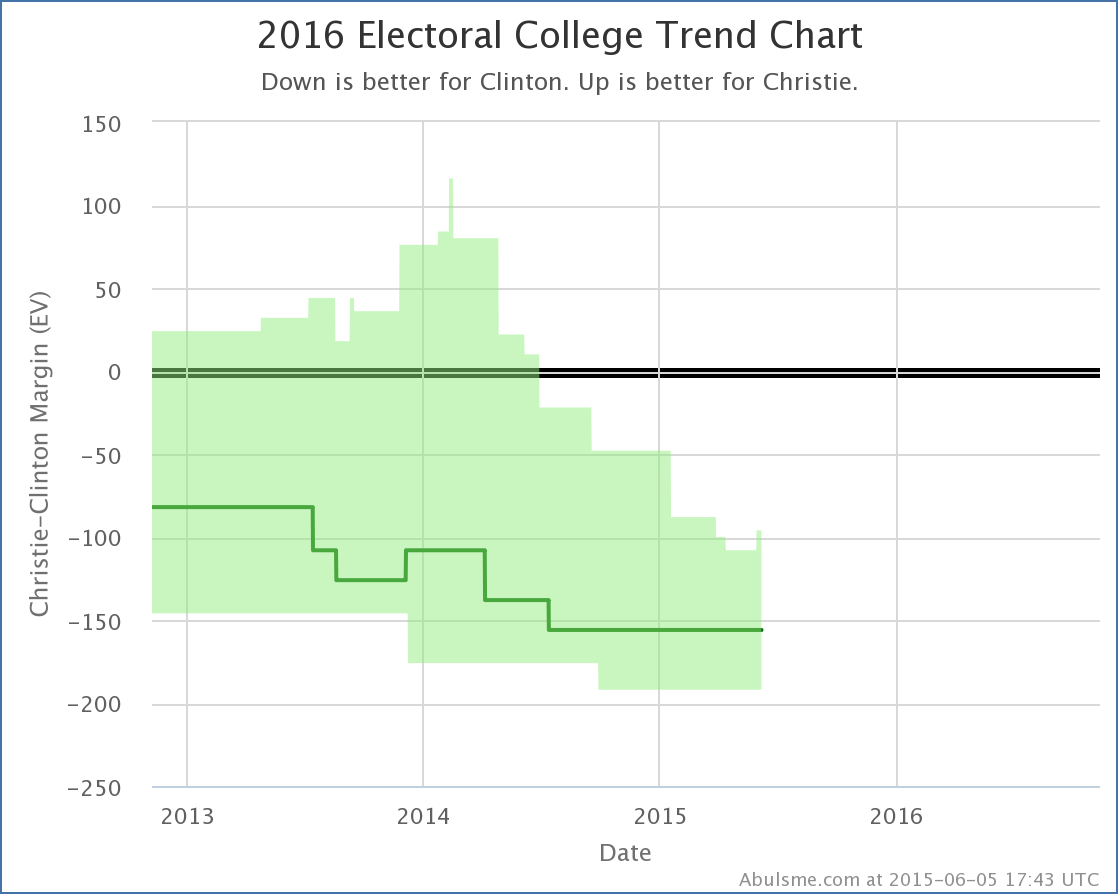
That bump in the top right of the green envelope is the improvement we’re talking about here. Christie’s best case is still a 96 electoral college loss to Clinton. Along with his tipping point improvement that I noted on Saturday though, this makes two moves in Christie’s direction in a week, so maybe there is some new momentum in his direction? Nah, probably not, right?
The Others
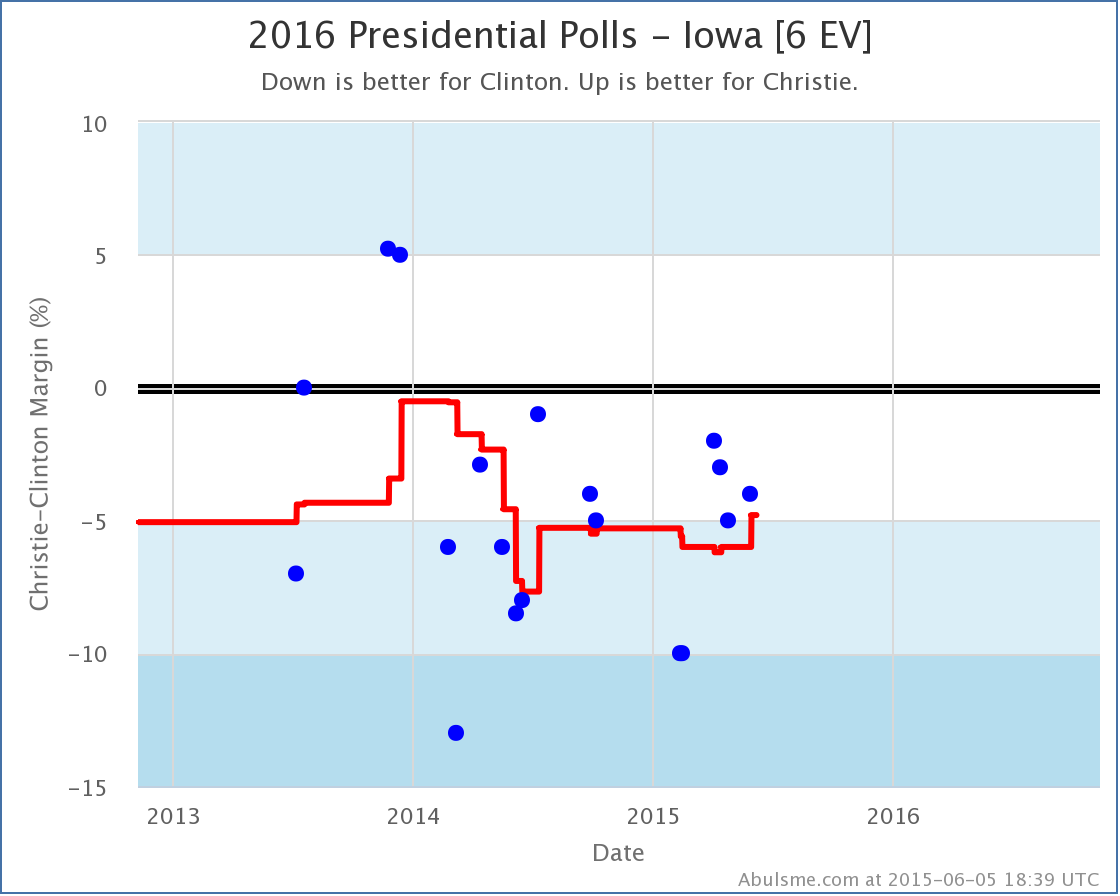
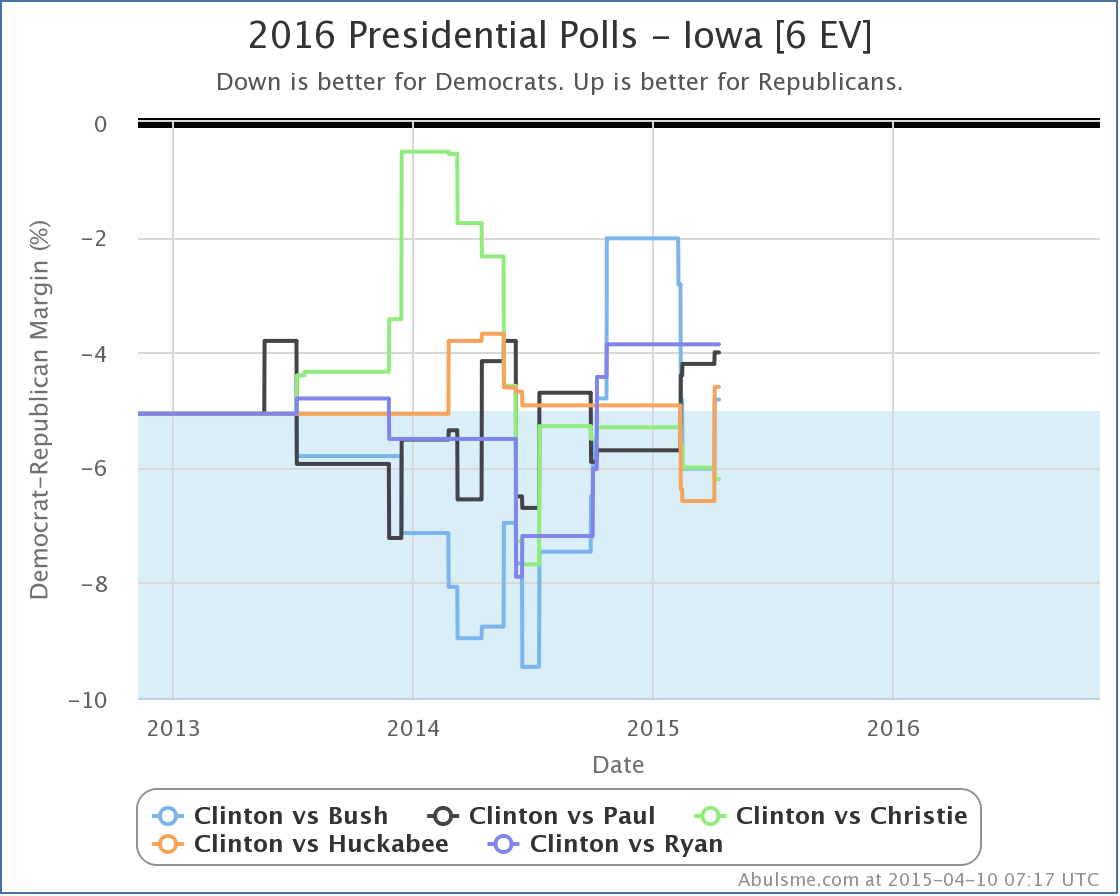
There may or may not be a specific move toward Christie, but lets look at the comparison chart in Iowa for all five of the “best polled” candidate combinations…
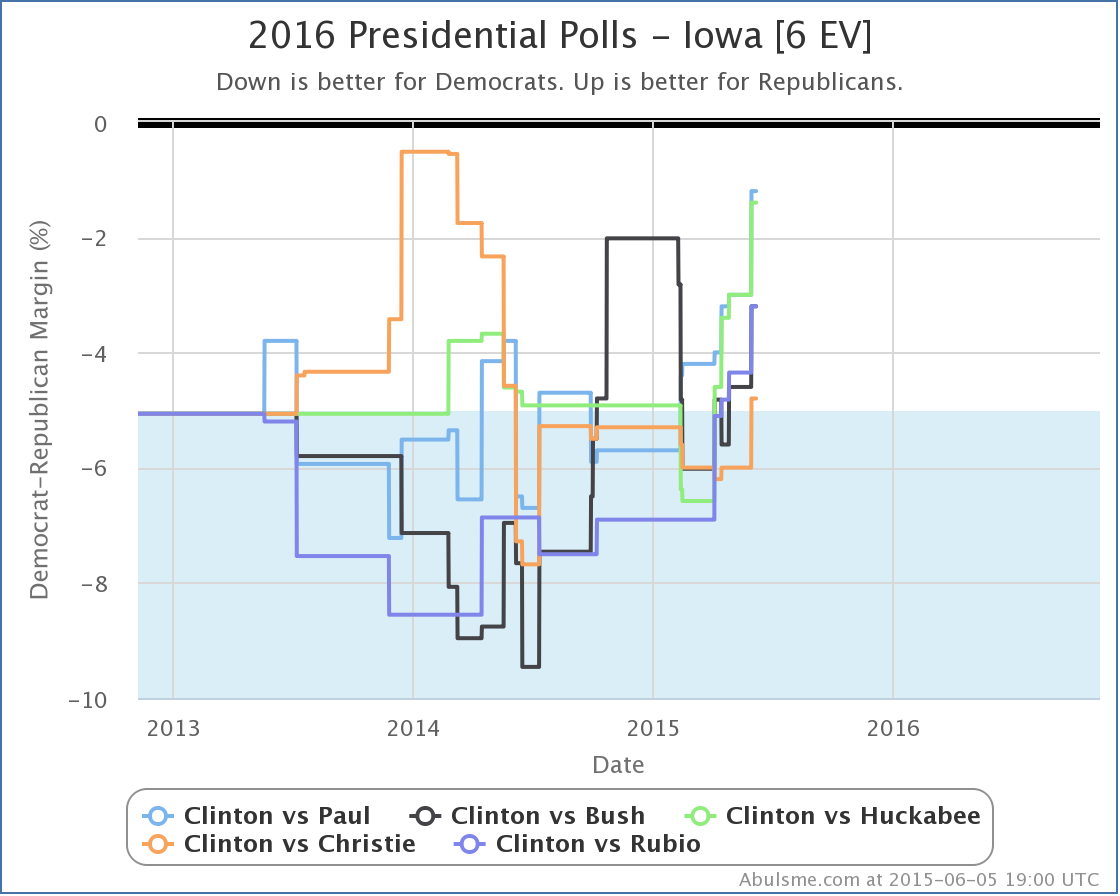
Hmm, definitely looks like some movement there in the last couple months.
Clinton’s lead seems to be evaporating in Iowa vs all five of these Republican challengers. But isn’t she spending all sorts of time in Iowa right now? Of course, Iowa gets attention due to the caucus of course, not an much for the general election, but still. This isn’t a good trend for Clinton.
There is no clear move like this on any of my national trend lines yet, but those take some time to move given that you need polling from a lot of states. But Iowa is one of the most polled states, so this could be a warning sign for Clinton’s broader situation.
522 days until the polls start closing. Plenty of time for drama and movement. Stay tuned!
Note: This post is an update based on the data on my 2016 Electoral College Analysis Site. All of the charts and graphs seen here are from that site. Graphs, charts and raw data can be found there for the race nationally and in each state for every candidate combination that has been polled at the state level. In addition, comparisons of the best polled candidate combinations both nationally and each in each state are available. All charts above are clickable to go to the current version of the detail page the chart is from, which may contain more up to date information than the snapshots on this page, which were current as of the time of this post.
Just a new batch of PPP polls in Iowa today. Two changes worthy of note:
Clinton vs Bush
Bush vs Clinton has been bopping up and down across the Clinton leads by 5% line. The average is now once again on the “Weak Clinton” side of this line… and the trend in the last few months seems to be in that direction. With this, we mark Iowa as “possible” for Bush and include it in his best case:
Why look there at that little peak stretching out over the past few weeks. This means that Bush’s best case is now to only lose by 12 electoral votes to Clinton. Bush only needs to get 6 more electoral votes worth of states to move into the “Weak Clinton” category to make his best case actually be to WIN. The best candidate right now is Minnesota (10 EV) where Clinton is ahead by 6.8%. (Minnesota also has only one Bush vs Clinton poll so far, and it was from October, so some new polling there is definitely needed… it may actually already be close, we just don’t have the polling to see it yet.)
Will this Bush surge in his “best case” continue? Will it start being followed by increases in his “expected case” as well? As usual, we await more polls to find out…
Clinton vs Rubio
The other major thing to come out of today’s polls, is that for the first time Clinton vs Rubio joins the “top five best polled candidate combinations” that I actively blog about, knocking off Clinton vs Ryan which hasn’t had new polling since Ryan announced he wasn’t going to run.
Since this combination is a new one for us to look at, rather than examining trends, lets look at the snapshot of where Clinton vs Rubio is right now:
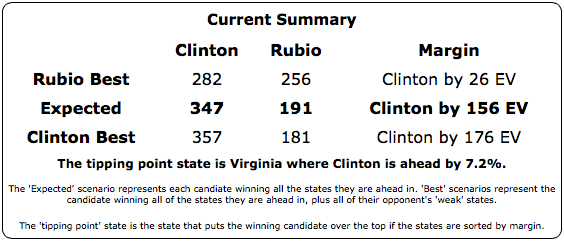
So, not winning against Clinton, just like all the other Republicans at the moment. But lets look at some comparisons with the other well polled Republicans. Since the Republicans are all losing right now, the “expected case” isn’t as interesting. Lets look instead at the Republican “best cases” and the tipping points:
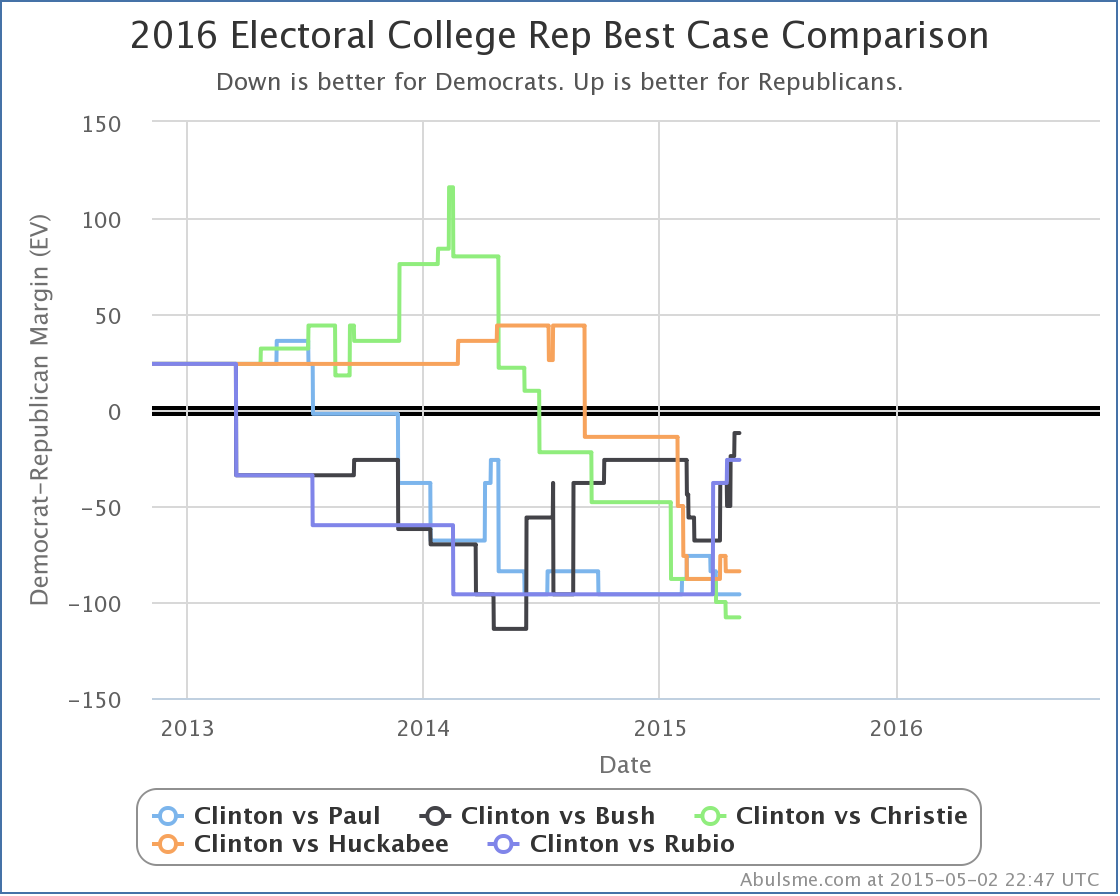
First the “best cases”. Rubio is second only to Bush (amongst the five best polled combinations) at how close things look if you give him all the close states. Bush loses by 12 electoral votes, Rubio loses by 26. (Going down the line, Huckabee loses by 84, Paul by 108, and Christie by 156.) This is all in the best case of course, the case where the Republican holds all of the states they are ahead in and also flips all the states where Clinton is ahead by less than 5%. A less than 5% lead is a slim on that can go away pretty quickly, or be wiped out by polling error, so this is an important metric to look at.
But if we want to look at “how far does the candidate have to move the polls to win” that is what the tipping point is all about, so moving on to that:
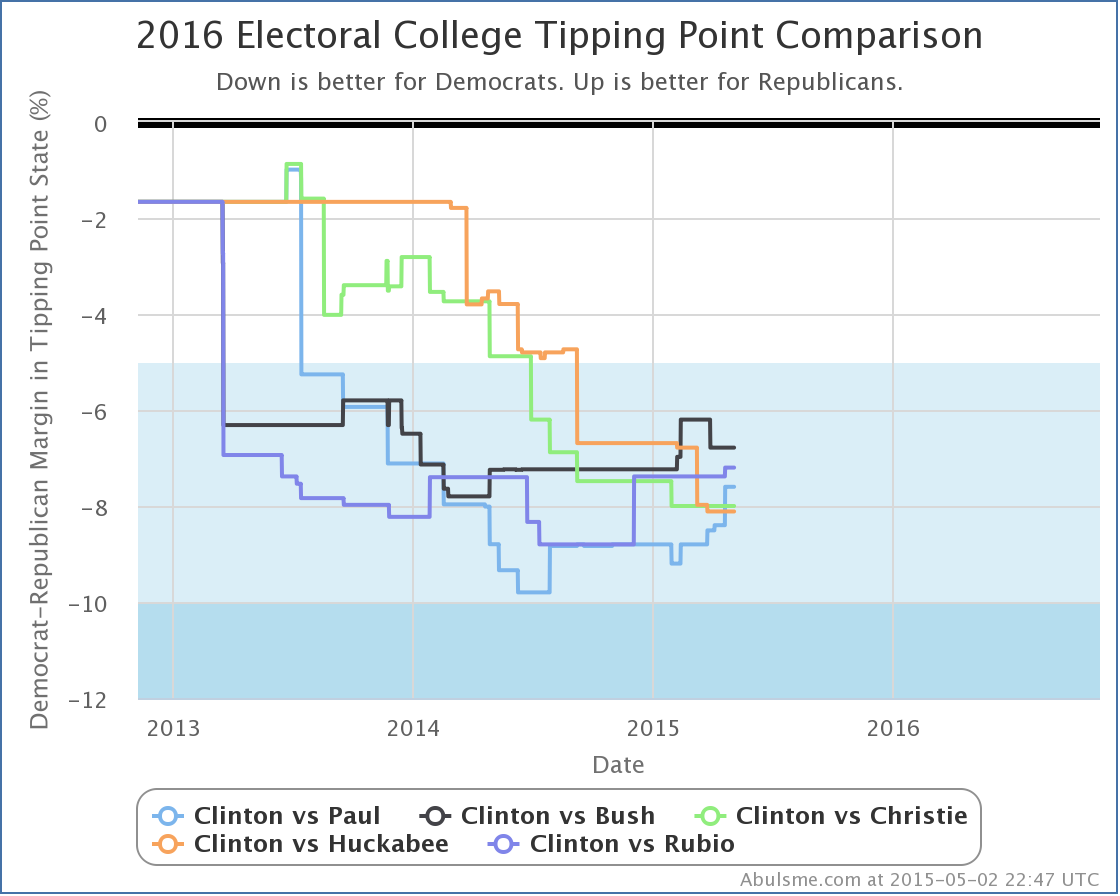
All five of the candidates here end up in “Strong Clinton” territory at the moment. Rubio is again doing second best of these five Republicans against Clinton. Clinton leads Bush by 6.8%, Rubio by 7.2%, Paul by 7.6%, Christie by 8.0%, and Huckabee by 8.1%. Within this comparison, Rubio doesn’t do all that badly against the field. It’s just that none of them are doing all that great.
Of course, this is the time to remind everybody that even though an 8% lead sounds huge, it means that only 4% of the voting public… or 1 person out of 25, needs to change their mind in order to flip the election. (Or the undecideds have to break solidly in favor of the challenger, or turnout heavily favors the challenger, etc.) Now, the American electorate is very strongly polarized right now. But is it that hard to imagine 1 out of 25 people changing their minds if a big scandal hits Clinton and sticks? Or the economy goes south before the election? Nope. It isn’t. This far out, anything can still happen. Views like this show where things stand NOW, not where they will be in 556 days.
Note: This post is an update based on the data on my 2016 Electoral College Analysis Site. All of the charts and graphs seen here are from that site. Graphs, charts and raw data can be found there for the race nationally and in each state for every candidate combination that has been polled at the state level. In addition, comparisons of the best polled candidate combinations both nationally and each in each state are available. All charts above are clickable to go to the current version of the detail page the chart is from, which may contain more up to date information than the snapshots on this page, which were current as of the time of this post.
Today there were tons of new polls added to my tracking site. The new polling once again put Clinton vs Paul as the “best polled” candidate pair combination, once again swapping places with Clinton vs Bush to be the default displayed on election2016.abulsme.com. But in the end there were only three status changes on the five candidate pairs with the best polling. Today all three of these changes favor Clinton.
Clinton vs Bush
A new Gravis poll in Iowa increases Clinton’s lead once again to over 5%:
This in turn lowers Bush’s best case from losing to Clinton by 38 electoral votes, to losing by 50 electoral votes:
Iowa has been bouncing back and forth over the line between Weak Clinton and Strong Clinton though, so don’t be surprised for this to change again as new polling comes out.
Clinton vs Christie
A new PPP poll in New Hampshire shows Christie trailing Clinton by 15%. Before this poll, the worst Christie had done in New Hampshire against Clinton was being behind by 5%. So this certainly looks like a potential outlier:
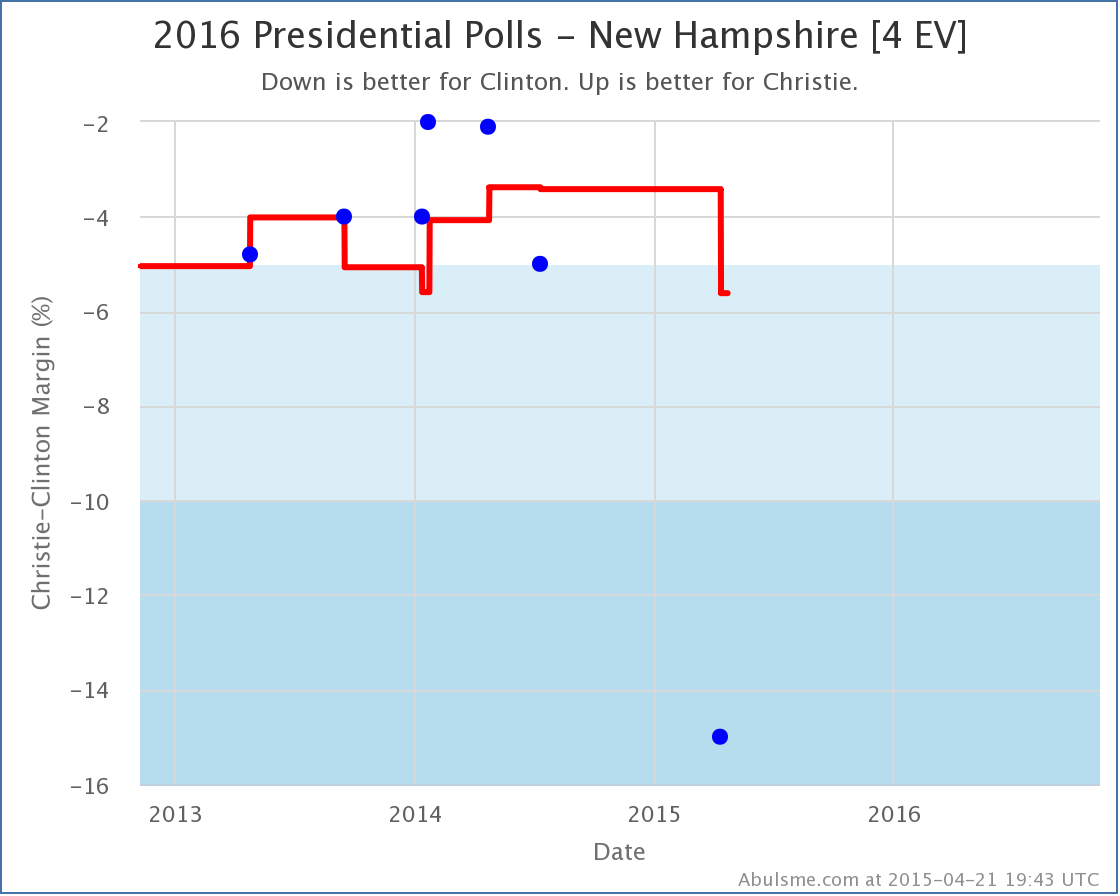
On the flip side, the last polling for Clinton vs Christie in New Hampshire was way back in July, and Christie has been slipping in almost every poll he appears in. So this may also be indicative of a real movement. As usual, the only way to confirm will be with additional polls.
For the moment, with the poll average showing a 5.6% Clinton lead, I remove New Hampshire from the “possible” list for Christie, which moves his best case from losing to Clinton by 100 electoral votes, to losing by 108 electoral votes:
The last time Christie saw any state change categories in his direction vs Clinton was more than a year ago in February 2014. Christie’s general election prospects seem dimmer and dimmer as time goes on. Of course, although I won’t track the nomination races until there are actual delegates to count, if you look at polling for the Republican nomination, you’ll note that the trends look the same there, so Christie may not have to worry that much about his general election prospects.
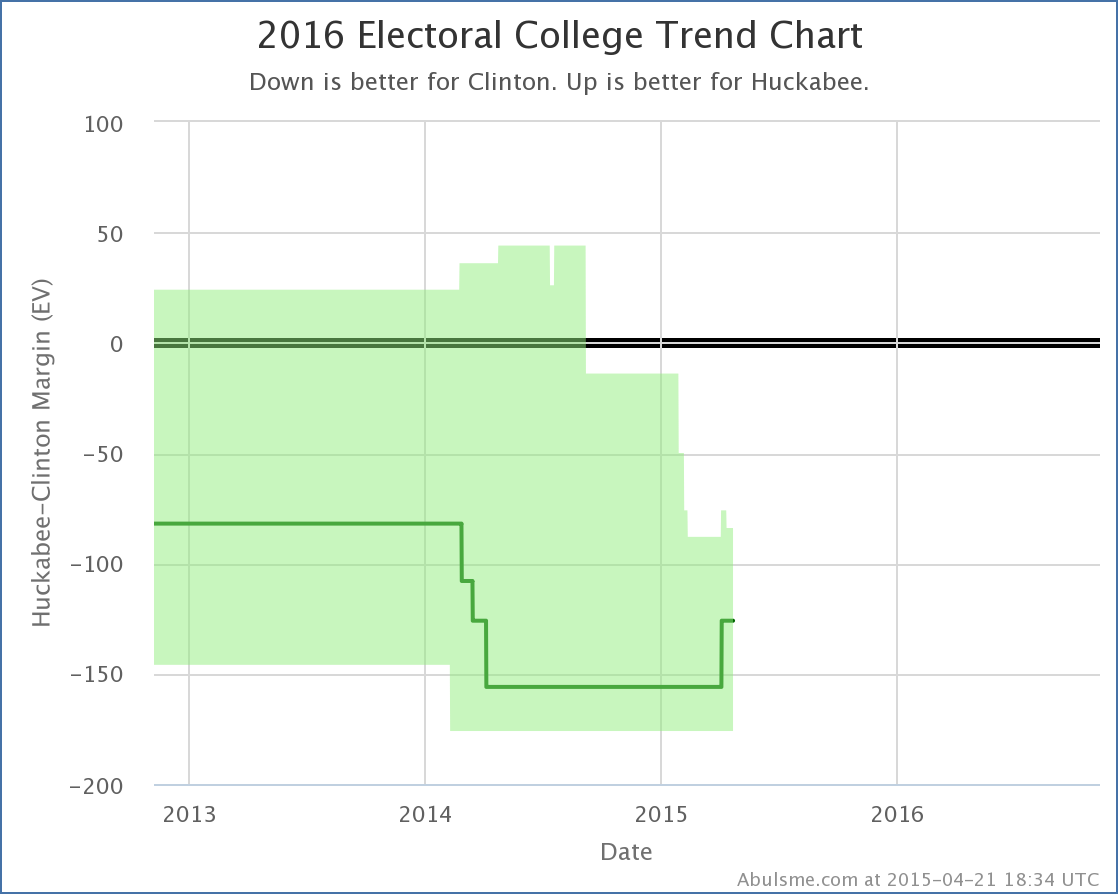
Clinton vs Huckabee
The same PPP poll in New Hampshire mentioned above is only the second Clinton vs Huckabee poll conducted in New Hampshire, but it is enough to move the average to a greater than 5% Clinton lead:
And this moves Huckabee’s best case against Clinton from losing by 76 electoral votes, to losing by 86 electoral votes:
Comparison
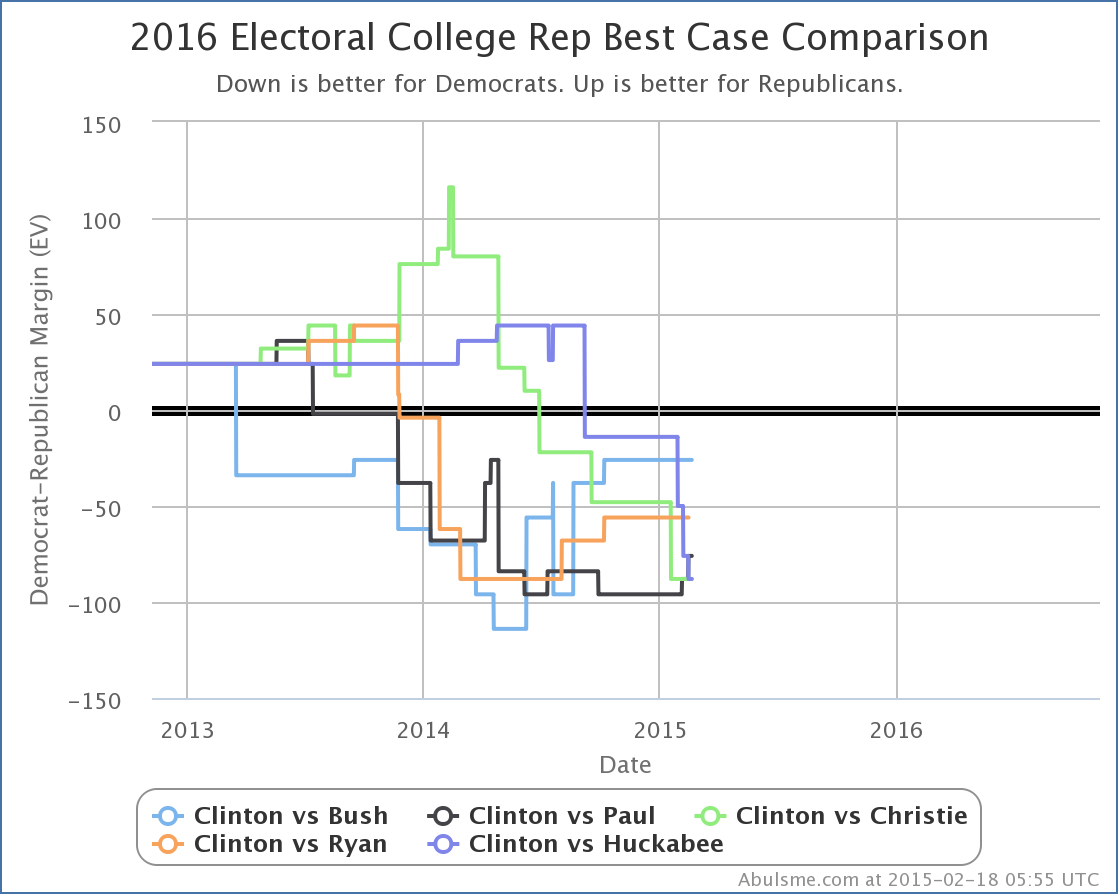
Looking at the “best case” of each of the five “best polled” challengers to Clinton over time:
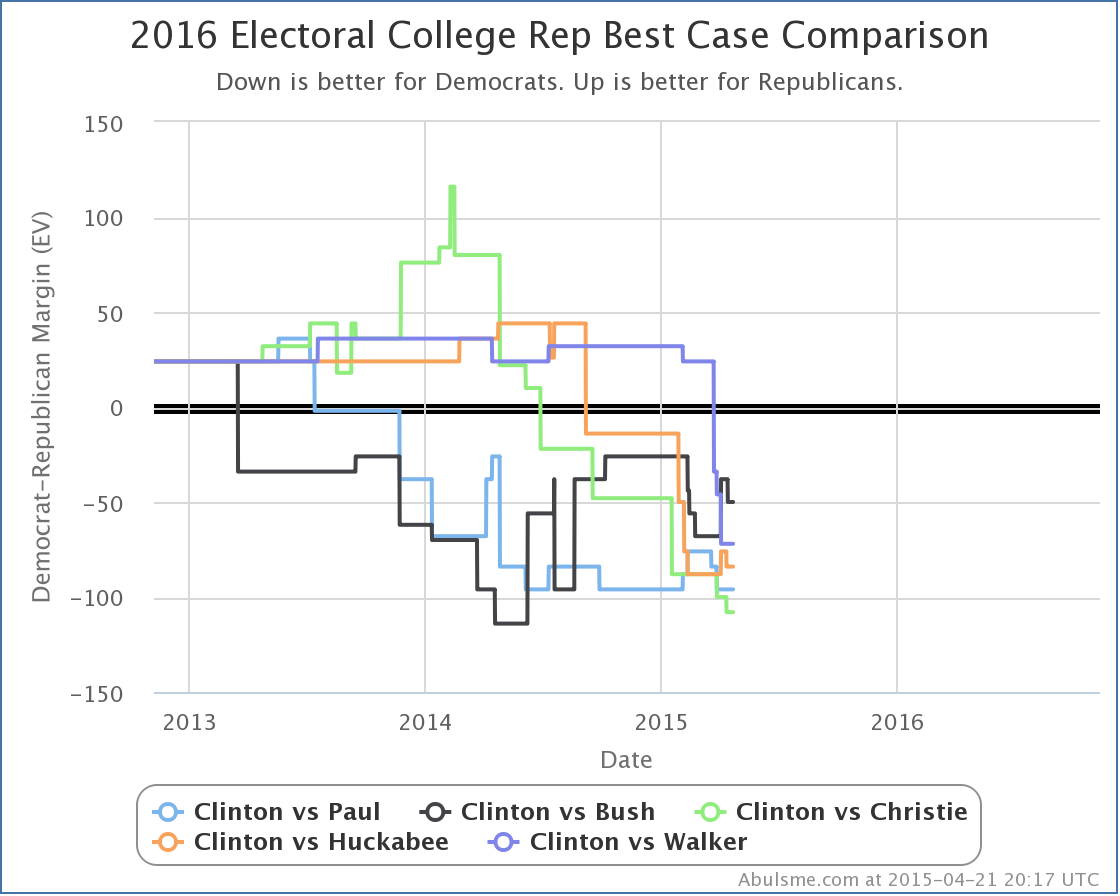
Since the 2014 elections, Paul is flat. Bush, Christie, Huckabee and Walker are all down. Which means that so far, NONE of these candidates have actually been expanding the list of states that are actually in contention. Now, some other metrics have shown some movement toward some of these candidates, but this is a critical one. The Republicans can’t win without first making more currently blue states close.
Clinton vs Ryan, Clinton vs Rubio, and Clinton vs Cruz are the #6, #7 and #8 best polled candidate combinations. They are way behind the five above in polling quality by my metric, but feel free to take a look if any of those candidates are of interest… just interpret the results with caution.
Note: This post is an update based on the data on my 2016 Electoral College Analysis Site. All of the charts and graphs seen here are from that site. Graphs, charts and raw data can be found there for the race nationally and in each state for every candidate combination that has been polled at the state level. In addition, comparisons of the best polled candidate combinations both nationally and each in each state are available. All charts above are clickable to go to the current version of the detail page the chart is from, which may contain more up to date information than the snapshots on this page, which were current as of the time of this post.
Today’s big poll dump was from Quinnipiac, in the latest of their “Swing State Poll” series. This edition features polls from Colorado, Iowa and Virginia and is given the headline “Paul Blooms As Clinton Wilts“. That sounds pretty strong. But lets see how that headline holds up when we look at today’s updates in the context of poll averages rather than just results from one pollster, and looking beyond just the individual states with my method of classifying states.
Quinnipiac tested seven candidate combinations, but only four of those are in the “five best polled candidate combinations” by the measure I use here, so those are the ones I will talk about today. That would be Clinton vs Bush, Paul, Christie and Huckabee. (The fifth combo on the top five, Clinton vs Ryan, hasn’t been polled by anyone since February, but Cruz, Rubio and Walker, the next three by my metric, and also the others polled by Quinnipiac, still haven’t had enough polling to catch up and pass Ryan.)
So of those four, what were the actual changes in my models? There were changes for three candidate pairs. In all three cases the changes favored the Republican.
Clinton vs Bush
With today’s update, Clinton vs Bush once again becomes the “best polled” candidate combination by my metric, taking the spot from Bush vs Paul and thus becoming the default view on election2016.abulsme.com.
More importantly though, with today’s updates Clinton’s lead in the polling averages in both Colorado and Iowa dropped below 5%, putting those states back into play as “close states” that we consider possible for Bush to win. With these two back in play, Bush’s best case improves from Clinton 303 to Bush 235 before the update, to Clinton 288 to Bush 250 now, a loss by only 38 electoral votes. You can see the uptick in the top right part of the “bubble” representing the reasonable range of outcomes for Bush against Clinton given current polling:

Clinton vs Paul
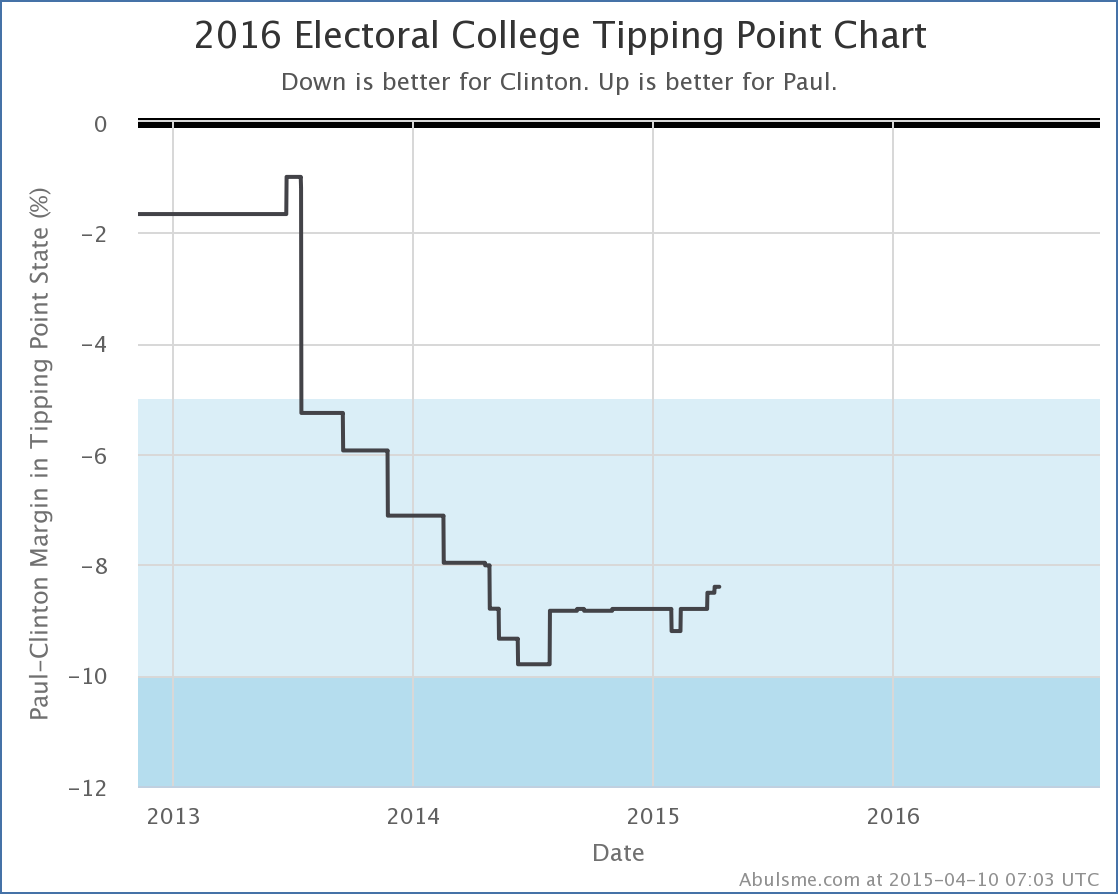
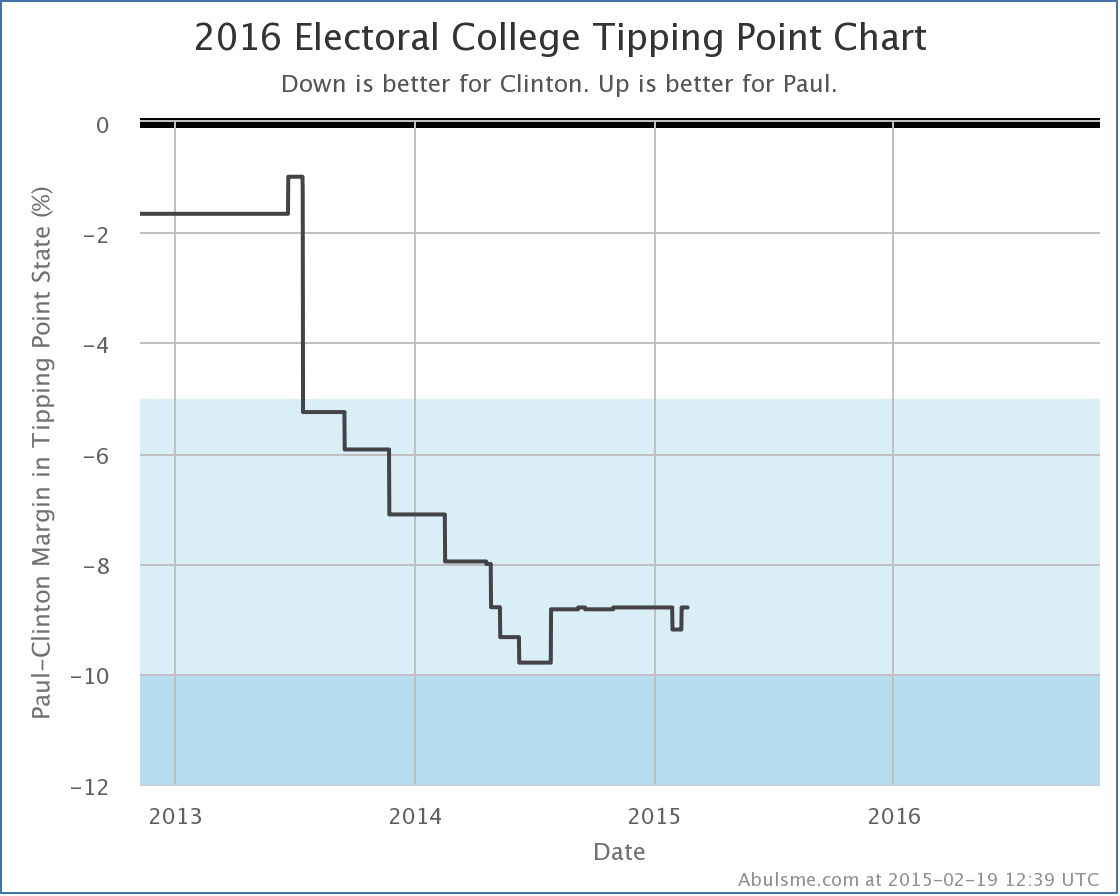
No states changed categories for Paul, despite the headline about Paul “blooming”. His average in Virginia however did improve from losing by 8.8% to only losing by 8.4%. This in turn moved his “tipping point margin”, a measure of how much polls need to move nationally to flip the electoral college, from being behind by 8.5% (with Wisconsin being the tipping point state) to being behind by 8.4% (with Virginia as the new tipping point state). This is the third tipping point change in a row in Paul’s direction. Almost starting to look like a trend.
Clinton vs Huckabee
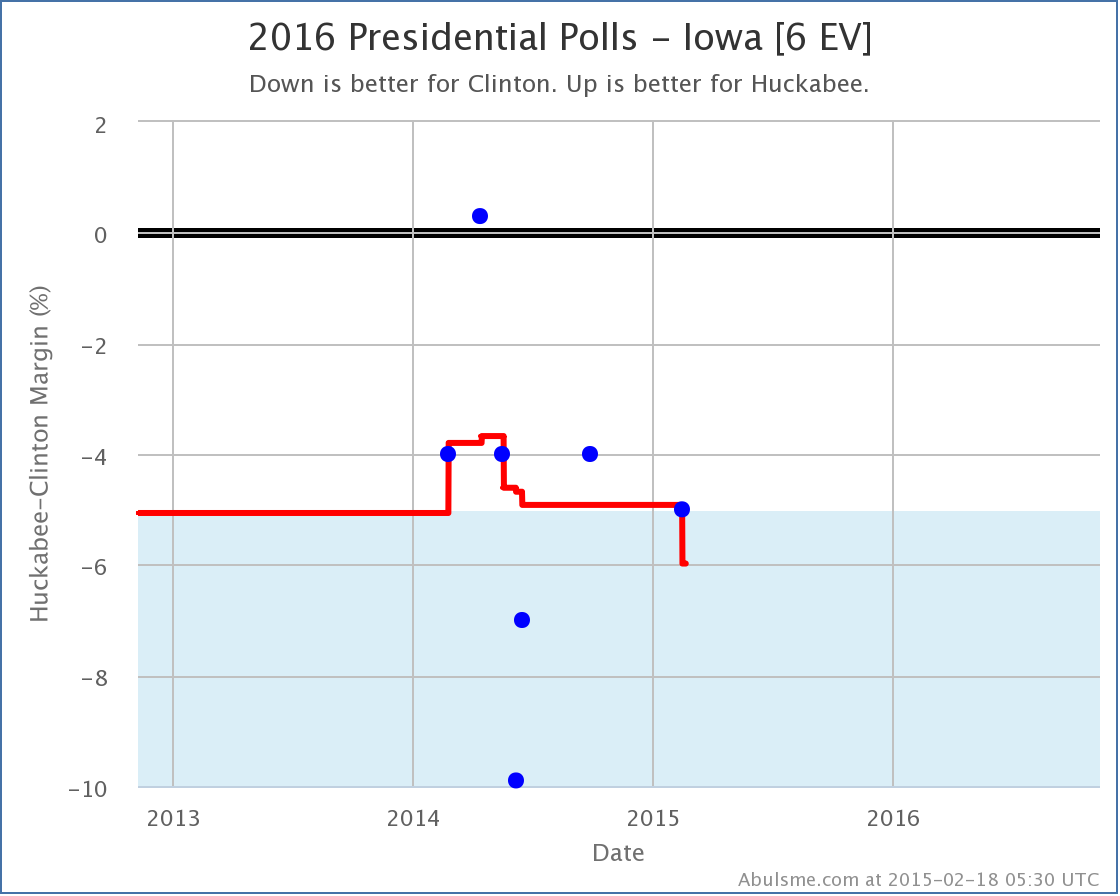
With the new results from Quinnipiac, Clinton’s lead against Huckabee in Iowa falls from 6.6% to 4.6%. That’s a rather big drop, and it makes Iowa once again a “possible” for Huckabee. So his best case moves from losing by 88 electoral votes, to only losing by 76 electoral vote. You can see this at the top right of his “bubble”:
State Comparisons
Now, while Clinton does weaken in each of the three cases above, none of this really seems to justify the “Paul Blooms as Clinton Wilts” headline on the national level. But of course these polls weren’t at the national level. The headline was really specifically about the three states polled. So lets look at how each of the candidate pairs in question are doing in these three states specifically. In each one, just look at the very last change in the lines to see how this new poll result affected the averages. (All the charts in this section also include Clinton vs Ryan, but that line can be safely ignored, since Ryan wasn’t included in these polls.)
So, in order of the number of electoral votes:
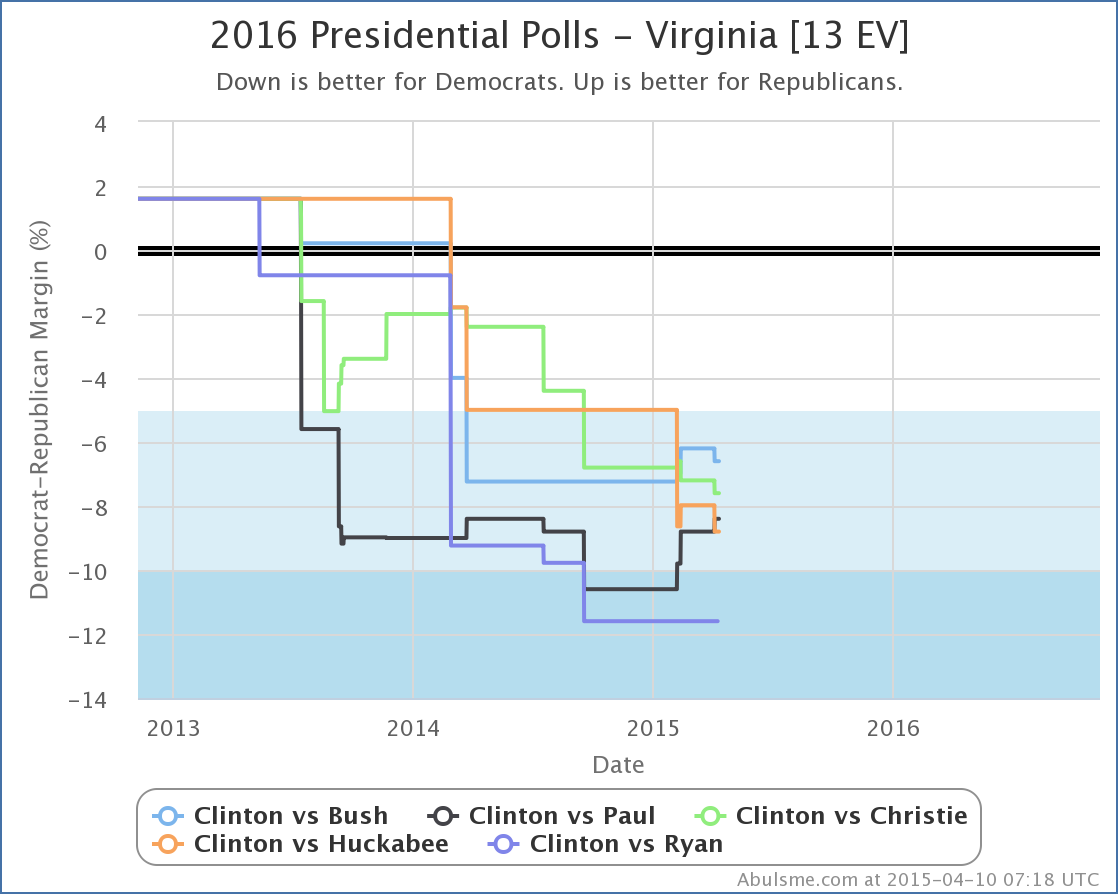
Bush, Christie and Huckabee actually fell further behind in Virginia as a result of this new polling. Paul was the only one of the four who actually improved in Virginia, reducing his deficit from 8.8% to 8.4% in my average. None of the four candidates made a move that changed the category though. Virginia is “Strong Clinton” against all four of these candidates, and this polling didn’t change that. Paul does stand out here though, by being the only one improving against Clinton.
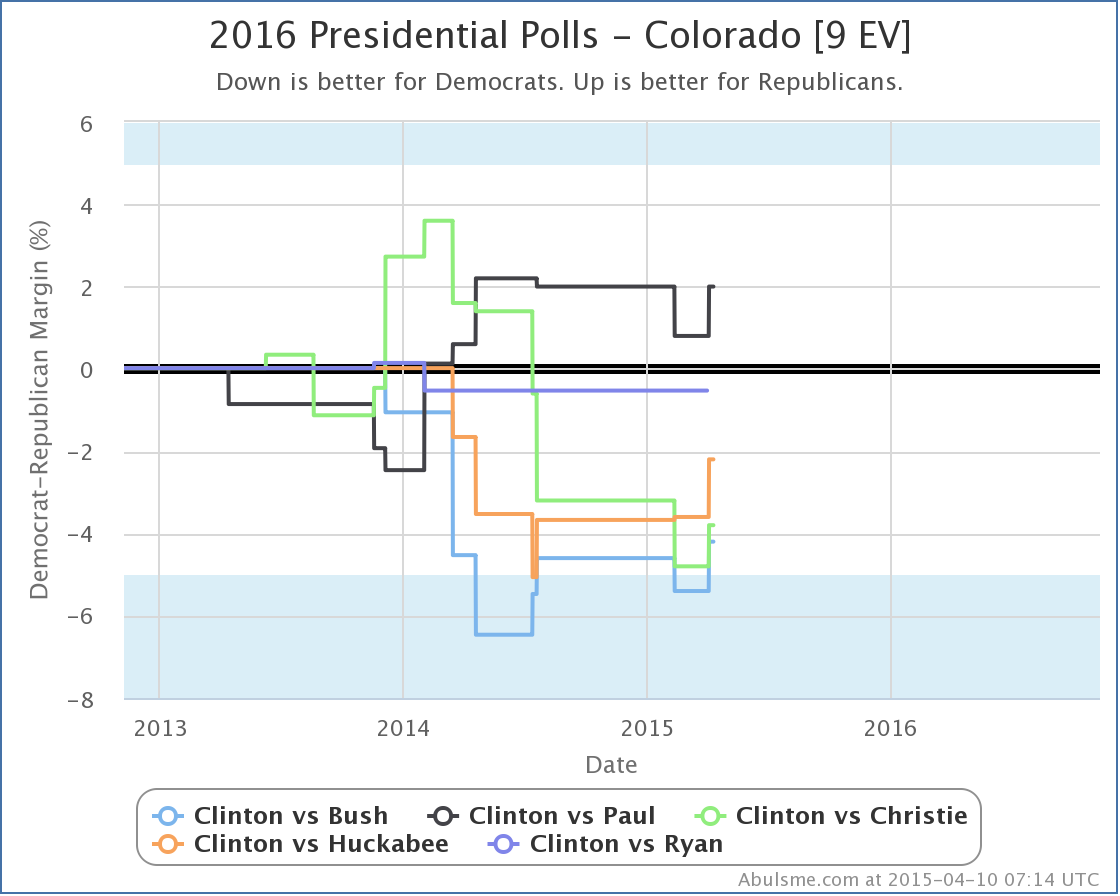
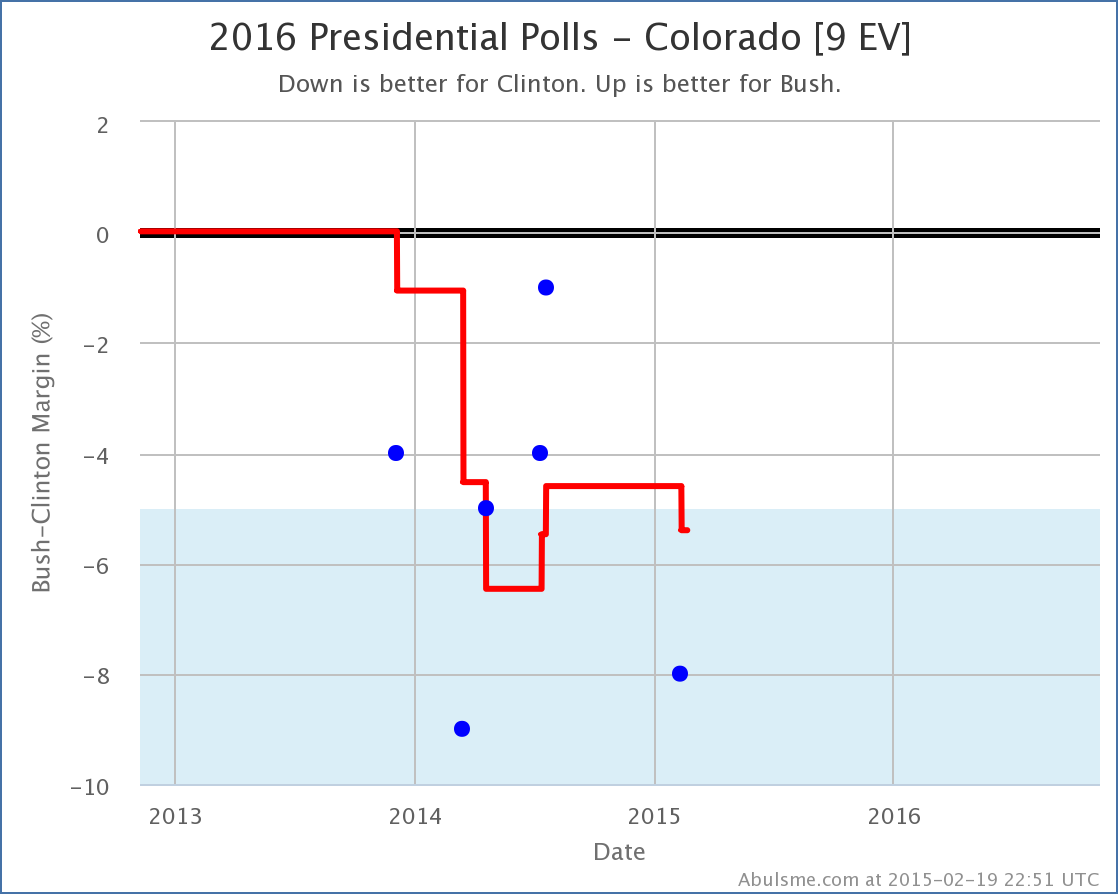
In Colorado all four of the candidates improve against Clinton as a result of the Quinnipiac poll. Bush actually moves into the white zone here, which as was mentioned earlier, means that the state is now a possible win for him. But this actually just brings Bush back in line with the rest of the pack. Colorado is a close state for all of these candidates.
Paul stands out in Colorado too, but not for the recent movement, but because he is the only one of these candidates who is showing that he could turn Colorado red again. (Colorado went blue for Obama in both 2012 and 2008, but was red in 2004, 2000 and 1996.) This is not new though. Paul has been consistently leading in the Colorado poll average against Clinton for over a year.
Bush, Paul and Huckabee all improved in Iowa, with Bush and Huckabee of course moving Iowa back into competitive territory, where Paul already was. Christie fell a bit further behind.
With all of the above, the moves were definitely not friendly to Clinton on the whole, but “wilting” looks like hyperbole. And while Paul does well here, so do Bush and Huckabee, arguably with moves just as significant as Paul’s if not more so.
So where does Quinnipiac get their headline?
Well, duh, they are only looking at their own polls. They are comparing their most recent results in these three states with the results of the last time they polled these three states back in February. I’m sure if you look at things with only that lens, it looks like exactly what they say it does. But you are ignoring a lot of data if you do that.
For instance, looking at only Quinnipiac data in Iowa, you see a move from Clinton having an 8.0% lead in February, to Paul being ahead by 1% now. Huge move, right? Massive momentum away from Clinton and toward Paul, right?
Lets look at the chart showing all the Clinton vs Paul polls in Iowa, not just Quinnipiac:
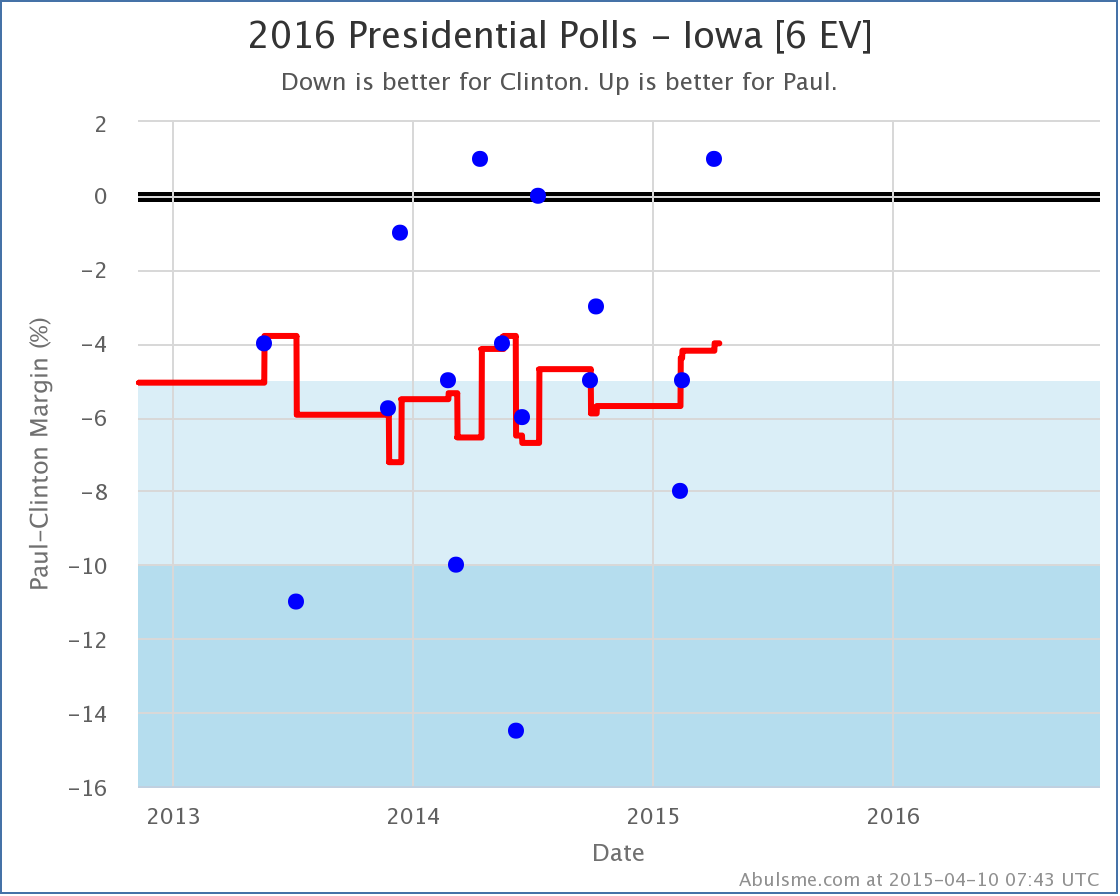
Hmmm… where did the trend go? Now, there have only been three polls so far in 2015, and it is true that each one has been better for Paul than the one before. But looking at the history of polling Clinton vs Paul in Iowa since the 2012 election, you see that the results are all over the place. There is huge scatter here. The results bounce all over the place. And so far, there has not been any sort of clear trend at all.
Yes, the new Quinnipiac poll looks great for Paul. He’s beating Clinton in Iowa! But there was a poll about a year ago that said that too. It wasn’t backed up by other polls though and wasn’t the sign of a big trend toward Paul. It was just more random variation. It wasn’t real.
Could this new poll be the first signs of a real long term movement? Maybe. Maybe not.
Kids, this is why we look at poll averages instead of individual polls.
If there is an actual big movement toward Paul, or any of the other Republican candidates, we’ll know soon enough as more and more polls start showing that movement. But no such clear trend is visible yet for any of the candidates with the most polling.
(I mentioned at the top that right now Clinton vs Cruz is the 6th best polled combo, Clinton vs Rubio is at #7, and Clinton vs Walker is at #8. You can click through on those links if you want to see what those look like at the moment. The amount of state level polling still isn’t great on those guys, so interpret the charts carefully.)
Note: This post is an update based on the data on my 2016 Electoral College Analysis Site. All of the charts and graphs seen here are from that site. Graphs, charts and raw data can be found there for the race nationally and in each state for every candidate combination that has been polled at the state level. In addition, comparisons of the best polled candidate combinations both nationally and each in each state are available. All charts above are clickable to go to the current version of the detail page the chart is from, which may contain more up to date information than the snapshots on this page, which were current as of the time of this post.
Another day and yet more polls moving things around. So lets go…
As usual click on any of the charts for more detail.
Clinton vs Paul
First of all, the latest batch of polls has Clinton vs Paul once again the “best polled” candidate combination, pushing Clinton vs Bush out of that spot. Keep in mind this does NOT mean they are the frontrunners in their respective parties, just that there have been more polls in the closest states than there have been for other candidate pairs. This means the default view on election2016.abulsme.com is now Clinton vs Paul. But the gap between them on my polling quality metric is very small, so don’t be surprised if they switch places again.
Next, a new poll in Virginia improved Paul’s standing slightly. No category change, Virginia is still a “Strong Clinton” state based on current polling against Paul. But the tipping point was moved:
The tipping point moves from Clinton by 9.2% in Ohio, to Clinton by 8.8% in Virginia. This represents how big a uniform move in the polls across ALL states would have to happen to give Paul the edge in the Electoral college. This is basically because at the moment, to win, Paul would have to flip North Carolina (0.2% Clinton lead), Nevada (2.8% Clinton lead), Iowa (4.2% Clinton lead), New Hampshire (4.9% Clinton lead), Minnesota (7.0% Clinton lead), Michigan (8.6% Clinton lead), and Virginia (8.8% Clinton lead). [This is the list of states that are closest that would need to be flipped, there are of course other combinations that would do the trick if Paul flipped states with even bigger Clinton leads.]
Since Virginia would be the state that would put Paul over the top, it is the tipping point state and the margin there is the amount everything would have to move to make this scenario happen.
Clinton vs Bush
This combination sees relevant changes in Colorado, Iowa and Virginia.
In Colorado, Clinton’s lead grows to over 5%, so this state moves out of contention and into “Strong Clinton”. (For now anyway, but do I really need to repeat just how early things are, and how relatively sparse polling still is too?)
Same thing in Iowa. Although in Iowa, it looks like we might have a situation where the polling is returning to “normal” after a couple of outlier polls, while you could argue that in Colorado, the “true” state might just be bouncing around the 5% boundary line.
In either case, we shouldn’t be too surprised if the states get closer again.
With both of these states moving out of the “Weak Clinton” category, Bush’s overall best case against Clinton deteriorates a bit:
With this (plus another Iowa poll that was added yesterday) Bush’s best case against Clinton moves from losing by 26 electoral votes to losing by 56 electoral votes.
But while things haven’t been moving his way in Colorado or Iowa, in Virginia the latest polls have actually been moving toward Bush. No category changes… Virginia moved from a 7.0% Clinton lead to a 6.2% Clinton lead. This was enough to move the tipping point in Bush’s direction:
Virginia was the tipping point before this move, and it didn’t leapfrog any other states, so the tipping point stays in Virginia as it moves.
So Bush’s best case is getting worse, but his overall position is getting better? Yes, basically.
With current polling Iowa and Colorado now look like they aren’t competitive. So that is worse for Bush. But in order to win, Bush would have to flip a LOT of states, and the one he needs that he is furthest behind in is Virginia… but he is now not quite as far behind there. So if he is going to move all the states he needs to in order to win, he’s actually got a little bit less to move overall, even though Iowa and Colorado just moved a little further away.
Other folks
Just yesterday I was noting that Clinton vs Walker, despite being talked about quite a lot was still #18 on the ranking of best polled candidate combinations. With todays polls, he burst into the Top 10, debuting at #9, pushing Biden vs Rubio out of the Top 10. Still a bit away from the Top 5 combinations that I highlight here as having enough polling to say something useful about the race, but getting closer. If he continues to get lots of polling attention, while Clinton vs Ryan and Clinton vs Cruz and such do not, then he may get there sooner rather than later.
If changes keep coming in at this rate, I may need to move to a once a week update format, at least until we get a bit closer to the election. In any case, with today’s batch of new polls, we get a couple of status changes in Iowa, which in turn shift the national picture a bit.
Click on any of the charts to see more detail.
Clinton vs Paul
With today’s update, Iowa moves into the “Weak Clinton” zone, meaning that I consider it to be close enough to allow for the possibility of Paul winning. This improves Paul’s best case against Clinton to losing by 76 electoral votes. A couple of weeks ago, Paul’s best case was to lose by 96 electoral votes. So there does seem to be some movement here.
Looking at the actual polls in Iowa though, this trend is a little less clear. Iowa seems to have been bouncing back and forth over the 5% Clinton lead line for the last two years, spending more time with Clinton further ahead than 5%, but with occasional temporary movement toward Paul. Can we say that this time is a real “trend” rather than just another short term bump? Nope. Or maybe the average being further in Clinton’s direction is really just the result of a handful of outlier polls and really this “should” have been closer all along. Maybe. We’ll have to wait for more polls to see.
For now though, my charts show movement toward Paul.
Clinton vs Huckabee
While Paul’s picture is improving, Huckabee’s continues to decline. In the latest update, Iowa slips out of Huckabee’s best case. Huckabee’s best case is now to lose to Clinton by 88 electoral votes. A month ago, his best case was losing by only 14 electoral votes, but states keep slipping away. Now, there has been a lot less Clinton vs Huckabee polling than there has been Clinton vs Paul polling, so there is a good chance a lot of this has simply been getting enough polling to get a good picture, rather than actual movement.
Specifically looking at the individual Iowa polls, you can see that we already did have five polls in Iowa, so the picture wasn’t dependent on previous election results, but there have only been 7 polls compared to the 14 for Clinton vs Paul. And there is quite a scatter between those polls (as there also was with Clinton vs Paul). The “movement” here is basically one extreme poll (the one showing Huckabee actually ahead in Iowa) falling out of the average, while another extreme point (the one showing Clinton ahead by 10%) remains in the average.
As with the Paul situation, it is far from clear that this is a real trend as opposed to just a temporary bump in this direction, and the next polls could change the picture again. It is well within the realm of possibility that the “real situation” for both of these candidates is that Clinton is just about 5% ahead of them, and they will just bounce back and forth between my categories as new polls come in.
Comparison
Since in both cases today, what has changed is the Republican best case, lets look at the trends there with the five best polled candidate combinations. Looking just since the 2014 elections, the movement on this specific metric has been Paul improving, Bush and Ryan flat, Christie and Huckabee declining. Other metrics show slightly different trends, but when all of the Republicans here are losing even when you give them all the close states, the first step is just to start making states close, and this chart measures that process.
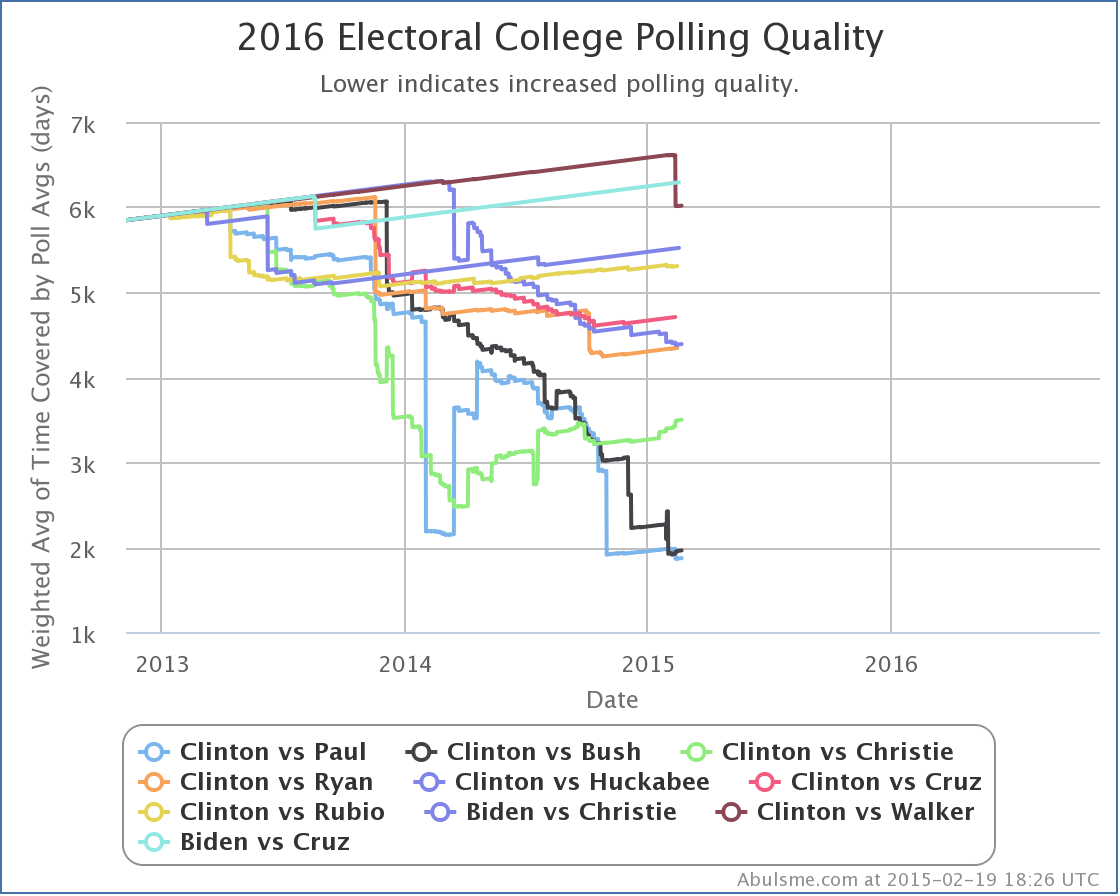
But wait, Ryan has said he isn’t running, and what about this Walker guy? A bunch of people have been talking about him lately. Well, I recently introduced this new chart on where the candidate combinations stand in my “polling quality” metric:
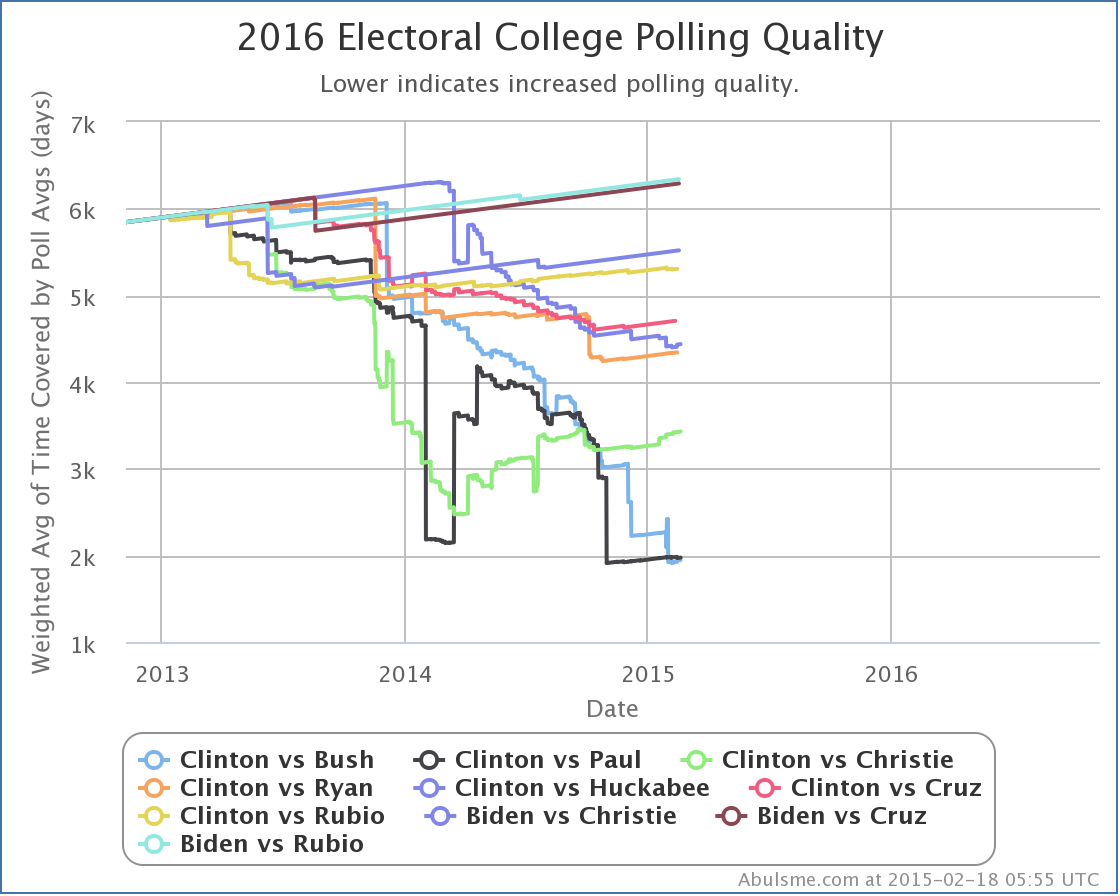
This shows the best TEN polled candidate combinations, not just the top five, so we can see if new candidate pairs are heading toward the top five.
On this chart the lower the line, the better the polling quality. Poling quality is measured by the average amount of time used in the polling averages across the 56 jurisdictions that have electoral votes, weighted such that close states count a lot more than states where one candidates lead is large. A new poll may or may not improve polling quality, since if new poll makes a state less competitive than it was, the weight of that state also decreases in this metric. If there are no new polls for a candidate pair, the polling quality slowly gets worse as each day passes.
Anyway, what do we see here? Well, if trends continue, looks like Clinton vs Huckabee may soon pass Clinton vs Ryan, and Clinton vs Bush and Paul are very close to each other so easily could flip back and forth, but Clinton vs Cruz hasn’t shown any signs lately of much life. Nor any of the others in the 6-10 zone. So we may not get any new combinations in the top five for a little while yet.
How about Clinton vs Walker? Oh, yeah. that combination is still way out at #18 on this ranking. He stands at about 6616 on this metric, compared to 6340 for the worst of the top ten shown in the chart above and 4437 for the worst of the top five. We need a lot more state level polls of that combination before we have enough polls to meaningfully compare that scenario to the five we’re showing in the analysis here.


|
Romney |
Obama |
| Romney Best Case |
264 |
274 |
| Current Status |
206 |
332 |
| Obama Best Case |
205 |
333 |
A bunch of states were called between 04:00 UTC and 04:15 UTC:
- Obama: CA, HA, WA, WI, IA NM
- Romney: ID, MT, NC
Only one of these mattered. Iowa. Iowa was a close state. Romney needed every close state he had left in order to win. Without Iowa, even if Romney swept every other close state (and Maine’s 2nd) he would only get to 264.
When CNN called Iowa at 04:09 UTC, I called the race on twitter in these two tweets. Nine minutes later when some more states came in, CNN called the election for Obama. They were slow. More on those next states in the next update.
Anyway, Obama wins reelection!
|
|

