This is the website of Abulsme Noibatno Itramne (also known as Sam Minter).
Posts here are rare these days. For current stuff, follow me on Mastodon
|
The Iowa results on the Republican side were officially certified on Wednesday, earlier than anybody expected, and with a surprise. Almost every source believed 27 delegates would be decided by the caucus results, but the remaining 3 “automatic delegates” who are party leaders, would attend the convention unbound and able to support whoever they wished. But it looks like those three delegates will be bound by the caucus results as well.
When you do the required math on 30 delegates instead of 27, everything remains the same, except Huckabee gets a delegate too.
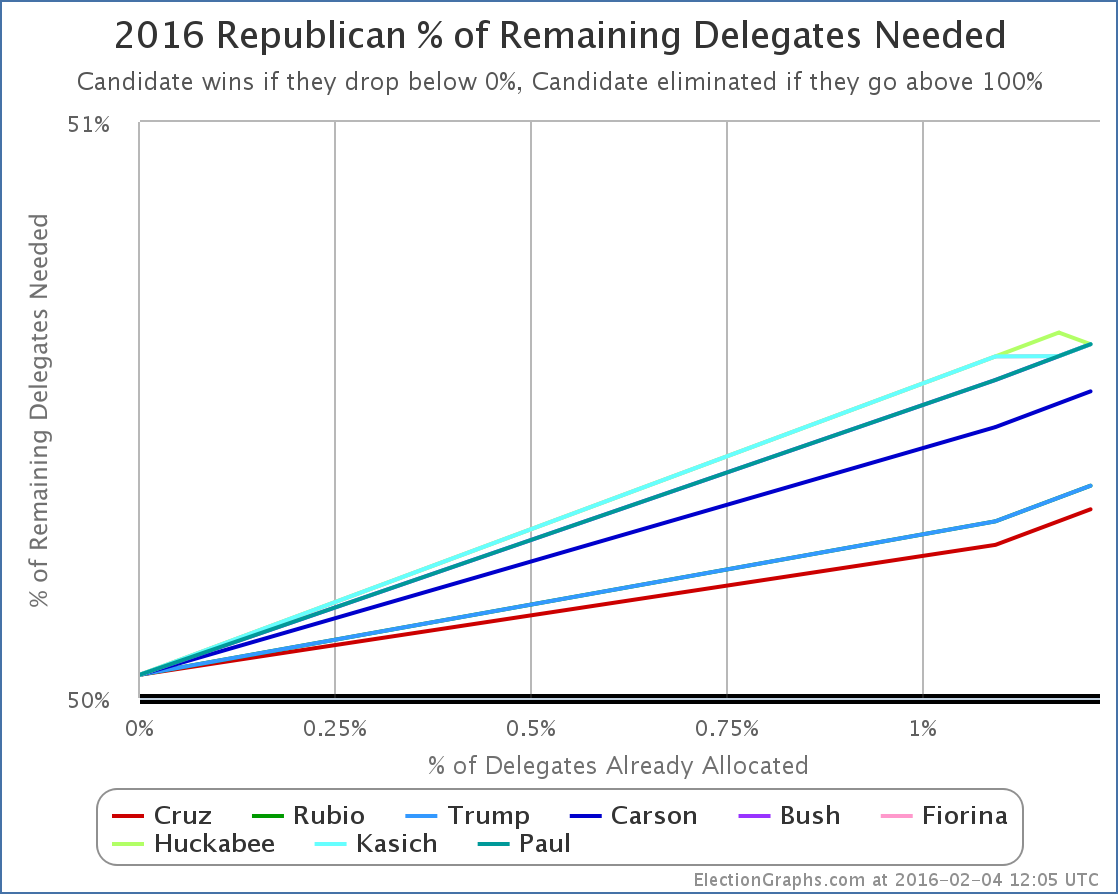
Updating the chart showing the “% of remaining needed to win” graph:
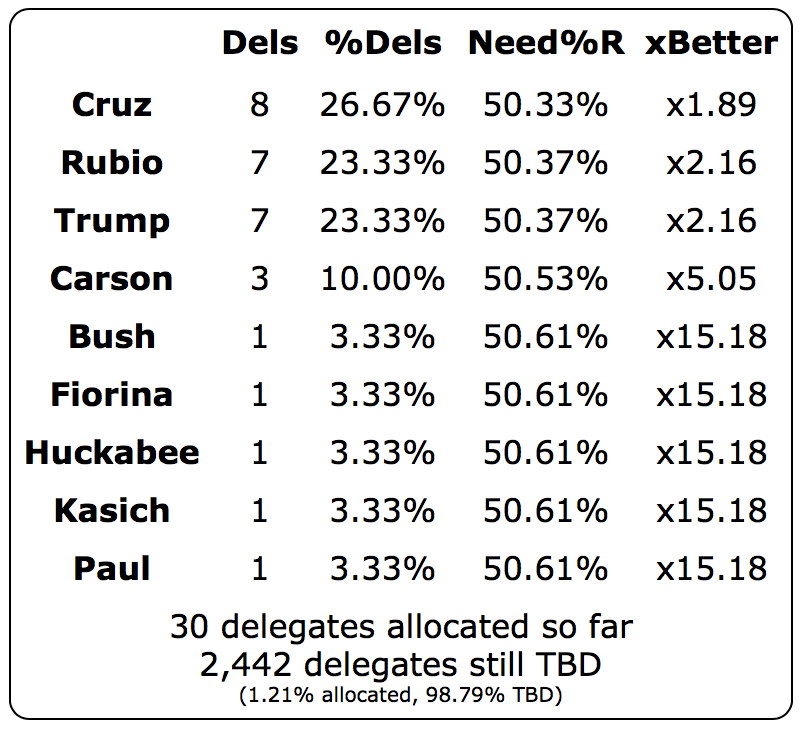
And the raw numbers:
Huckabee and Paul have suspended their campaigns, but since these are bound delegates, they keep them unless the candidates officially release them. I haven’t seen a report of that yet, so won’t remove them from the list at this point. Not that it matters much for single delegates. This is a much more important factor when candidates drop out later in the race once they have already accumulated a significantly sized chunk of delegates.
Huckabee’s one delegate makes no difference to the analysis I posted Tuesday or the follow up from Wednesday.
We still have three candidates showing strength going into New Hampshire It is within the realm of possibility that New Hampshire will add a fourth to that list, but just as likely it will solidify the “three way race” picture. And as I outlined in the Wednesday post the specific New Hampshire delegate rules matter a lot. Specifically the rules essentially give extra bonus delegates to the winner, and don’t allow delegates at all for anyone coming in under 10%. This is a recipe to transform a plurality win to a healthy delegate majority.
So if you are watching the polls as they start to include post-Iowa data, watch carefully not only who is in the lead, but exactly who is above or below the 10% threshold, because that will make a huge difference in the delegate counts.
And an 8-7-7 split with only 1.21% of delegates determined is essentially a tie. And a tie that will soon be overwhelmed numerically by the results from New Hampshire and beyond. So don’t get sucked too deeply into the spin from all quarters taking about who is up and who is doomed. It is still too early for that. (Well, at least if you don’t drop out.)
Five days until New Hampshire.
Note: This post is an update based on the data on ElectionGraphs.com. Election Graphs tracks both a poll based estimate of the Electoral College and a numbers based look at the Delegate Races. All of the charts and graphs seen in this post are from that site. Additional graphs, charts and raw data can be found there. All charts above are clickable to go to the current version of the detail page the chart is from, which may contain more up to date information than the snapshots on this page, which were current as of the time of this post. Follow @ElectionGraphs on Twitter or like Election Graphs on Facebook to see announcements of updates or to join the conversation. For those interested in individual general election poll updates, follow @ElecCollPolls on Twitter for all the polls as they are added.
We made it past Iowa! We have Iowa results! We have brand new speculation about New Hampshire and beyond! Yes, of course, the bulk of this week’s Curmudgeon’s Corner podcast is Sam and Ivan discussing where the presidential race sits in this week between Iowa and New Hampshire. We go over all of the results so far, then discuss how candidates, the media and the public are reacting to those results, and what that means for the rest of the contest. Plus, for the first time in a little while, we do a lightning round as well, covering bluetooth audio issues, Iran, the Flint water crisis, tech earnings results, and more!
Click below to listen or subscribe… then let us know your own thoughts!

Recorded 2016-02-04
Length this week – 2:12:09
 1-Click Subscribe in iTunes 1-Click Subscribe in iTunes
 View Podcast in iTunes View Podcast in iTunes
 View Raw Podcast Feed View Raw Podcast Feed
 Download MP3 File Download MP3 File
 Follow the podcast on Facebook Follow the podcast on Facebook
Show Details:
- (0:00:10-0:05:11) Intro
- Pi O’Clock Again
- Agenda
- Talking Politics
- (0:06:00-0:29:42) Republicans in Iowa
- Loser.com
- Headlines
- Delegate Totals
- Spin
- Polling Wrong?
- People Dropping Out
- Carson/Cruz blow up
- Speeches
- (0:30:45-0:43:55) Democrats in Iowa
- Close Race
- Not a Surprise
- Delegate Totals
- Spin
- Demographic Split
- (0:44:33-1:24:33) Republicans in New Hampshire and beyond
- Delegate Rules
- Delegate Hypothetical
- Will we get good New Hampshire polls?
- Contest Calendar
- Trump reacts to losing
- How will New Hampshire react to Iowa?
- Divided anti-Trump vote
- Trump Strategy
- Bush done?
- Big last minute moves?
- Gilmore
- post-New Hampshire
- Predictions
- (1:25:53-1:42:08) Democrats in New Hampshire and beyond
- Sanders will win New Hampshire
- post-New Hampshire
- Delegate Allocation
- How will Clinton react to losing?
- No Clinton Backup
- Clinton emails
- Clinton collapse scenarios
- (1:43:24-2:11:49) Lightning Round
- Car Bluetooth Audio
- Movie: Thomas and the Magic Railroad (2000)
- Iran Deal Implementation
- Flint Water Crisis
- Oregon Militia Standoff Ended
- Apple Earnings
- Alphabet Market Cap
- Feedback on Performance Reviews
- Feedback on Sam’s Writing
- Growing Show
Yesterday’s update was preliminary, and I ended up using the delegate estimates provided by the AP which were used at the New York Times, Washington Post, and other places. My favorite source, Green Papers, had a different set of numbers. When I tried to calculate delegate numbers myself, I came up with yet another set of numbers. I ended up going with the AP numbers.
A little more than a day later and Green Papers updated, now matching what I had calculated myself. So I’m updating the estimates accordingly.
This moves us from:
8 Cruz, 7 Trump, 7 Rubio, 3 Carson, 1 Bush, 1 Paul
to
7 Cruz, 7 Trump, 6 Rubio, 3 Carson, 1 Bush, 1 Fiorina, 1 Kasich, 1 Paul.
The main change here is one less delegate each to Cruz and Rubio, with those delegates picked up at the bottom end by Fiorina and Kasich.
But wait! There is more! The Washington Post and Politico both add two additional delegates. The 27 allocated by the caucus results were already accounted for, so these would be two of the three “party leaders” who end up as automatic delegates. No indication of which party leader did what, but they add one additional delegate each to Cruz and Rubio.
The new Iowa totals become:
8 Cruz, 7 Rubio, 7 Trump, 3 Carson, 1 Bush, 1 Fiorina, 1 Kasich, 1 Paul.
Between these two changes, the net is simply adding the delegates for Fiorina and Kasich. This means 29 of the 30 Iowa delegates are now accounted for.
Note that even though Paul has “suspended his campaign”, he keeps his delegate unless he explicitly releases it.
The raw delegate count chart now looks like this:
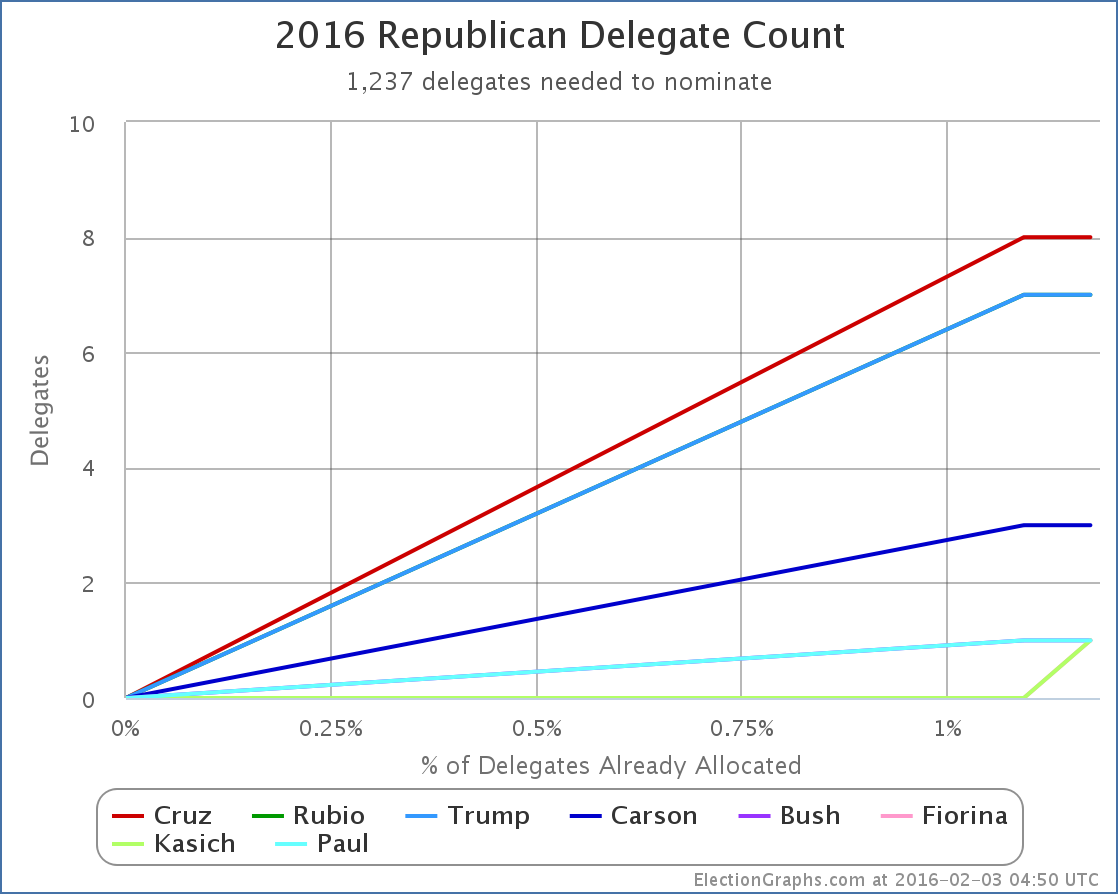
Just a little uptick at the end for Fiorina and Kasich to join Bush and Paul at the 1 delegate mark.
Flipping this over to look at “% of remaining needed to win”:
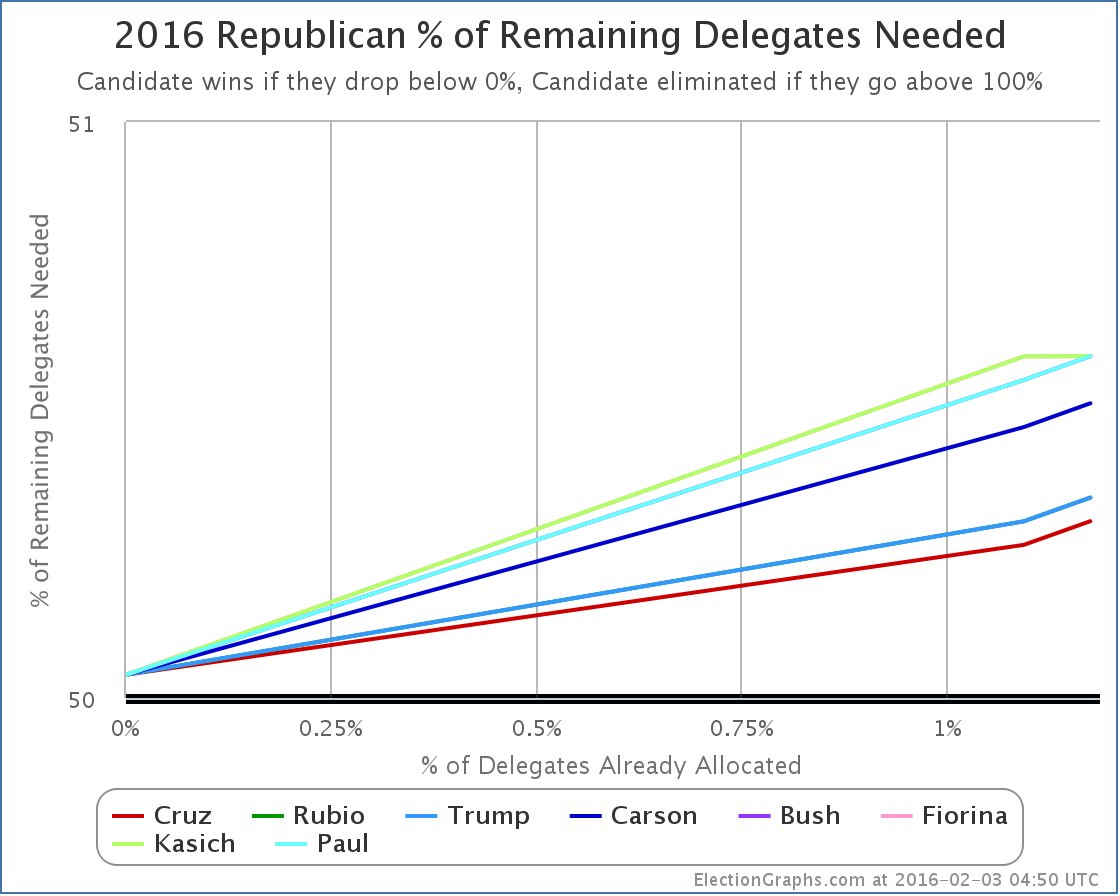
On this chart, lower is better. When you get down to 0% you win. If you get to 100% you are eliminated. Everybody is still heading upward, not downward, but it is still very early. The whole field here ranges from needing 50.31% of the remaining delegates, to needing 50.59% of the remaining delegates.
Looking specifically at New Hampshire, there are 20 delegates at stake. We are so early, and the % needed numbers so close, that this is easy. The number needed to be on track to win is 11 delegates. Anything less, and the candidate is actually going to be in a harder position in the next contest rather than an easier one.
Let’s game out New Hampshire based on the current RCP averages. Yes, yes, this is based on polling before New Hampshire. Things will change in the next six days. But this is just to model how it works.
The rules via The Green Papers:
- 20 National Convention delegates are to be bound proportionally to presidential contenders based on the primary vote statewide.
- A 10% threshold is required in order for a presidential contender to be allocated National Convention delegates.
- Allocate delegates based on the 20 Г— candidate’s vote Г· total statewide vote. Round to the nearest whole number.
- Any delegate positions that remain open are awarded to the candidate with the highest statewide vote total.
Assume each candidate gets exactly their poll average today. Only the candidates over 10% matter, so with RCP as of right now that is:
33.4% Trump, 12.2% Cruz, 10.8% Rubio, 10.4% Kasich
Converting this to delegates with the rounding rules above, you get:
7 Trump, 2 Cruz, 2 Kasich, 2 Rubio
This is only 13, so there are 7 delegates left. According to the last rule, these all go to the leader, so we end up with:
14 Trump, 2 Cruz, 2 Kasich, 2 Rubio
And therefore Trump would get 70% of the delegates despite only getting 33.7% of the vote. Trump’s line on the “% needed to win” would go down, while everybody else would go up.
After this hypothetical New Hampshire result, the overall race would be:
21 Trump, 10 Cruz, 9 Rubio, 3 Carson, 3 Kasich, 1 Bush, 1 Paul, 1 Fiorina.
Trump would still only have 42.9% of the delegates, which is not a majority, but Cruz would be way back at 20.4% and you’d have Trump starting to pull away from the pack. Still only 1.98% of delegates allocated at that point though, with lots of room for further changes.
The RCP average on February 3rd is NOT going to look like the actual results on Primary night. This is just an example.
The points to take away:
- The detailed delegate rules matter, you don’t necessarily have to win a popular vote majority to win a delegate majority.
- We’re still so very early, one contest can have a major effect on the delegate totals, and each state is very different, so don’t put much stock in extrapolating Iowa to future contests.
Of course New Hampshire will be here soon enough, and we’ll do this with the real results.
Note: This post is an update based on the data on ElectionGraphs.com. Election Graphs tracks both a poll based estimate of the Electoral College and a numbers based look at the Delegate Races. All of the charts and graphs seen in this post are from that site. Additional graphs, charts and raw data can be found there. All charts above are clickable to go to the current version of the detail page the chart is from, which may contain more up to date information than the snapshots on this page, which were current as of the time of this post. Follow @ElectionGraphs on Twitter or like Election Graphs on Facebook to see announcements of updates or to join the conversation. For those interested in individual general election poll updates, follow @ElecCollPolls on Twitter for all the polls as they are added.
On Curmudgeon’s Corner this week, Sam and Ivan talk about, what else, the presidential race. On the Republican side: What is up with Sarah Palin? Does Trump really represent conservatism? That Cruz eligibility thing. And more. On the Democratic side: Does Sanders have a chance? Will Clinton’s negativity backfire? The Idealism vs Pragmatism conflict. And more. Then a sharp turn away from politics and for some reason they talk about Star Wars for 15 minutes. Shrug. Oh yeah, and WiFi sucks.
Click below to listen or subscribe… then let us know your own thoughts!
Recorded 2016-01-22
Length this week – 1:25:39
1-Click Subscribe in iTunes
View Podcast in iTunes
View Raw Podcast Feed
Download MP3 File
Follow the podcast on Facebook
Show Details:
- (0:00:10-0:03:41) Intro
- Agenda
- Listener Request
- Boring Lives
- (0:04:21-0:42:31) Election 2016 – Republicans
- Sarah Palin
- WiFi Sucks
- Sarah Palin again
- Trumpism and Palinism vs Conservatism
- Establishment coming around to Trump?
- Dynamics approaching Iowa
- Will anybody stop Trump?
- Cruz eligibility
- Trump foreign policy
- (0:43:34-1:07:13) Election 2016 – Democrats
- Clinton will win…
- …unless she screws it up
- Negativity backlash?
- Base vs Centrist divide
- Embracing Obama
- Iowa and New Hampshire
- Hillary in trouble freakout
- How might Clinton blow it?
- Sanders vs Trump?
- National Review’s anti-Trump issue
- (1:08:23-1:25:19) Star Wars Lightning Round
- Movie: Star Wars – The Force Awakens (2015)
- Lucas Sour Grapes
- What was wrong with the prequels?
- Where is Rey?
- Kylo Ren
- Feedback
My primary race delegate tracking for both parties will be out very soon… promise. In the mean time, rather than just looking at the delegate leaders on each side against each other, we continue to concentrate on the five best polled candidate combinations.
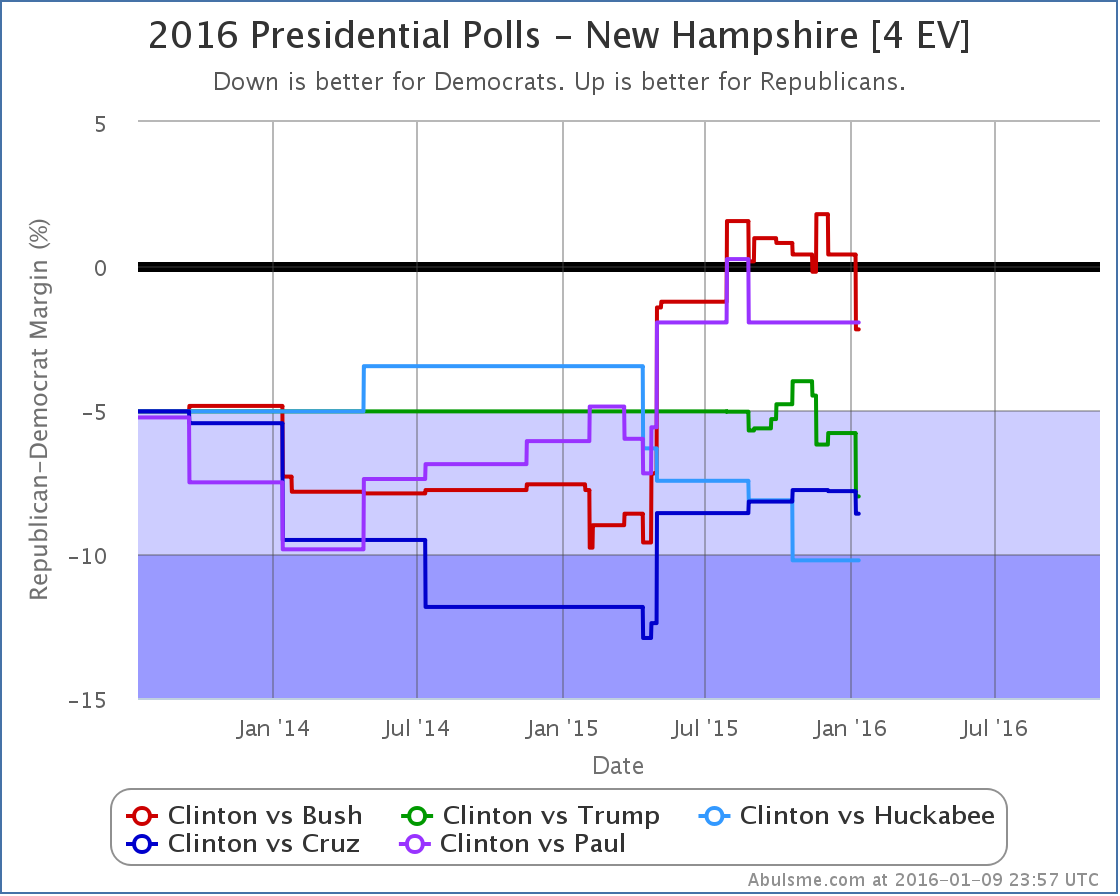
With a batch of new polls added in North Carolina, Florida, and New Hampshire, it starts to look like the long trend of Clinton getting weaker and weaker against a wide variety of Republican rivals may have ended. Maybe. For now. A little bit. Things will change before we are done. Polls like these aren’t predictive of the general election until after the conventions. Caveat caveat caveat.
Lets look at each category change by state:
Florida (29 EV)
Of the best five polled candidate combinations, two Republicans have their positions deteriorate against Clinton in this update, Bush and Rubio:
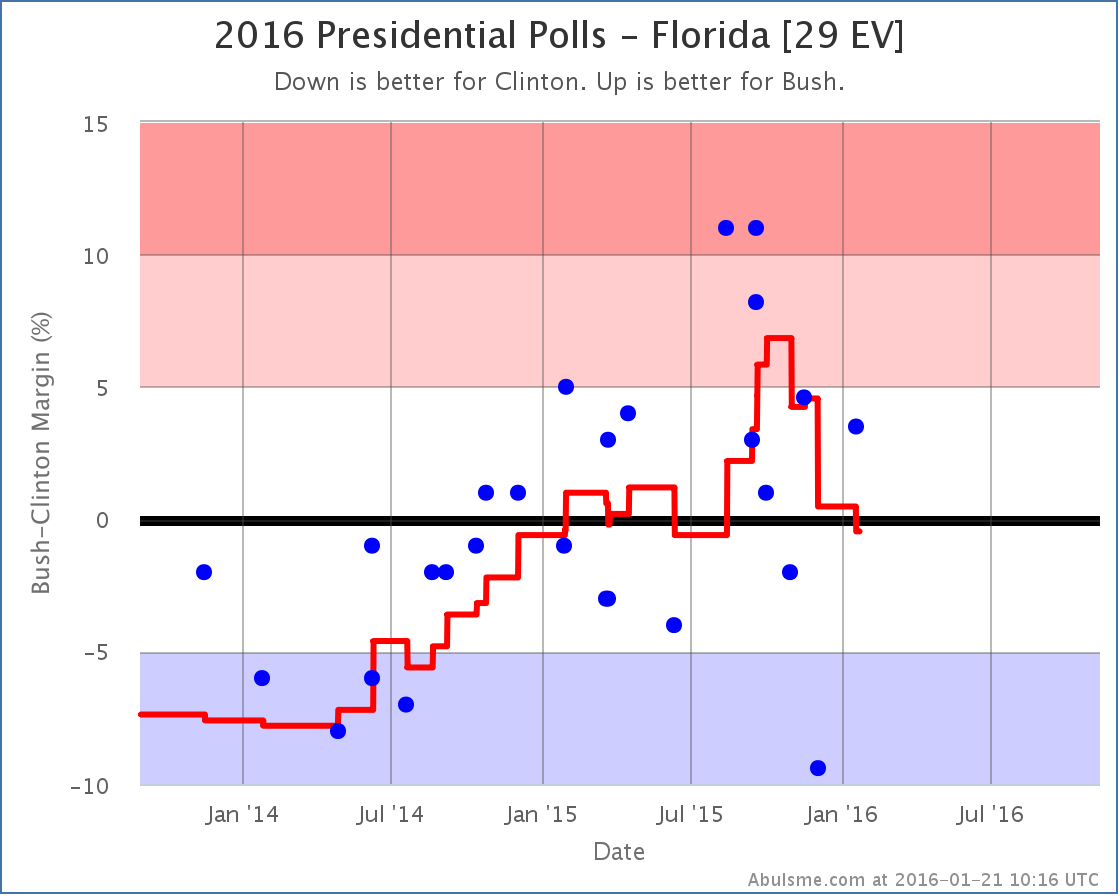
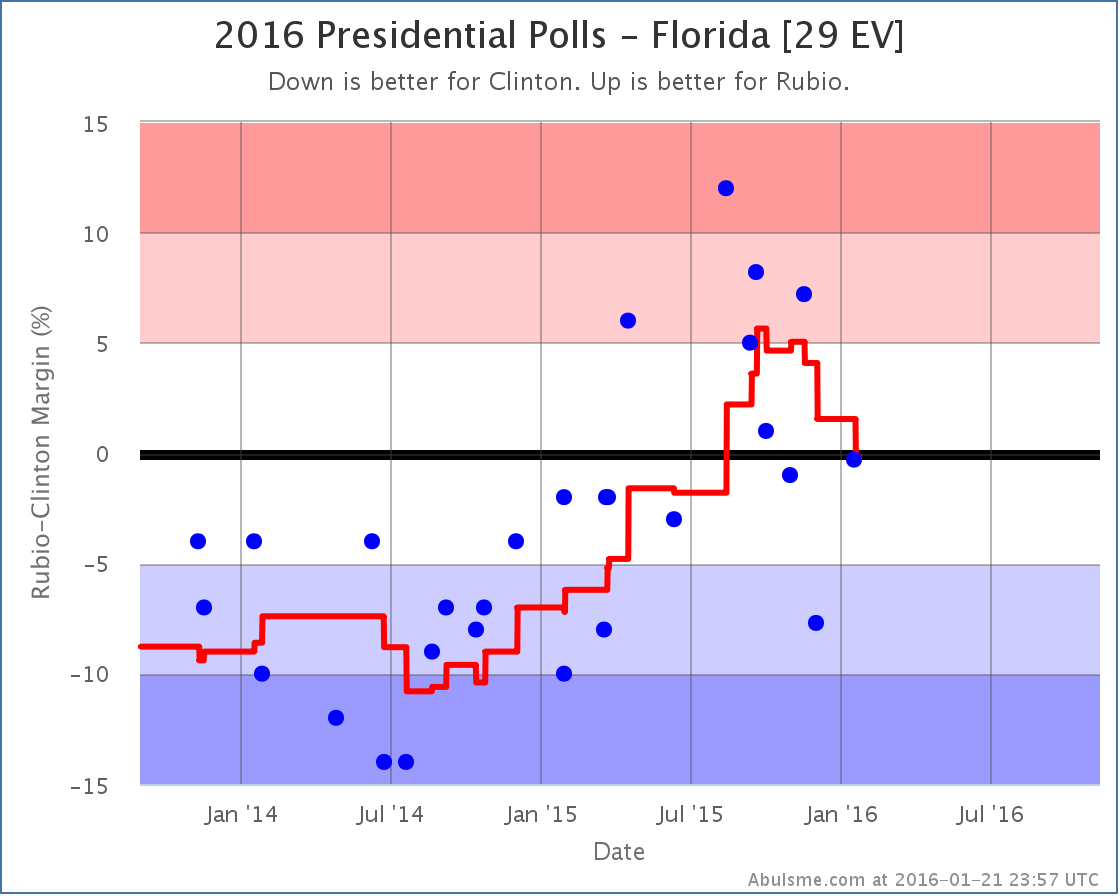
Both candidates seemed to peak in late September or early October, and since then have been weakening. With the latest set of poll updates, both states move from being weakly on the Republican side of the line, to being Weak Clinton. The “weak” here should be emphasized. Clinton’s lead over Bush in the average is only 0.5%, and over Rubio it is only 0.2%. This is about as close as you can get. Since for the analysis here any lead under 5% is considered as one that could easily disappear overnight, at these even smaller margins, this is essentially a tie. But for the last few months, the movement has been in Clinton’s direction.
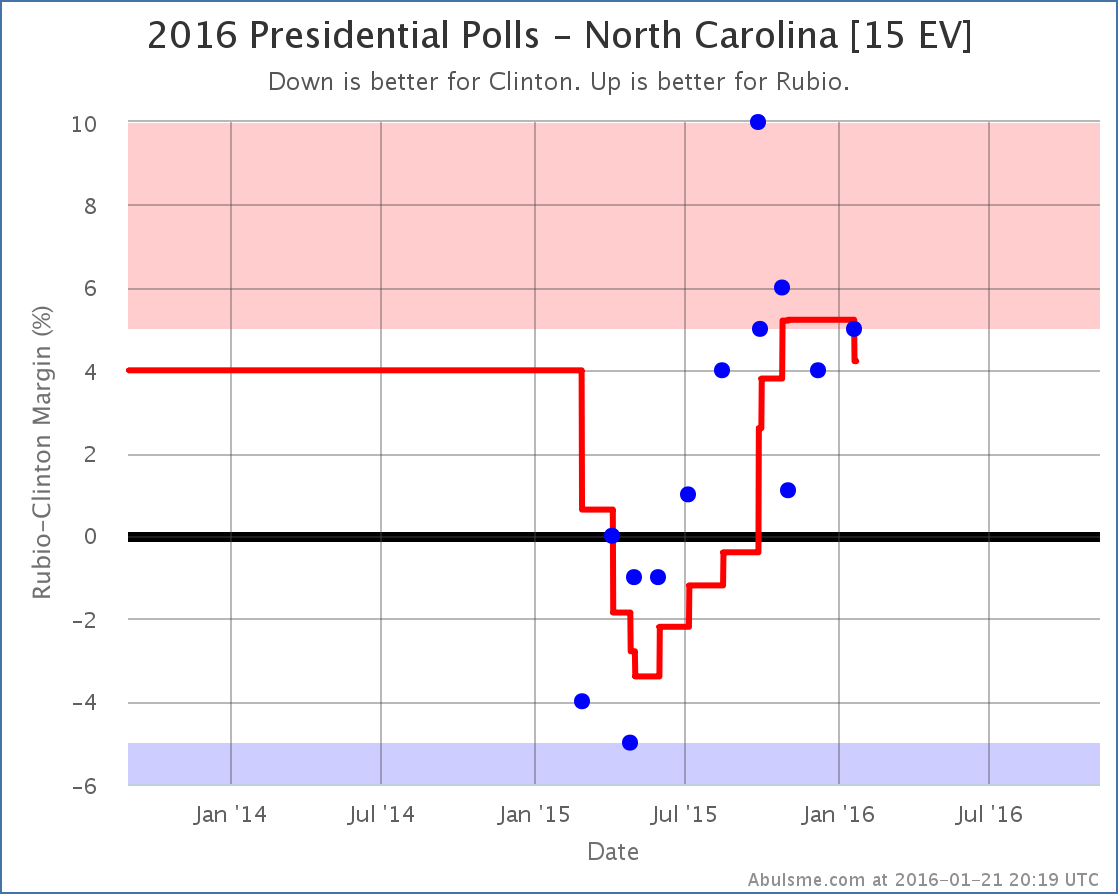
North Carolina (15 EV)
In North Carolina, once again Bush and Rubio lose ground to Clinton. Although technically with the current update Clinton vs Trump dropped to the 6th best polled candidate combination, I know the Trumpets will want to hear about how he is doing, so I’ll mention that Trump also weakens in North Carolina. Yes, yes, I know that any such indications are just propaganda from the vast establishment conspiracy of which I am a part. But anyway… looking at the charts:
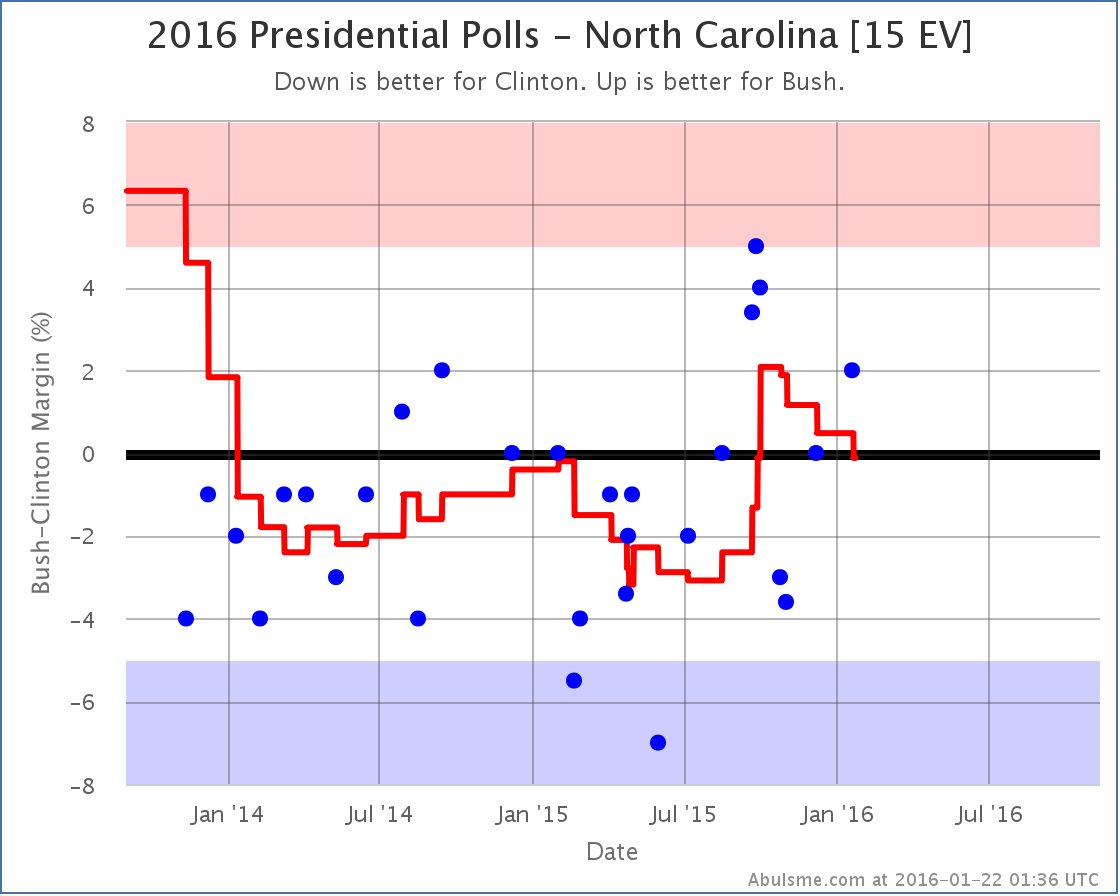
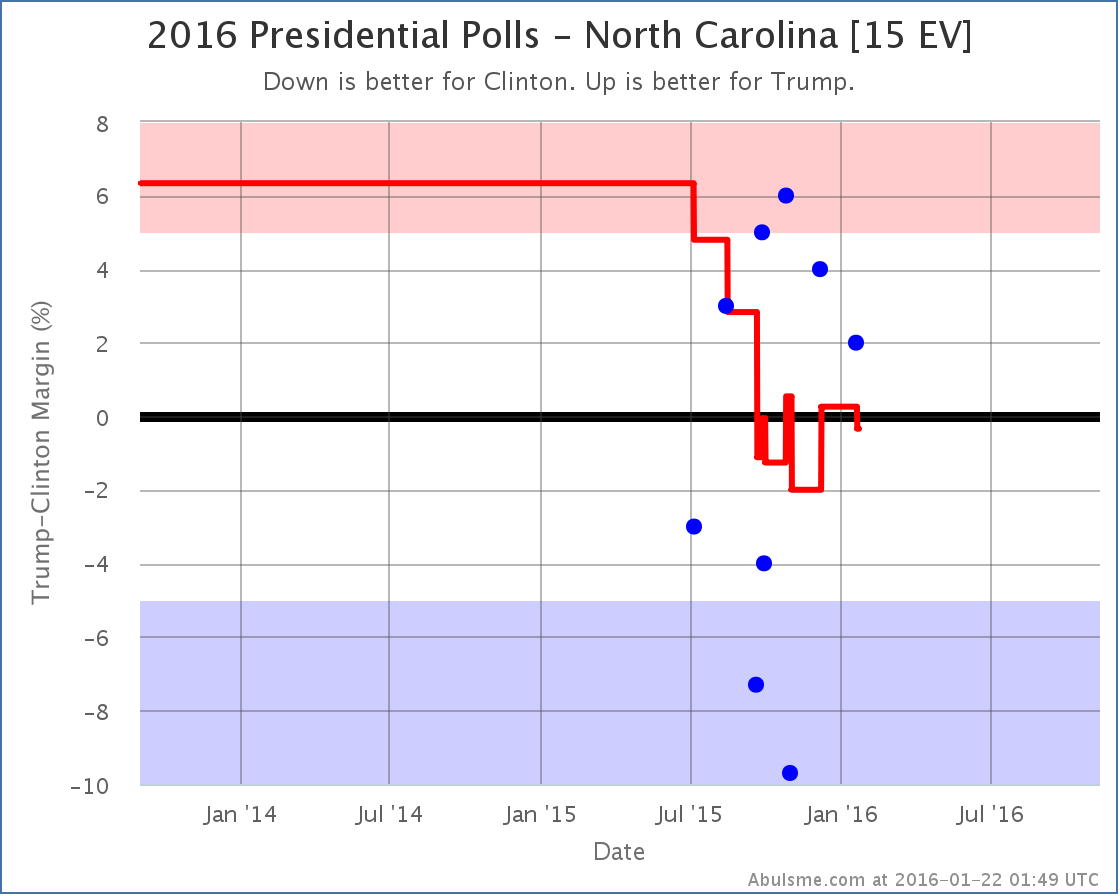
In this case the averages for Bush and Trump against Clinton move from Weak Republican to Weak Clinton, but once again the “weak” is the key here. Clinton leads Bush by 0.1% and Trump by 0.3%. So again, super close. A move from just barely on one side of the line to just barely on the other side of the line isn’t really too meaningful except if it seems part of a larger movement. In the case of Bush, the average seems to have been moving toward Clinton for several months. In the case of Trump, it is more bouncing around in a range over the past few months.
Rubio does a bit better here. North Carolina had actually been in the “Strong Rubio” category for a few months, with the poll average showing a Rubio lead of over 5%. With the latest update, Rubio’s lead slips under 5% to 4.2%, which means I once again consider North Carolina a state that could go either way in this matchup, but Rubio still has a lead.
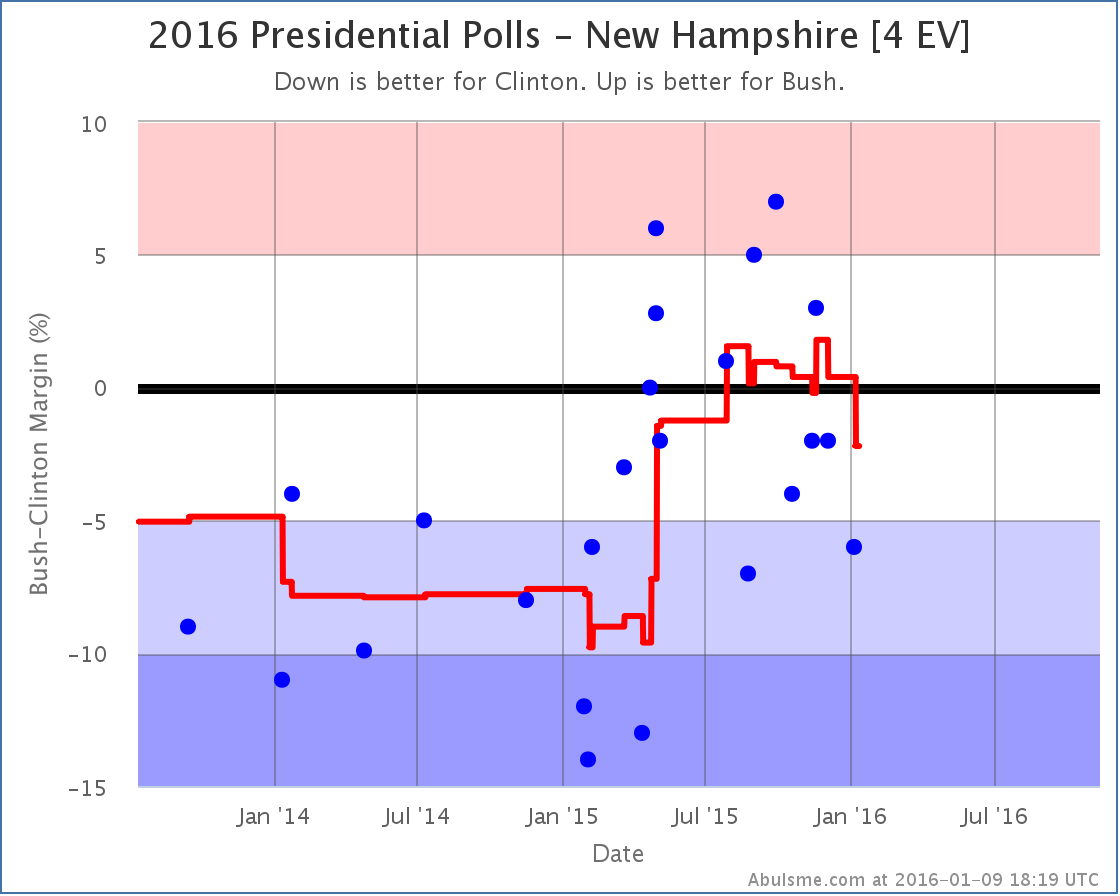
New Hampshire [4 EV]
New Hampshire is the one state that has good news for the Republicans in this update. No category changes for Bush, Rubio, or Trump… but this time Cruz jumps into a new category.
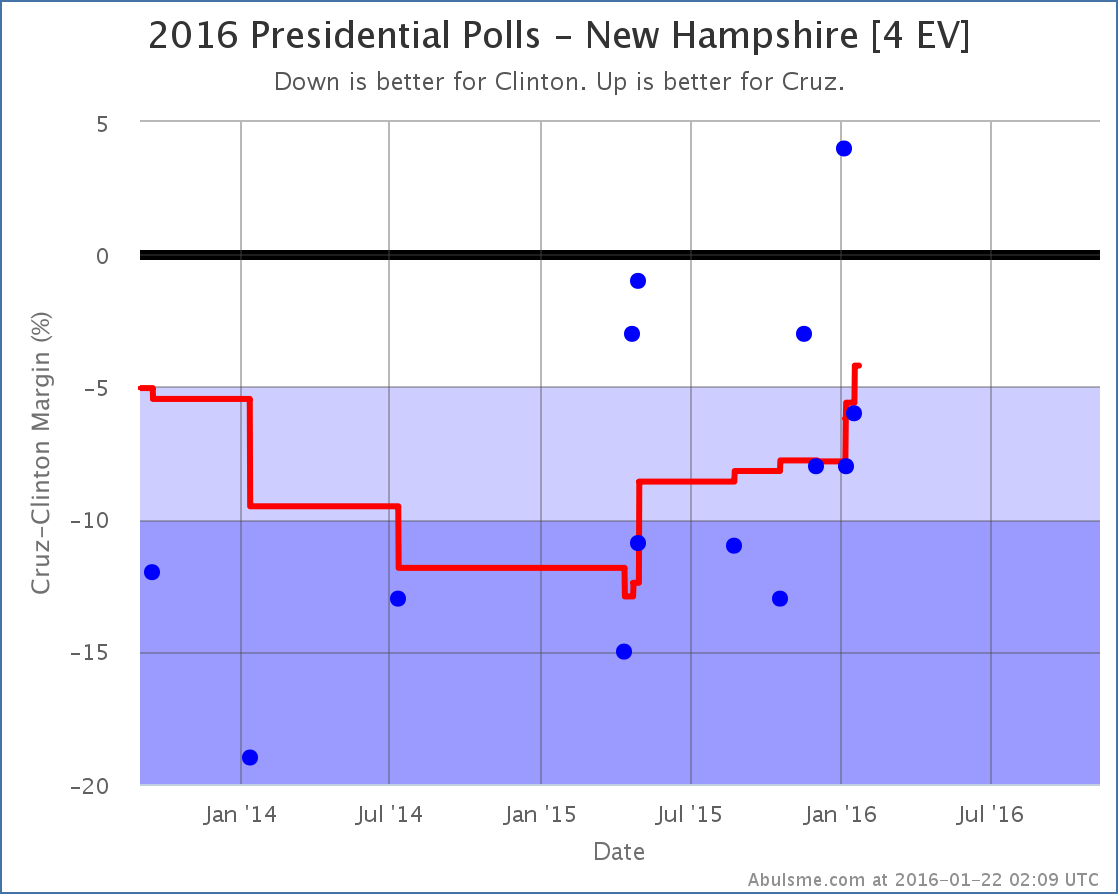
Cruz’s recent movement in New Hampshire is the opposite of the trends we were looking at for the other candidates in the other states. Cruz is gaining on Clinton in New Hampshire. For the first time, the state starts to look competitive in this match up. Clinton is still up 4.2% in the average, but now it is conceivably within reach for Cruz.
National Ranges
So with all these various changes, what do things look like nationally for all these candidate pairs? Here we go:
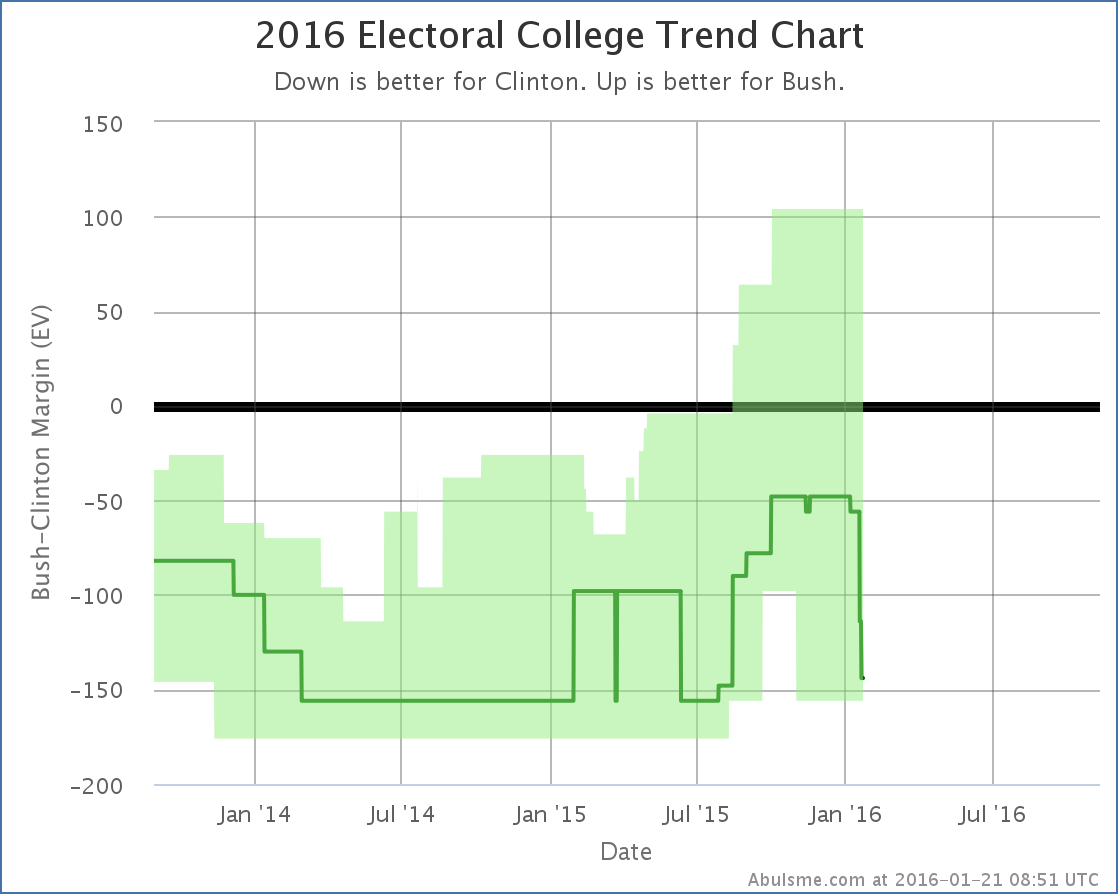
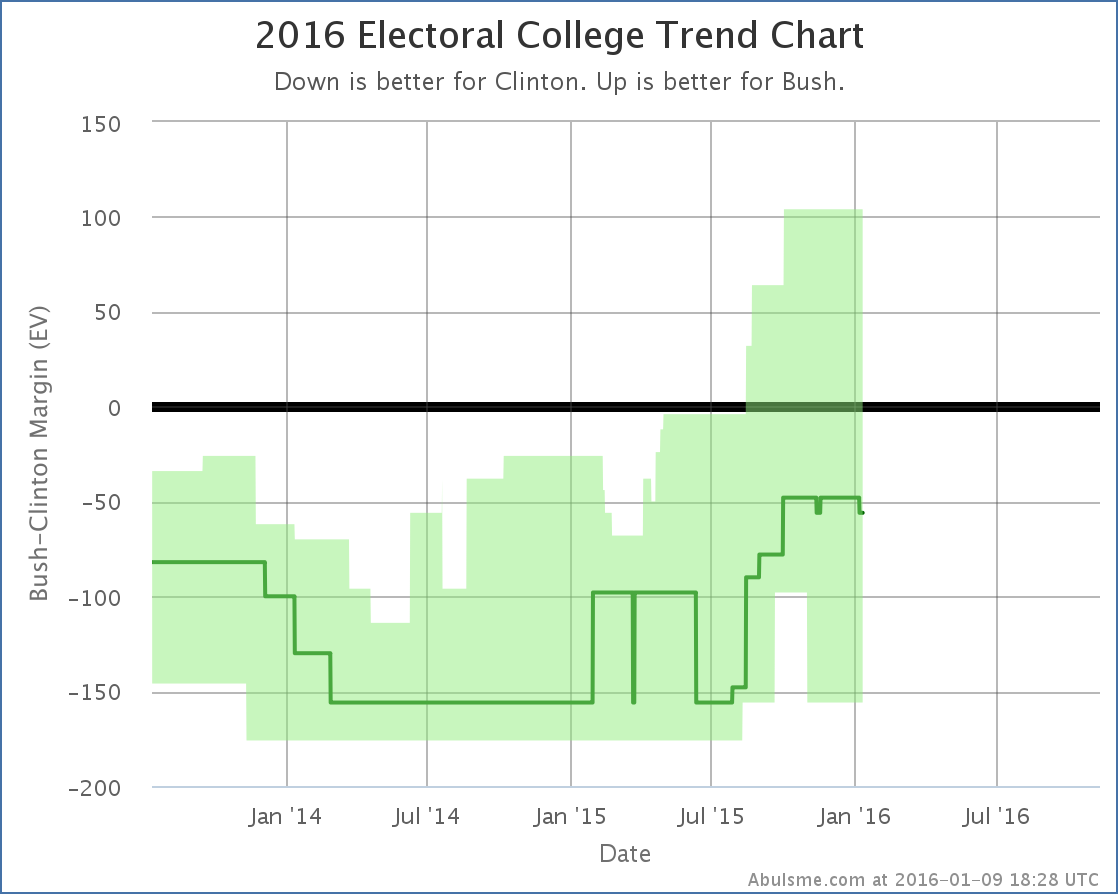
With Florida and North Carolina back out of his column, the result if everybody just wins the states they are ahead in now sits at Bush losing by 144 electoral votes. If he manages to flip the states where Clinton is ahead by less than 5% he could still win by up to 104 electoral votes though, so while Bush is behind, this is still a race.
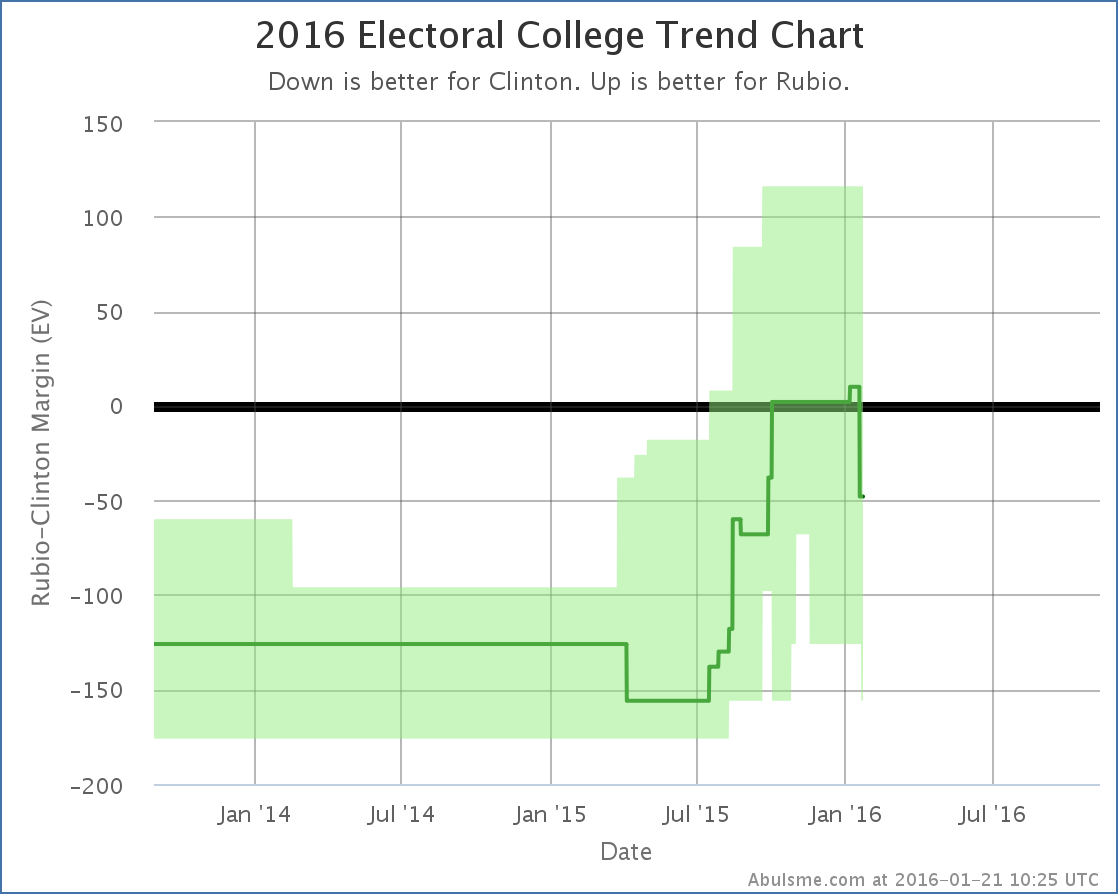
Before this update, Clinton vs Rubio was actually expected to be a narrow 10 electoral vote Rubio win. But if you take Florida away, that changes into a 48 electoral vote loss. With North Carolina also now considered a possibility for Clinton, Clinton’s “best case” improves to a 156 electoral vote win. Rubio’s best case is still a 116 electoral vote win though, so this matchup is also a real race that could go either way.
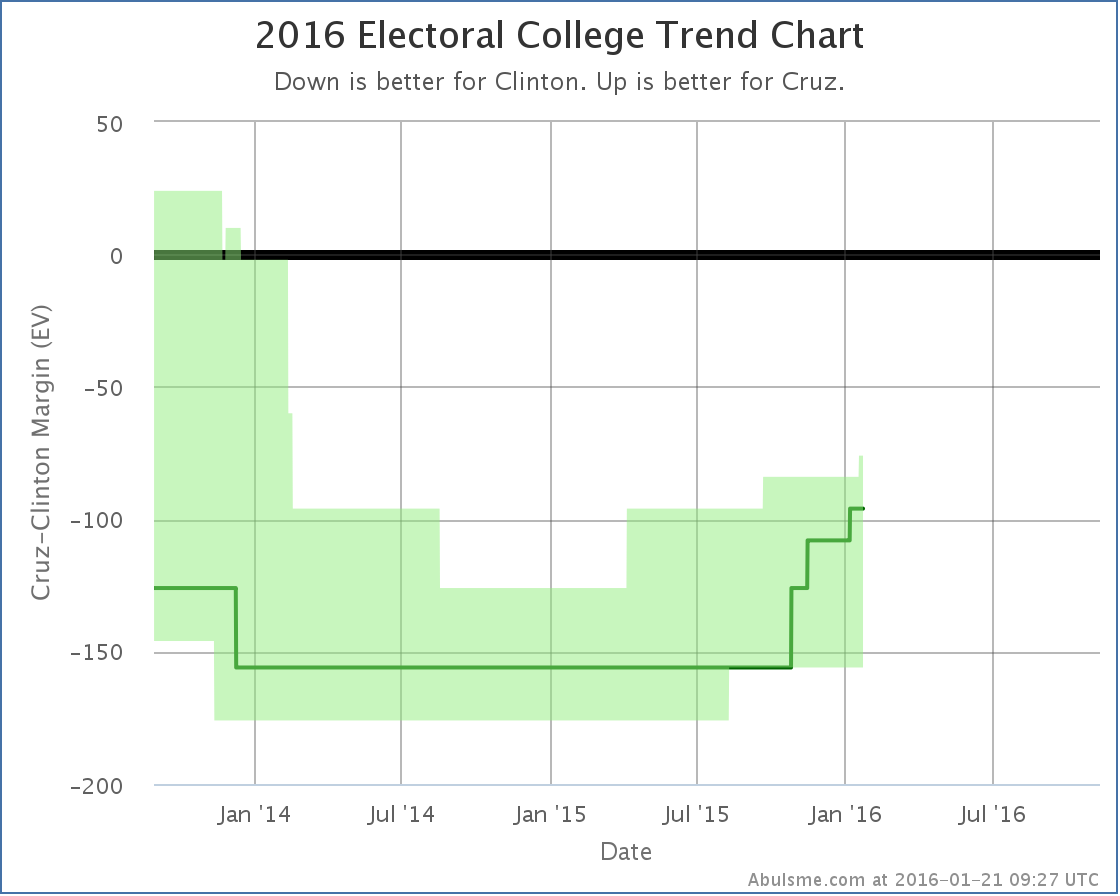
On the other hand… making New Hampshire possible brings Cruz’s best case… where he wins every state he is ahead in, plus all the states where Clinton’s lead is less than 5%… to Cruz losing by 76 electoral votes. This is better than it was. Cruz has been improving since last spring. But he is still not yet in a place that would make a Clinton vs Cruz race even competitive. Right now that matchup looks like an easy Clinton win.
Now, the Real Clear Politics average for Clinton vs Cruz actually shows Cruz ahead of Clinton right now. (Rubio too.) How does this mesh? First thing to note is that the state level polling that the estimates on this site are based on are still not happening quickly enough to show national movement that happens on timeframes less than a few months. So it is quite possible there has been a recent move just isn’t reflected in the state numbers yet. If so, if Cruz ends up the nominee, there will be a lot more polling, and we’ll see the state level analysis move toward the national numbers as more data becomes available. It is of course also possible that Cruz’s support is distributed between states in such a way that gives him a popular vote advantage while still leaving him behind in the electoral college. To be frank though, that is less likely.
Given that, it is reasonable to think that perhaps the gains Cruz showed in the New Hampshire update today are quite likely happening in other states as well, there just isn’t the polling available yet to show it on a state by state basis. So Cruz may be stronger than he appears on this chart.
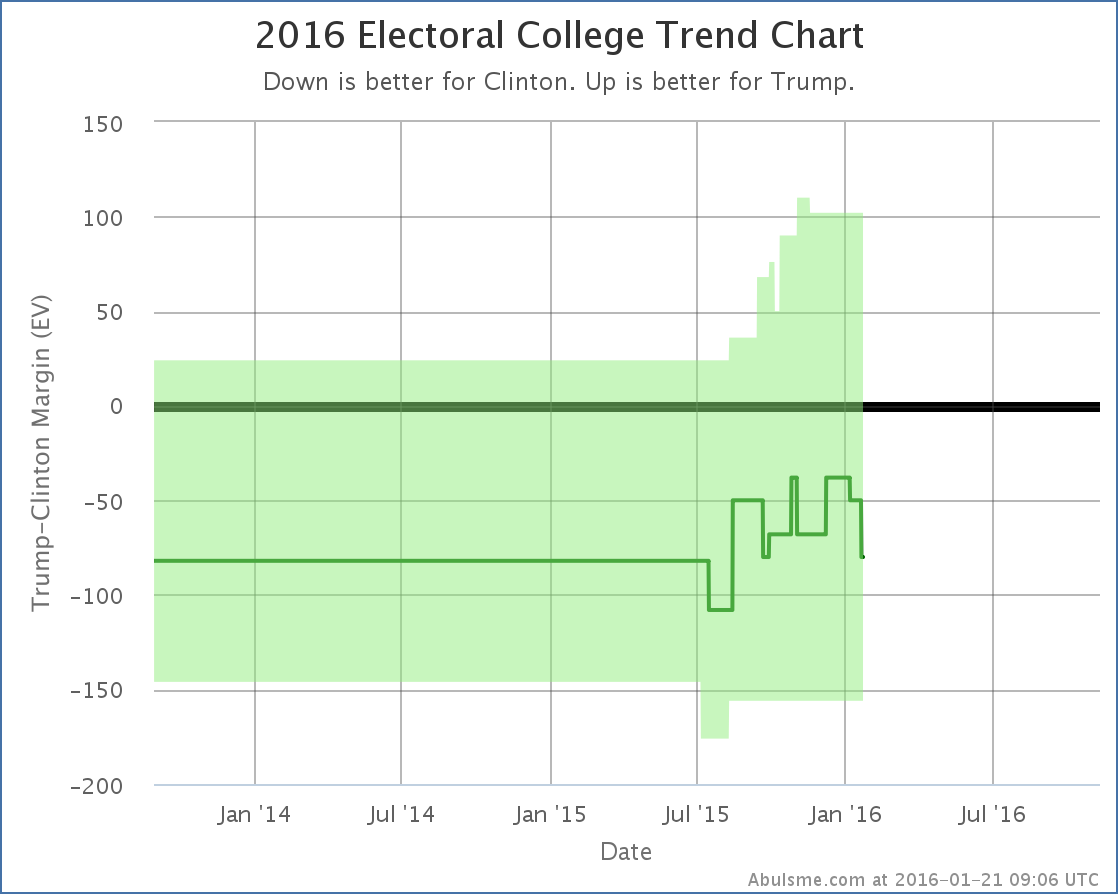
There really wasn’t polling on Trump before this summer, so most if not all of the movement seen here is not real movement, but just the process of getting enough polls to have a reasonable picture of how Trump is doing. The “expected” case doesn’t show a real trend, it has just bounced around a bit. Trump’s best case kept improving as more polls became available. At the moment, the state poll averages show a Clinton vs Trump race could reasonably be anywhere from a 156 electoral vote Clinton win to a 102 electoral vote Trump win, with the “expected case” being an 80 electoral vote win by Clinton. But this matchup DOES look like a real race, not a Clinton rout. Trump does better against Clinton than either Cruz or Bush. Of these four, only Rubio does better.
Or course, I should repeat all the usual caveats again. See the top of this post. There is still lots of time. Everything can and will change over the next few months.
291.9 days until the polls start to close. 11 days until the Iowa caucuses.
This whole thing is going to start moving very quickly very soon.
PS for Sanders fans: Although no match up vs Sanders has been polled enough to talk about in detail here, with today’s updates Sanders strengthened vs Rubio in North Carolina, while weakening against both Rubio and Cruz in Florida.
Note: This post is an update based on the data on ElectionGraphs.com. All of the charts and graphs seen here are from that site. Graphs, charts and raw data can be found there for the race nationally and in each state for every candidate combination that has been polled at the state level. In addition, comparisons of the best polled candidate combinations both nationally and each in each state are available. All charts above are clickable to go to the current version of the detail page the chart is from, which may contain more up to date information than the snapshots on this page, which were current as of the time of this post. Follow @ElecCollPolls on Twitter for specific poll details as I add them. And like Election Graphs on Facebook!
On this week’s Curmudgeon’s Corner, Sam and Ivan catch up with the developments of the last few weeks for the Presidential race. They cover all the dynamics on the Republican side, and discuss if Sanders really is a threat to Clinton on the Democratic side. In the lightning round, a round up of some other recent news… Chinese markets, Iran and Saudi Arabia, CES, Y’all Qaeda in Oregon, book and TV show reviews, and more!
Click below to listen or subscribe… then let us know your own thoughts!
Recorded 2016-01-14
Length this week – 1:36:59
1-Click Subscribe in iTunes
View Podcast in iTunes
View Raw Podcast Feed
Download MP3 File
Follow the podcast on Facebook
Show Details:
- (0:00:10-0:14:19) Intro
- (0:15:07-0:42:25) Election 2016 – Republicans
- Internet Slowdowns
- Iowa Polls
- Trump’s Cruz Birtherism
- Likely Voter Models
- Rapid Poll Movements
- Kasich surge?
- Debates
- Candidates Dropping Out
- Contested Convention scenarios
- State by State Delegate Rules
- (0:43:02-0:59:45) Election 2016 – Democrats
- More on Republican delegate allocation in Iowa and New Hampshire
- Clinton lead slipping
- Why the late Sanders surge?
- What if Clinton loses both Iowa and New Hampshire?
- Clinton superdelegate advantage
- Media bias toward a close race
- Possible Clinton meltdowns
- Trump’s position vs Clinton’s position
- (1:00:48-1:36:39) Lightning Round
- Book: Conversations with Myself
- TV Series: Star Trek (TOS) [1966-1969]
- If you disagree, you just aren’t listening
- Iran / Saudi Arabia
- Iran and the Navy boats
- CES
- Y’all Qaeda
- Secretary Carter’s Email
- Twitter Character Limit
- Other things we missed
Election Graphs will be rolling out our primary delegate race coverage before the Iowa caucuses, but in the mean time, we’ve just had the first state level general election polls of the New Year. It is a PPP poll in New Hampshire. There was only one candidate pair where the new polls changed my classification of New Hampshire though.
Clinton vs Bush
For all but a few days in November, Bush had held a lead against Clinton in my poll averages since the end of July. Just barely. But he had hung onto that lead. With the latest poll though, Clinton leads in four of the last five polls, and by enough to take a lead in the average. New Hampshire moves from “Weak Bush” to “Weak Clinton”. The lead is still slim at 2.2%, so the state is still very much in the “could easily go either way” category, but it is enough to put New Hampshire back in Clinton’s column in the case where we give each state to the current leader.
That little notch downward on the center line at the right hand side of the bubble is New Hampshire flipping to Clinton. We go from Clinton winning by 48 electoral votes, to Clinton winning by 56 electoral votes. Either way, Clinton is ahead, but the election is within the “bubble of uncertainty” since if you give Bush all the states where Clinton is ahead, but by less than 5%, Bush wins by 104 electoral votes.
A Clinton vs Bush matchup could go either way.
But, if the primary polls are to be believed, at this point Clinton vs Bush is a relatively unlikely scenario, so even though there were no other category changes, lets take a quick look at how the latest polls affected some of the other matchups.
New Hampshire Matchup Comparison
Looking at the five best polled candidate combinations nationally, the latest New Hampshire poll included three of the five (Bush, Trump and Cruz). In all three cases, the Republican weakened vs Clinton.
For Trump and Cruz though, this just meant Clinton’s already strong lead in New Hampshire got stronger. It makes no difference what so ever to their possible races against Clinton if they were to win the nomination.
Aside from Bush, the only one of these five that makes New Hampshire close is Paul, but that should be taken with a big grain of salt because he hasn’t been included in a general election match up poll in New Hampshire since August. So that data is a bit stale.
Looking beyond the top five though, to what is currently the sixth best polled combination by my metric, you actually see another candidate that makes New Hampshire close with Clinton, and in fact in that case the latest polls actually improved the Republican’s average. That would be Clinton vs Rubio:
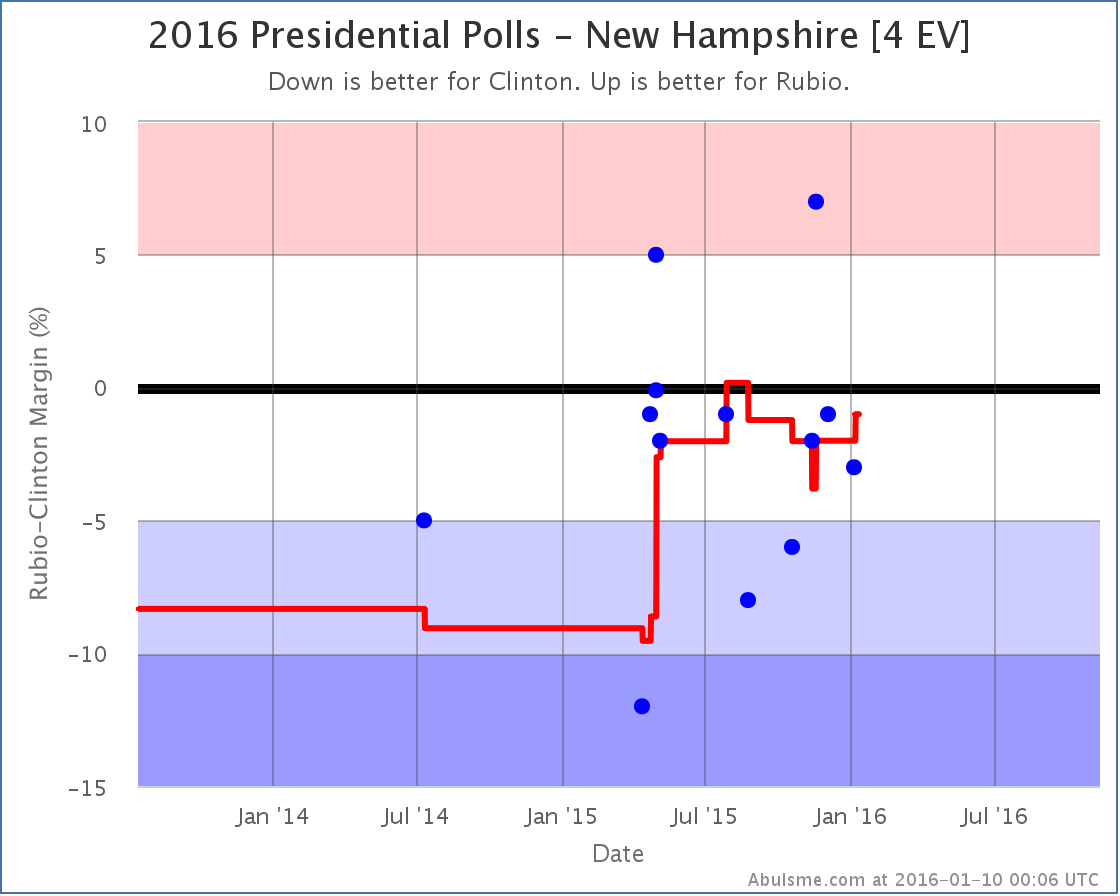
Of the 10 candidate pairs included in the latest polls… Clinton and Sanders vs Bush, Carson, Cruz, Rubio and Trump… Clinton vs Rubio is the only combination where the Republican’s poll average improved.
Does this imply larger things for the country at large? No, not really. New Hampshire is a special case in many ways. It is getting a huge amount of attention right now due to the upcoming primary. What is going on there right now in terms of public opinion may or may not be reflected in trends elsewhere.
So, as usual, we need to just wait for more polls. Which states get polled in the next few months is probably going to be highly influenced by the primary calendar as well, so the picture we see in the state polls will be warped a bit by that.
And of course once we have actual delegate numbers in both parties showing which candidates are actually leading in the nomination races, it starts changing perceptions of the general election, which may in turn cause more movement in the state polls.
Keep checking in with Election Graphs. We’ll be launching our delegate tracking soon, and it looks like the kind of election cycle where watching the delegate situation carefully may actually be needed.
In other words, we’re almost at Iowa, and things are going to get crazy. Hold on and have fun!
304.0 days until the general election polls start to close.
Note: This post is an update based on the data on ElectionGraphs.com. All of the charts and graphs seen here are from that site. Graphs, charts and raw data can be found there for the race nationally and in each state for every candidate combination that has been polled at the state level. In addition, comparisons of the best polled candidate combinations both nationally and each in each state are available. All charts above are clickable to go to the current version of the detail page the chart is from, which may contain more up to date information than the snapshots on this page, which were current as of the time of this post. Follow @ElecCollPolls on Twitter for specific poll details as I add them. And like Election Graphs on Facebook!
I’ve mentioned a number of times at this point that Clinton has had a long streak of bad news. The last time one of my updates was unambiguously positive for Clinton was back in May! That streak ends today, with movement in New Hampshire prompted by a new PPP poll.
Three of the top five best polled candidate combinations flipped from “Weak Republican” to “Weak Clinton” because of this update:
So for Rubio, Paul and Walker, New Hampshire flips back to blue (although not by much). Clinton vs Bush just narrowly avoided doing the same thing, as Bush’s margin declined from 1.6% to 0.2%, but didn’t quite pass over the line.
New Hampshire is a little state. Only 4 electoral votes. If you look at the “expected cases” this just makes a small move for each of these three candidates:
As a move, this isn’t all that much. And Clinton is significantly ahead on this metric against all five Republicans. So New Hampshire’s electoral votes aren’t determining the outcome here.
But after three months solid of posts where I’ve been talking about how the Republican position is getting stronger, and Clinton’s position was getting weaker, is there significance to a move, any move, actually going in Clinton’s direction? Well, maybe. But one point does not make a trend.
This could be an indicator that Clinton has bottomed for now and we’re not going to see further declines for the time being. Or, just as easily, perhaps these PPP results are a significant outlier, and not representative of an actual change of mood in New Hampshire, in which case the next New Hampshire polls may pull the state back into the red zone.
As usual, we will just have to wait and see. In the meantime though, Clinton’s losing streak has been broken.
493.0 days until polls start closing.
Note: This post is an update based on the data on ElectionGraphs.com. All of the charts and graphs seen here are from that site. Graphs, charts and raw data can be found there for the race nationally and in each state for every candidate combination that has been polled at the state level. In addition, comparisons of the best polled candidate combinations both nationally and each in each state are available. All charts above are clickable to go to the current version of the detail page the chart is from, which may contain more up to date information than the snapshots on this page, which were current as of the time of this post. Follow @ElecCollPolls on Twitter for specific poll details as I add them.
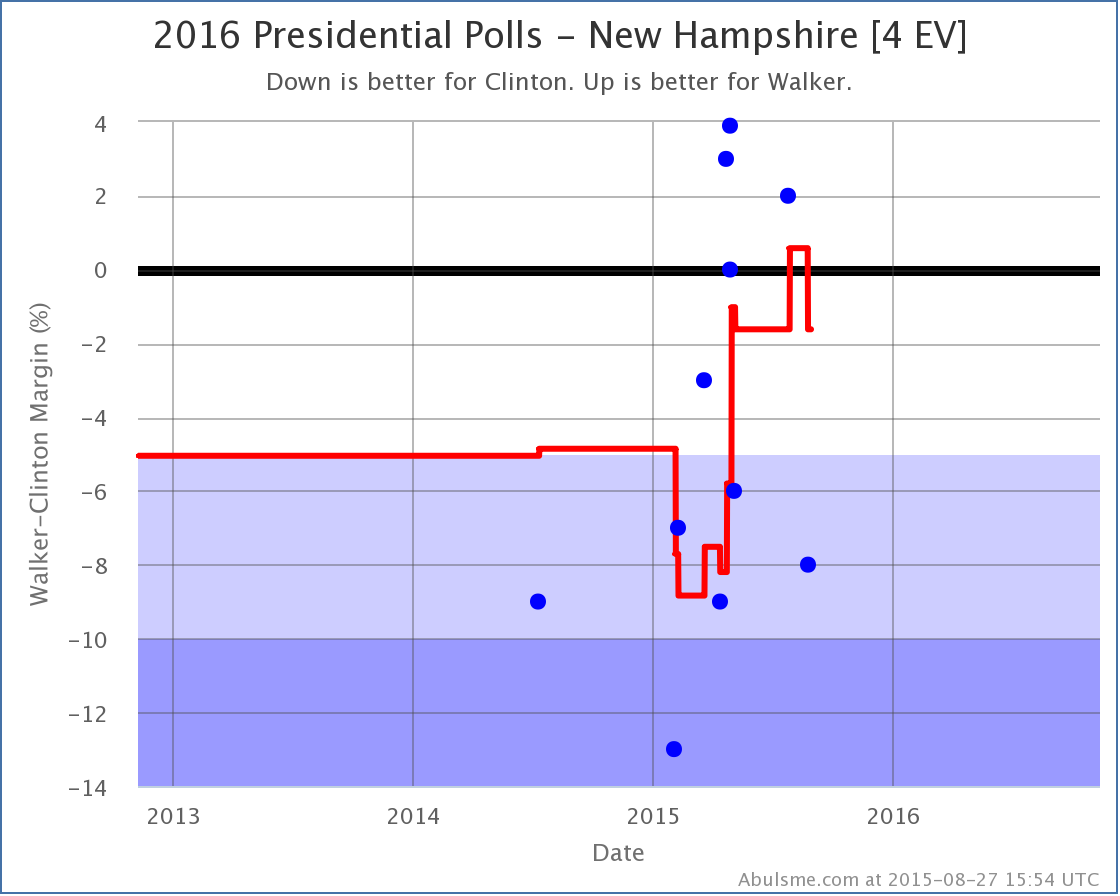
First of all, a little bookkeeping. With the latest batch of polls, the “five best polled candidate combinations” gets shuffled up a bit. Clinton vs Huckabee falls off the top five (bye Huck!), replaced by Clinton vs Walker. Meanwhile, Clinton vs Rubio moves into the “best polled” slot, becoming the default view on the election2016.abulsme.com site. So, for the moment, that means the candidate combinations I’ll talk about in these updates are Clinton vs Rubio, Paul, Bush, Walker and Christie. Huckabee honestly is very close behind in the #6 spot. After that though there is a pretty big gap in polling before we get to the next combinations. There may be lots of talk about Trump lately. Or of Biden or Sanders as Clinton alternatives. Or of the other ELEVEN Republican candidates. But in comparison to the combinations I mentioned earlier, state level polling involving those folks is still pretty sparse. We’ll talk about the rest of the candidates if and when there is good enough polling on them to get them into the top five. Or at least close.
OK, with that out of the way, the main news from the latest polls. Specifically, with a WMUR poll in New Hampshire added in, this happened:
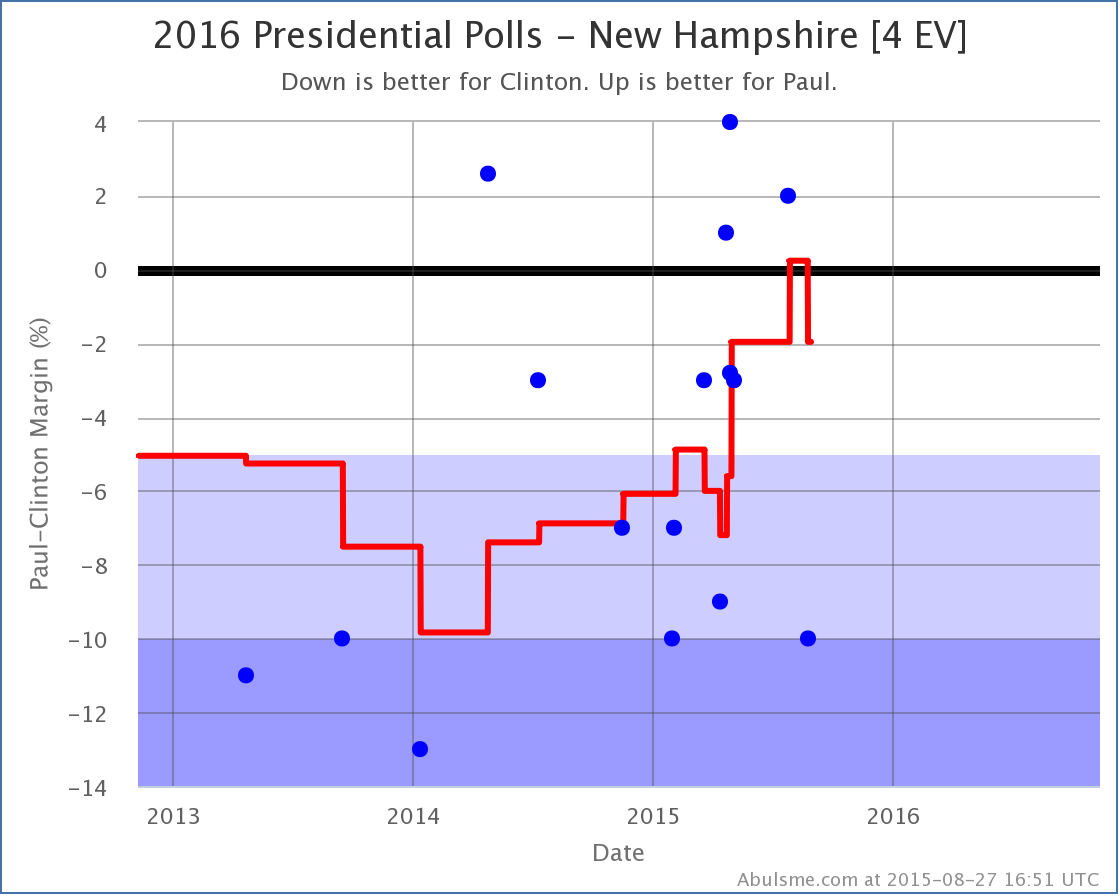
Rubio, Paul, Bush, and Walker all took the lead in New Hampshire as measured by my poll average. Just barely. But still. They are now in the lead. Christie wasn’t polled this time, but was lagging the others quite a bit anyway.
Just a few months ago, New Hampshire was looking like it was pretty reliably “Strong Clinton” against almost all Republican challengers. (The exception being Christie amusingly enough, since he is now the weakest of the bunch.) This is a pretty big move. It seems to be parallel across many candidates, so it is likely this is more a case of Clinton getting weaker than anything any Republican candidate is doing specifically.
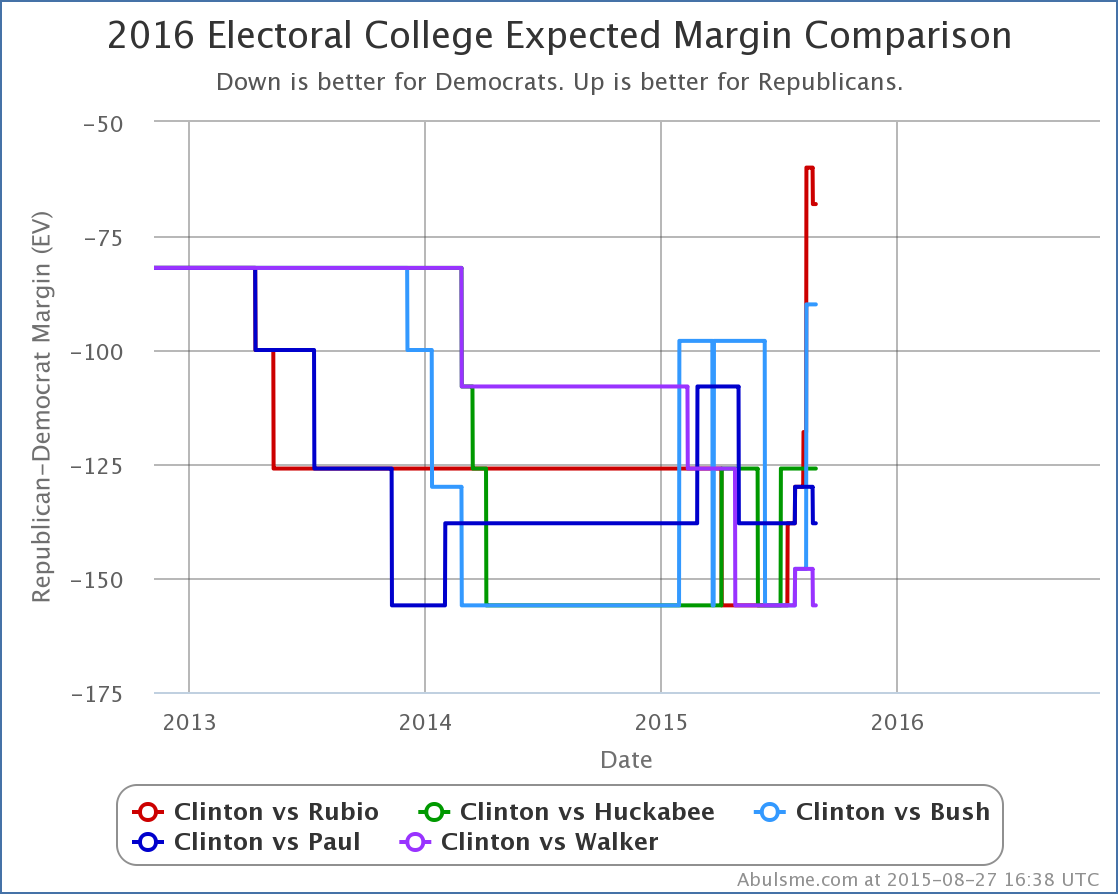
So what does New Hampshire flipping do to the “expected” results if the election was held today?
Well, OK, a couple bumps there at the end. Even with this though, this particular chart doesn’t show a clear trend. All the lines are bouncing around, but aren’t clearly trending in one direction or another.
But, looking more generally at my Electoral College updates, the last time I did one that was fully and unreservedly about something moving in Clinton’s direction was in May! From the end of May, through June, through July, and now into August, every update has been about Republican gains. (There were a couple Clinton gains in the mix, but there were always overshadowed by moves toward the Republicans that happened at the same time.)
Despite this, everything points to Clinton still being way ahead overall. As one example of this, even with New Hampshire, none of the five candidates on the chart above even match Romney’s performance in 2012. The best of the bunch in “expected result”, Rubio and Paul, still lose to Clinton by 130 electoral votes.
Clinton can’t be happy with the trend though. Yes, things are expected to tighten. But I’m sure she would prefer if they didn’t anyway!
We still have lots of time until the election. The first Republican debates are coming up later today. Obviously the main thing people will be watching for are how it may impact the standing of the various candidates in the Republican race, but Democrats and Independents are watching too, so don’t be surprised if there are effects on the general election matchup too.
And of course, this is just the beginning of debate season. Many more to come…
460.7 days until the first general election polls close.
Note: This post is an update based on the data on my 2016 Electoral College Analysis Site. All of the charts and graphs seen here are from that site. Graphs, charts and raw data can be found there for the race nationally and in each state for every candidate combination that has been polled at the state level. In addition, comparisons of the best polled candidate combinations both nationally and each in each state are available. All charts above are clickable to go to the current version of the detail page the chart is from, which may contain more up to date information than the snapshots on this page, which were current as of the time of this post. Follow @ElecCollPolls on Twitter for specific poll details as I add them.
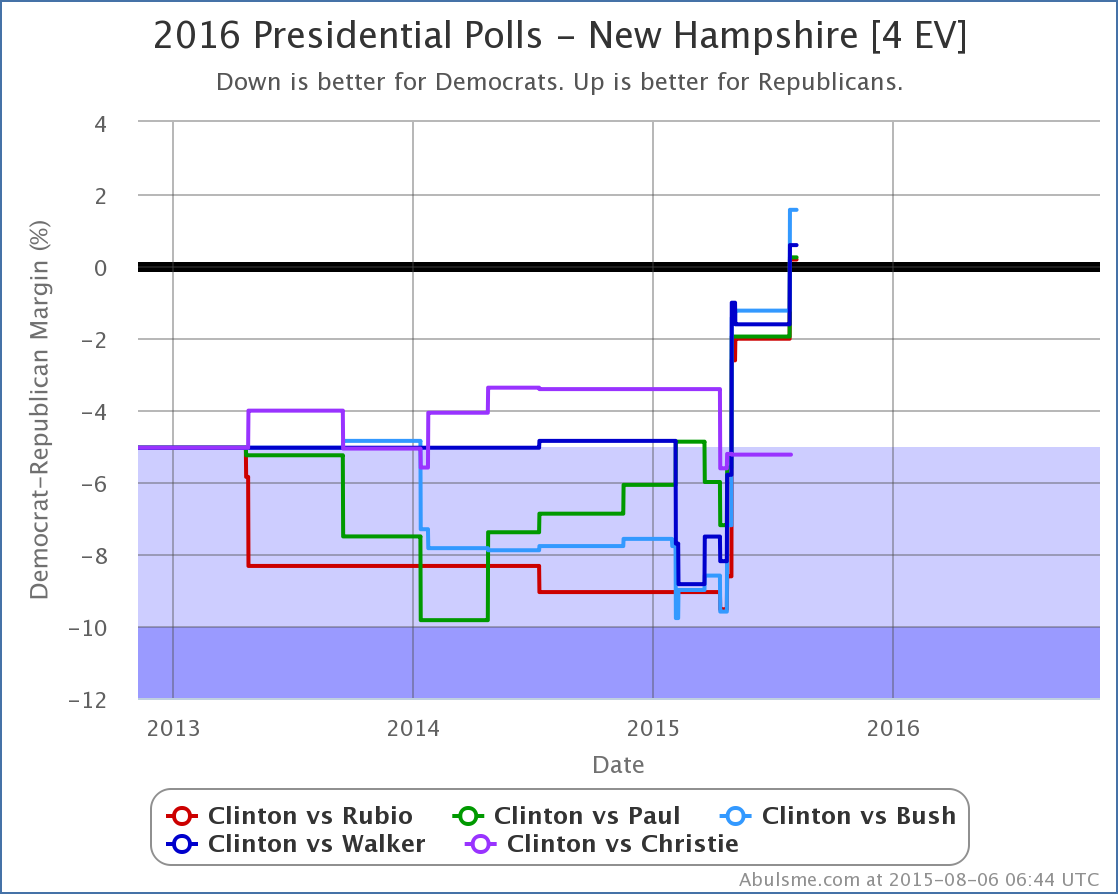
Today there was yet another poll in New Hampshire, this time from WMUR, as well as one in New Jersey from Monmouth.
Today’s changes actually lead to Clinton vs Walker bumping Clinton vs Rubio off my “five best polled candidate combinations” list, at least according to my metric.
Even though Clinton vs Rubio isn’t in the top five any more, since it WAS in the top five prior to this update, I’ll briefly cover the change.
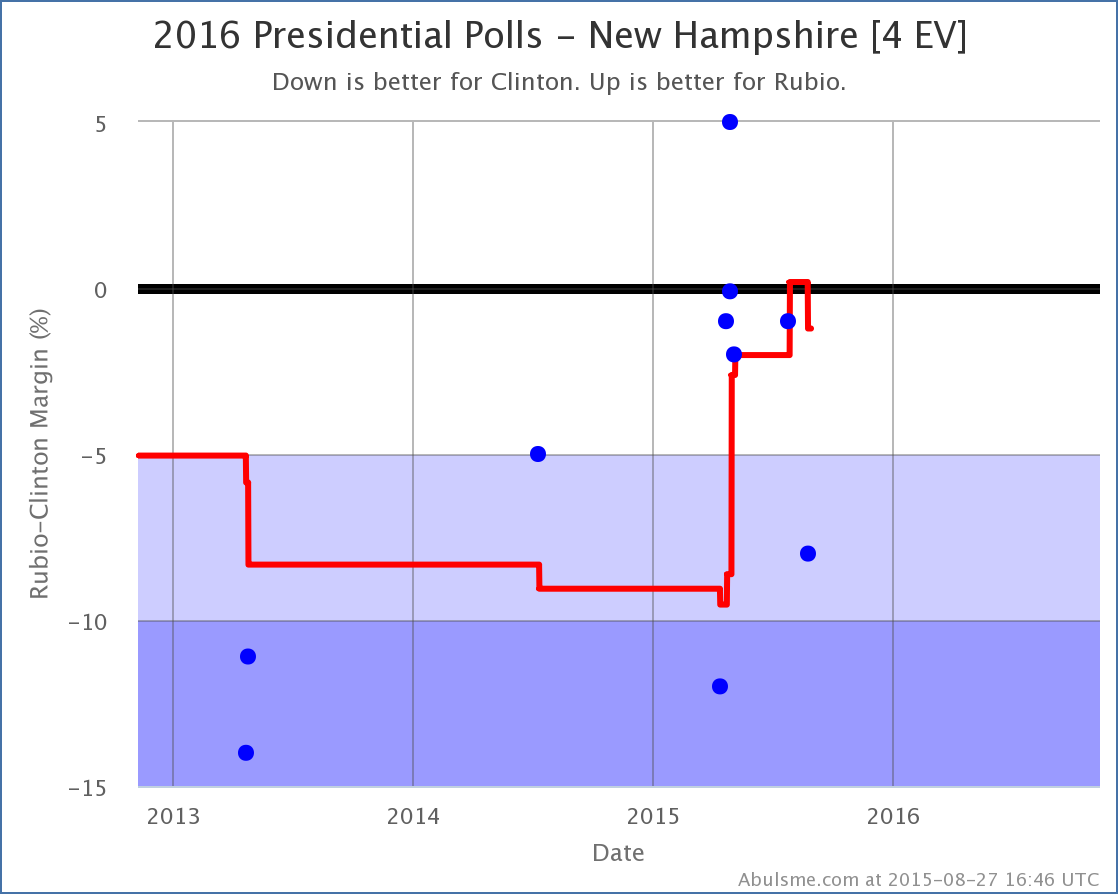
Just like Bush and Paul improved their situation in New Hampshire polling yesterday, today’s poll data boosts Rubio in New Hampshire, and Clinton’s lead falls to less than 5%.
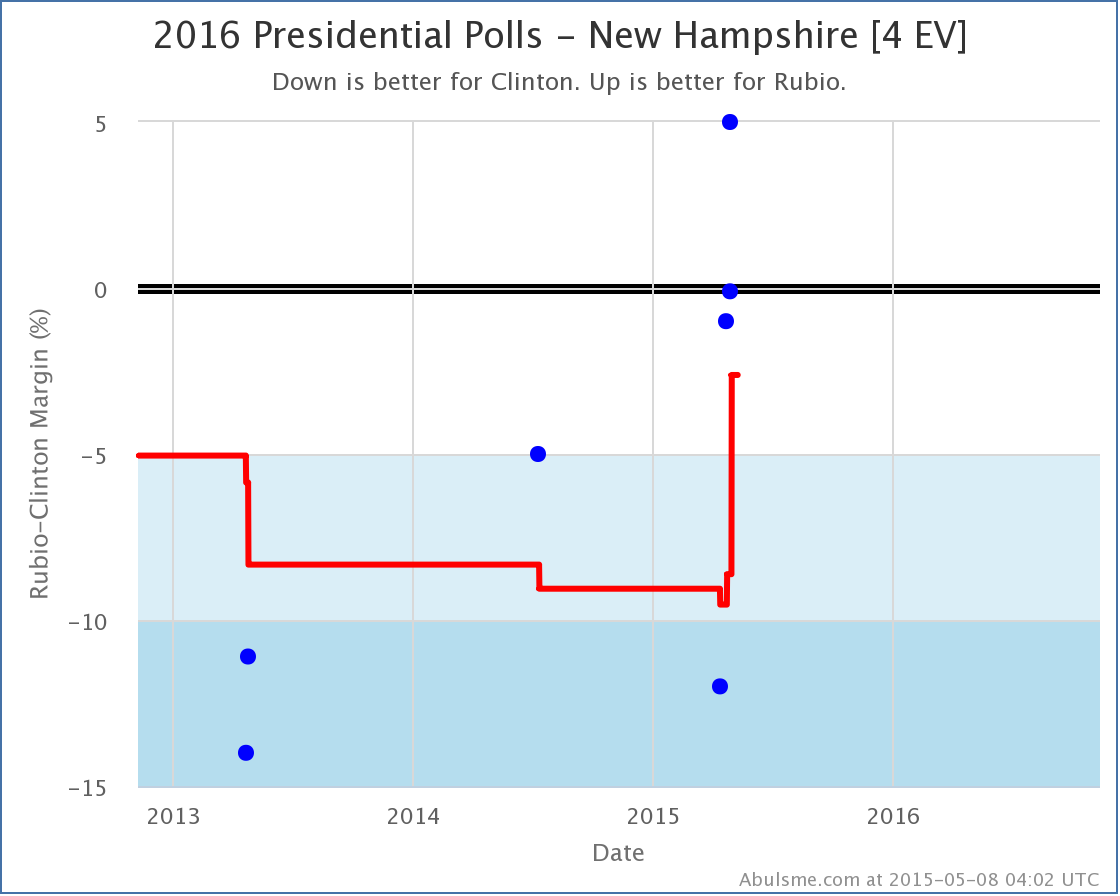
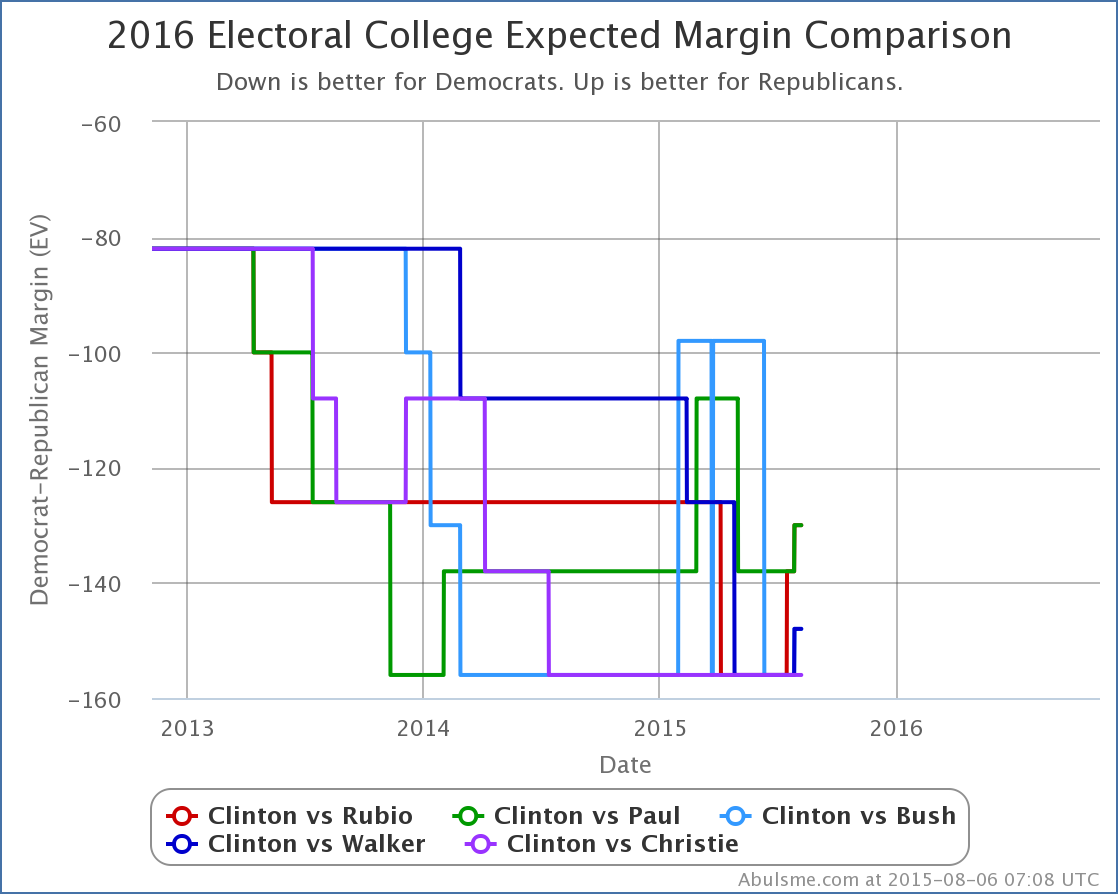
Notice the huge range here. Just within the last month, polls have ranged from Clinton up by 12% to Rubio up by 5%. That is a crazy range. I don’t feel a lot of confidence about what is really going on in New Hampshire. The average at the moment though puts New Hampshire in the “Weak Clinton” category vs Rubio, so Rubio’s best case improves:
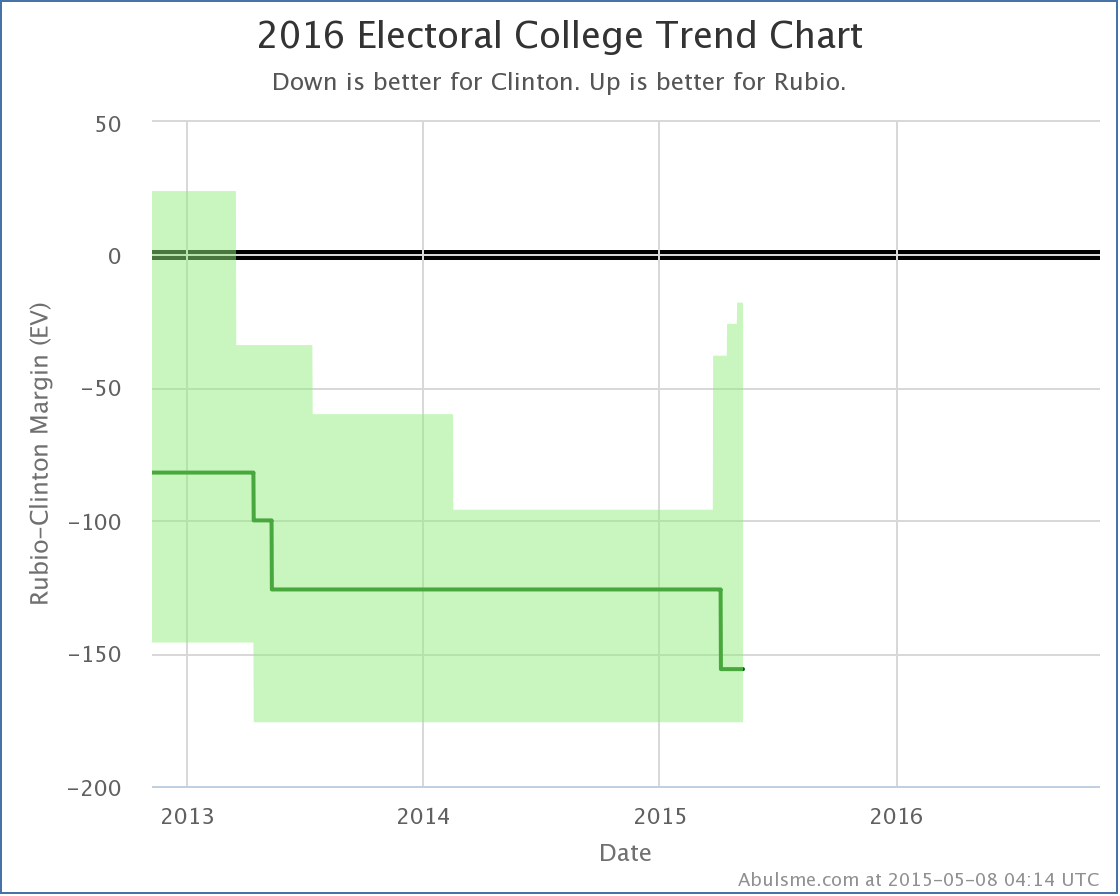
This doesn’t put Rubio quite as close as Bush, but still puts his best case at losing to Clinton by only 18 electoral votes. So there are a couple of the Republicans now threatening to actually make a race out of this.
Note: This post is an update based on the data on my 2016 Electoral College Analysis Site. All of the charts and graphs seen here are from that site. Graphs, charts and raw data can be found there for the race nationally and in each state for every candidate combination that has been polled at the state level. In addition, comparisons of the best polled candidate combinations both nationally and each in each state are available. All charts above are clickable to go to the current version of the detail page the chart is from, which may contain more up to date information than the snapshots on this page, which were current as of the time of this post.
|
|
