This is the website of Abulsme Noibatno Itramne (also known as Sam Minter).
Posts here are rare these days. For current stuff, follow me on Mastodon
|
Since my last Electoral College blog post there have been new polls in New York, Florida, New Jersey, Ohio and Pennsylvania. There were notable changes for two candidate pairs. But for both of them, the news was mixed. Lets take a look:
Clinton vs Trump
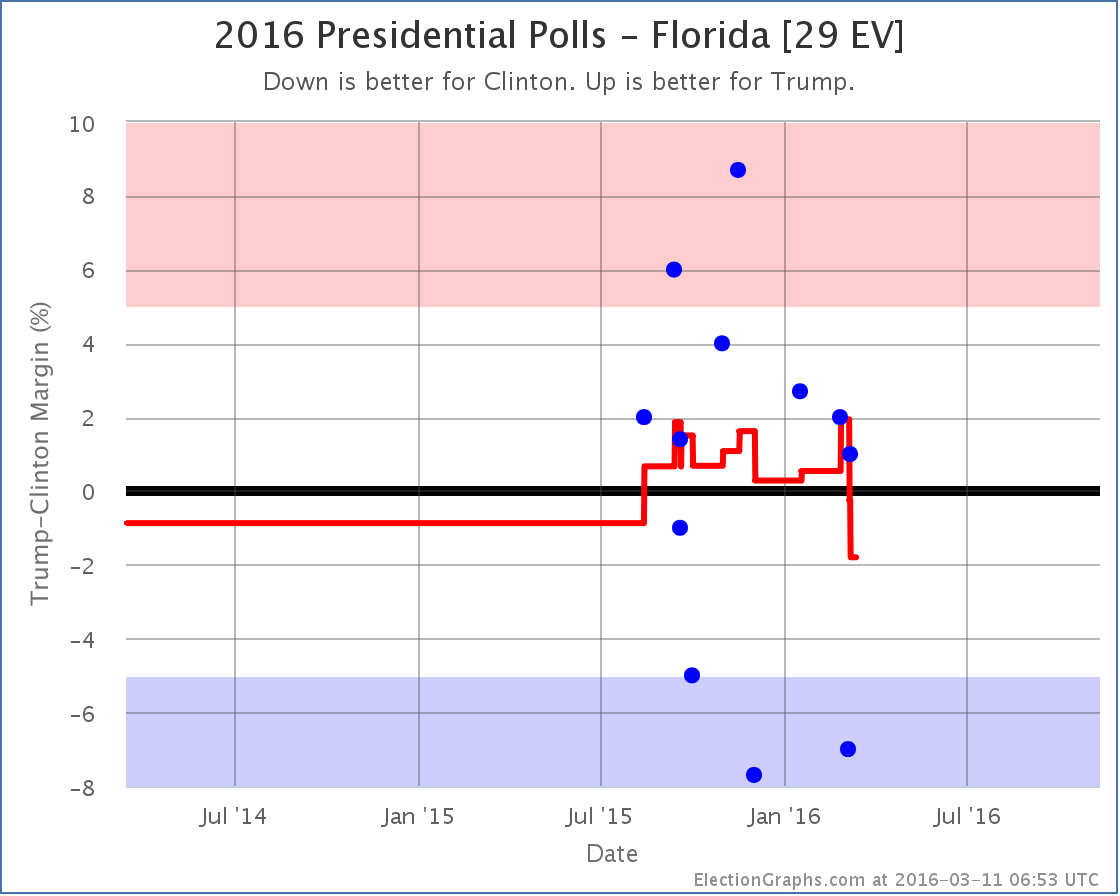
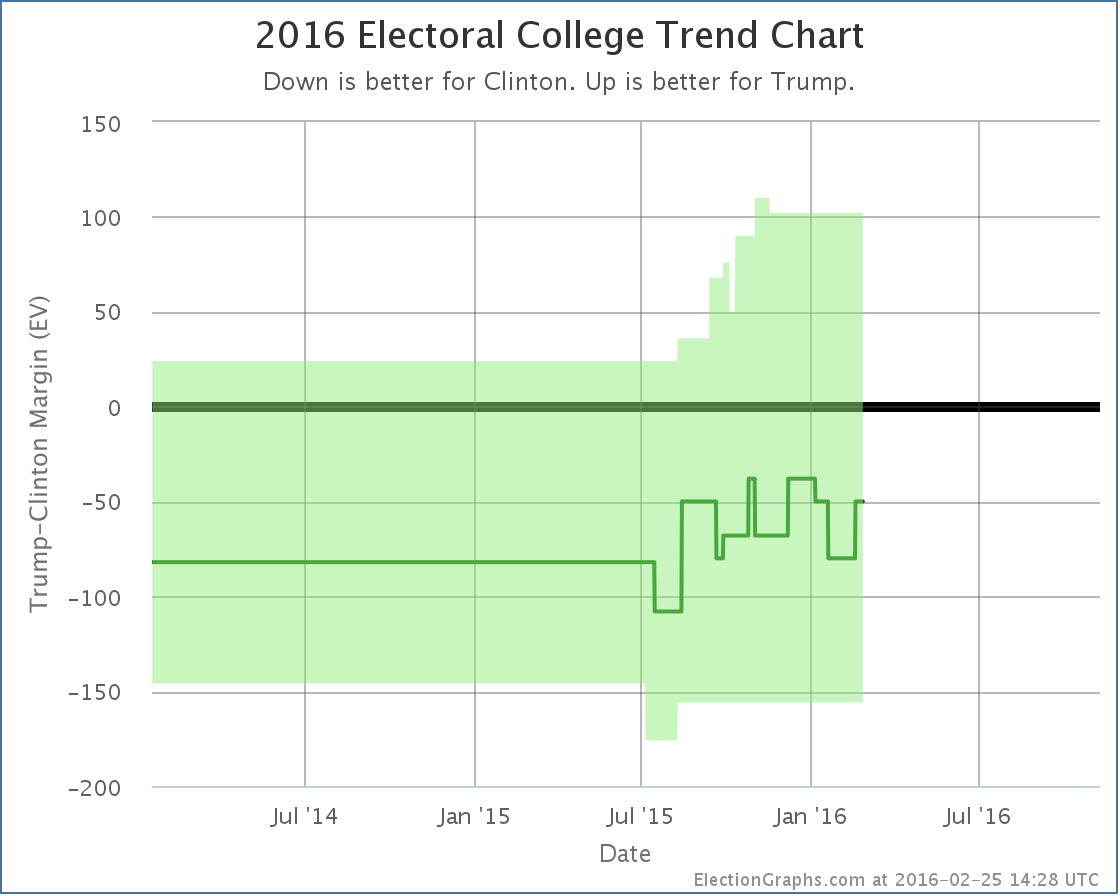
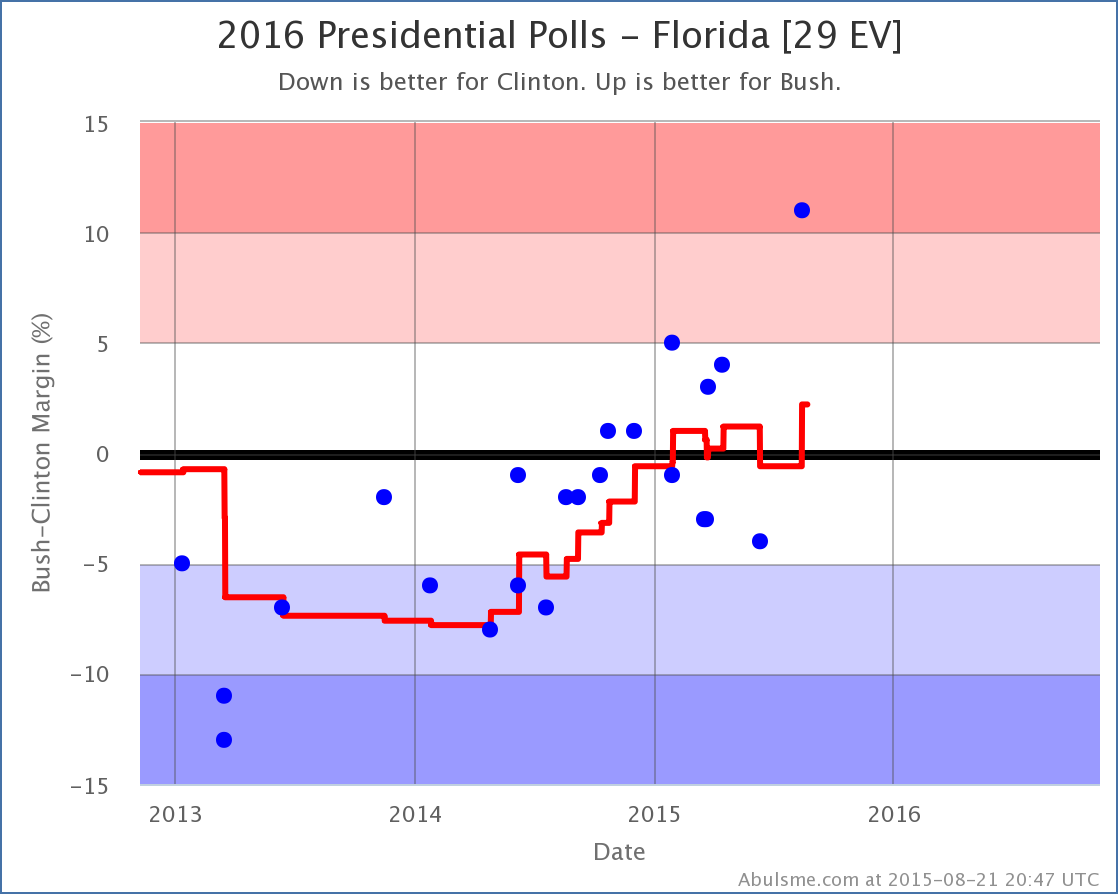
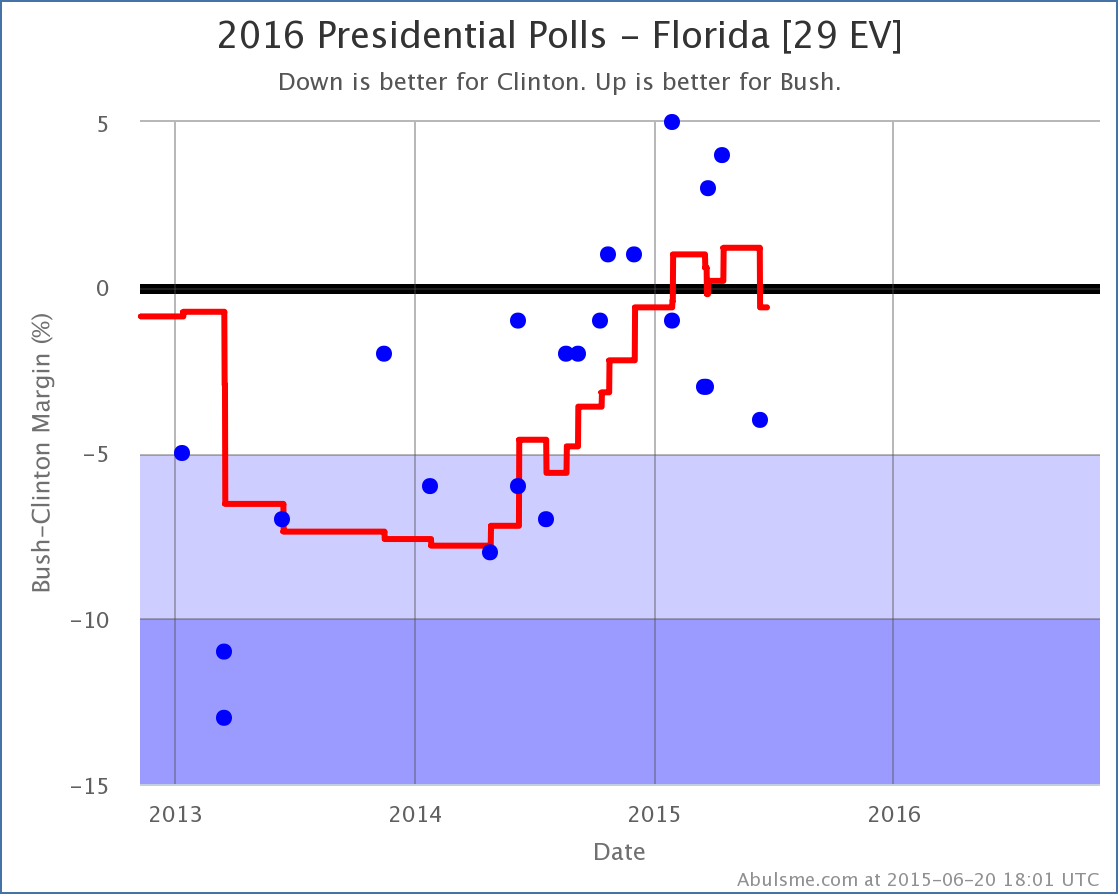
With some strong polls from last fall rolling off the average, Florida flips from “Weak Trump” to “Weak Clinton” with the state now sitting at a 1.8% Clinton lead. This is still a very “close could go either way” result, but it puts Florida on Clinton’s side of the fence so she gets Florida’s 29 electoral votes in her “Expected” case:
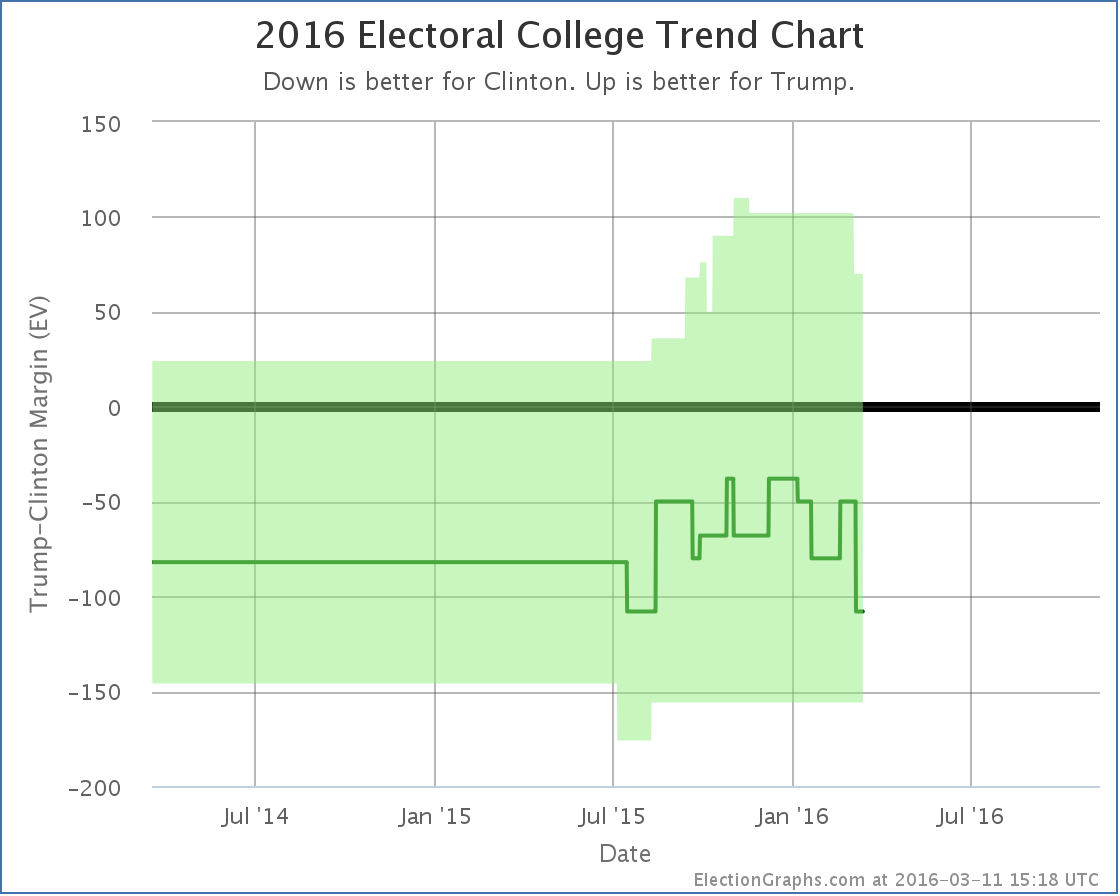
Florida is a big state and makes a big difference. The expected result is now a 108 electoral vote win by Clinton. But it is important to remember that given all the close states that could easily move, anything from Clinton by 156 to Trump by 70 is very easy to imagine given the current polling.
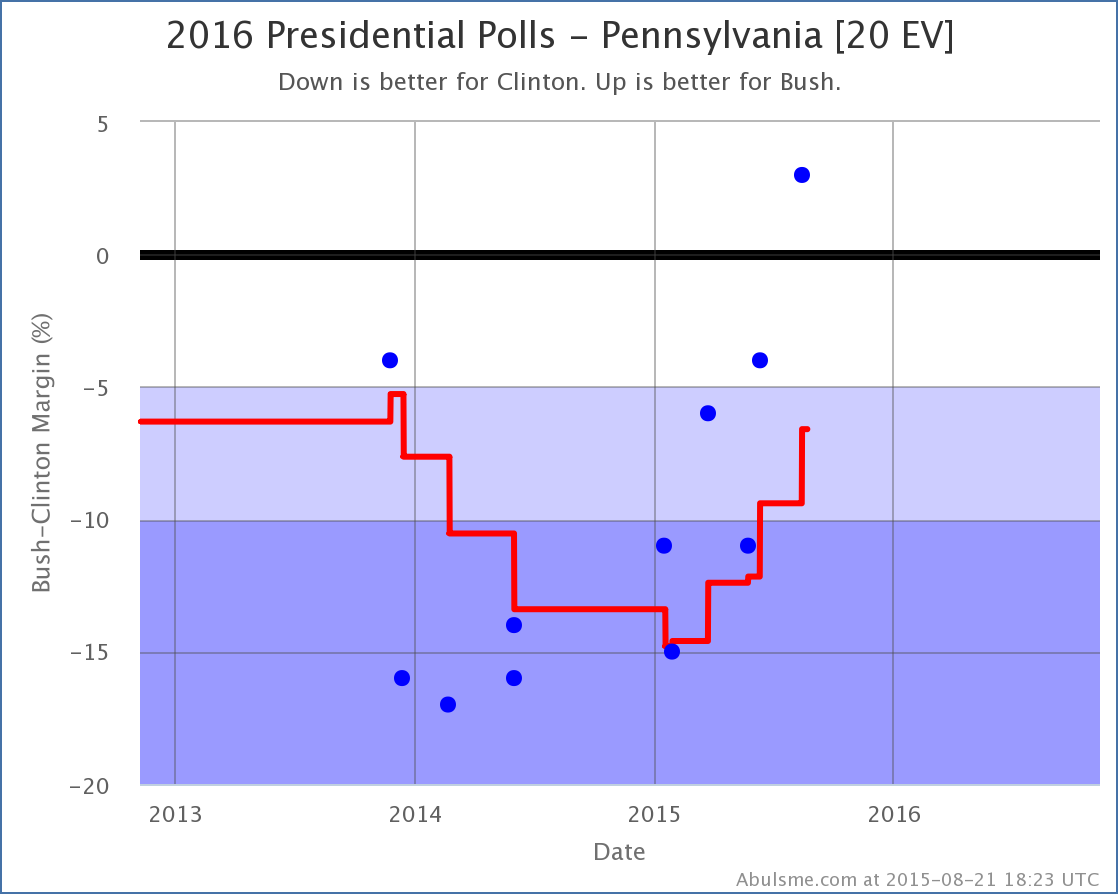
But there was movement for Trump in the other direction too. He improved in Pennsylvania, and while it didn’t change the status of Pennsylvania (Weak Clinton) it did move Trump’s tipping point:
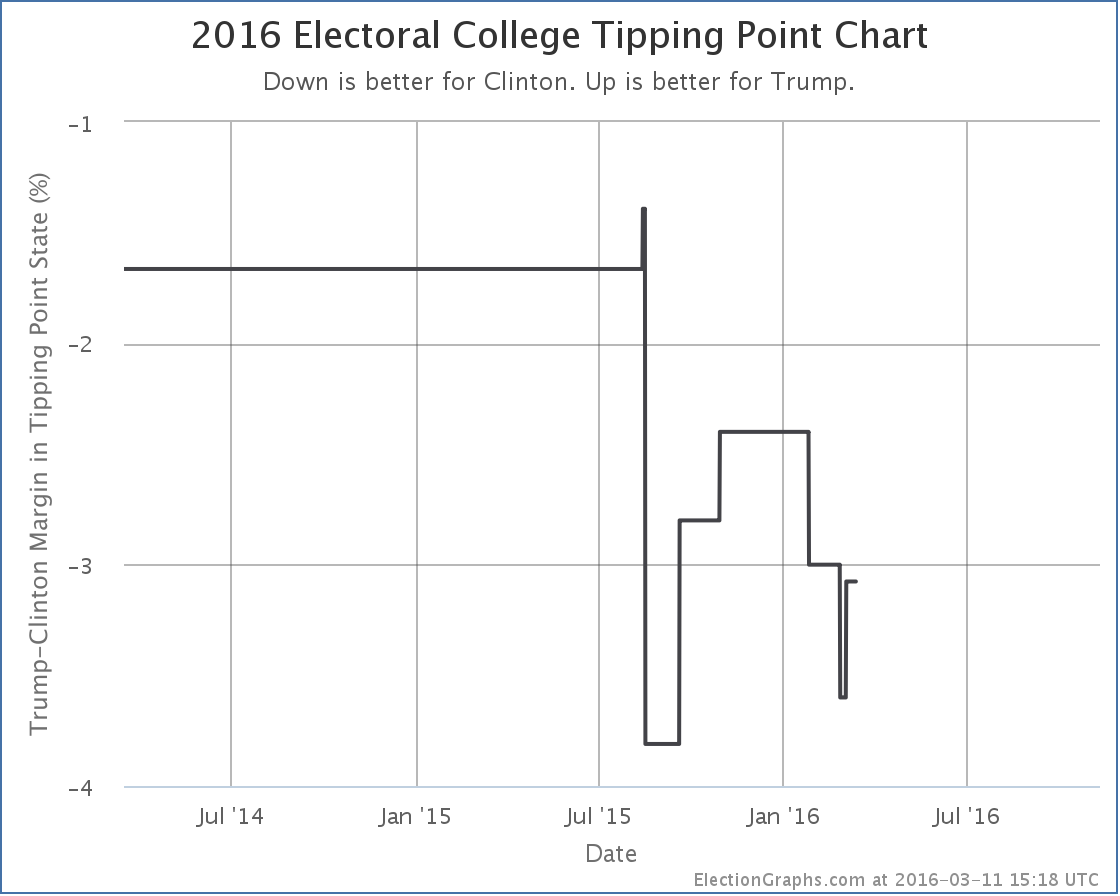
After a very brief dip lower, Trump’s tipping point pops back up to being behind Clinton by only 3.1%. Remember, the tipping point essentially represents how far ahead or behind a candidate is nationally, but adjusted for the effects of the electoral college.
So Trump’s “expected” result gets a little bit worse, but the amount he has to move polls to flip that result to a win gets a little smaller.
Clinton vs Cruz
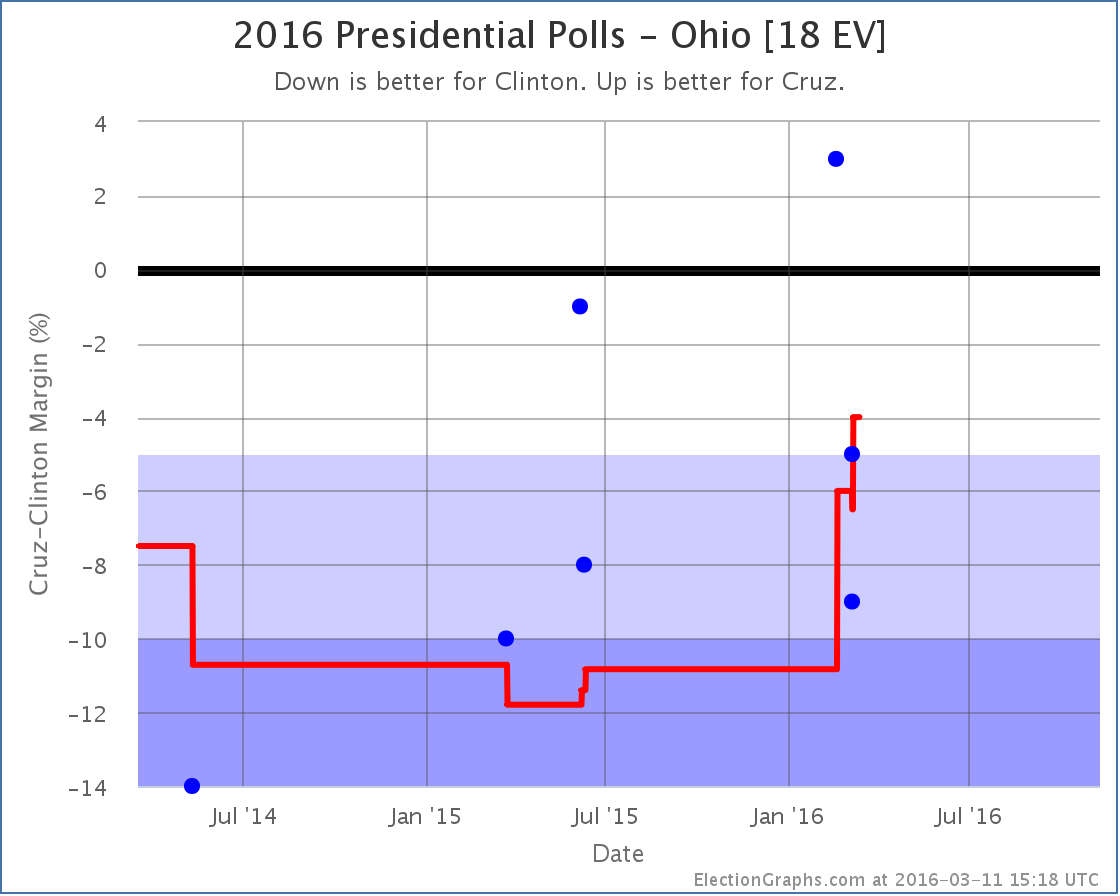
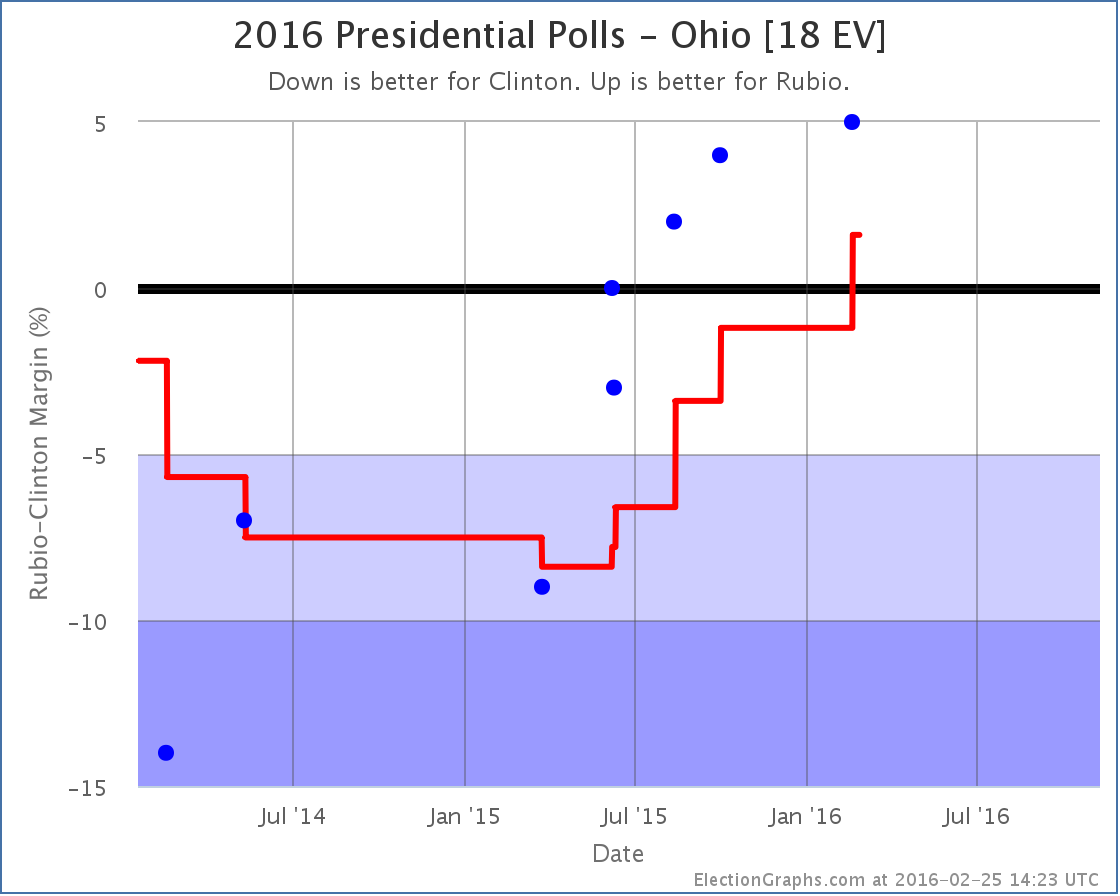
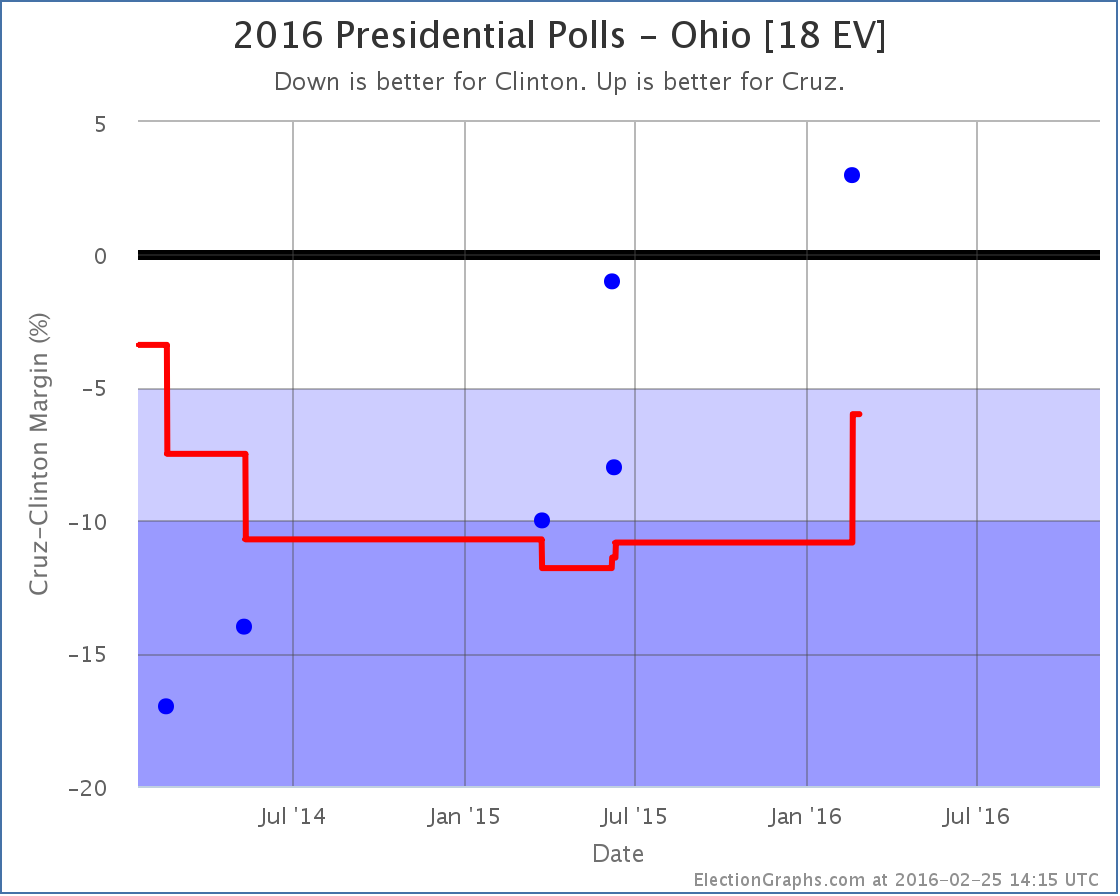
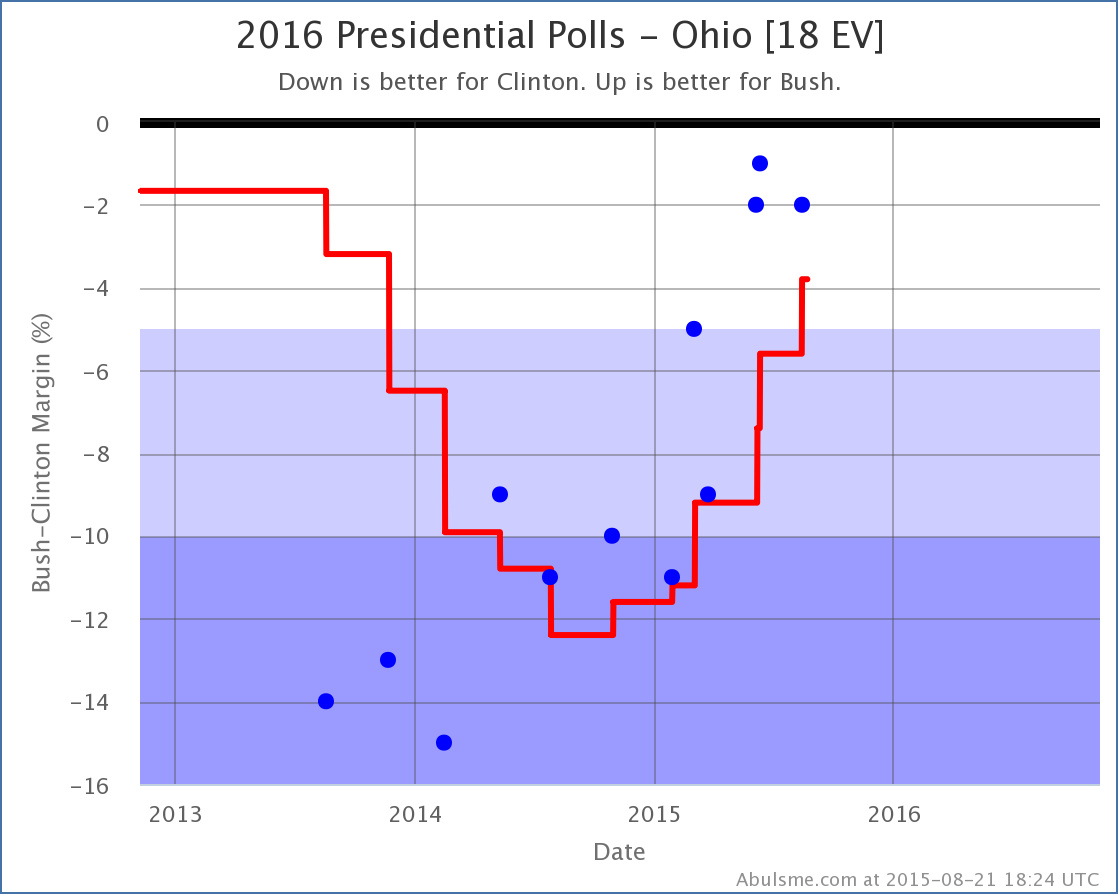
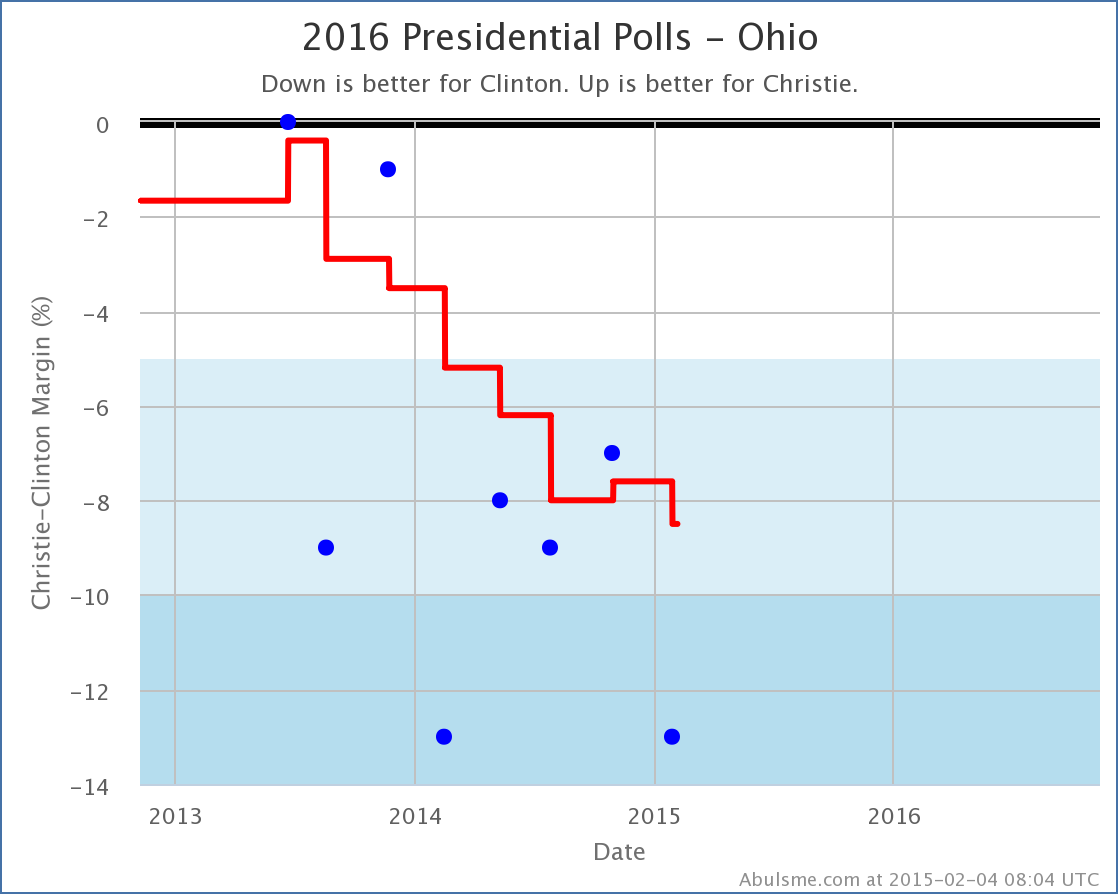
While Trump was weakening in Florida, Cruz’s poll average was improving in Ohio. He is now behind Clinton by only 4.0%. She still leads, but this is close enough for me to consider Ohio a swing state and a possible pick up for Cruz, which improves his “best case”…
Now if Cruz wins all the states he is ahead in, plus flips Nevada and Ohio where he is close… he loses by only 48 electoral votes.
But still, it is an improvement. And Cruz has been on an improving trend for about a year now. If it continues, he might eventually be competitive.
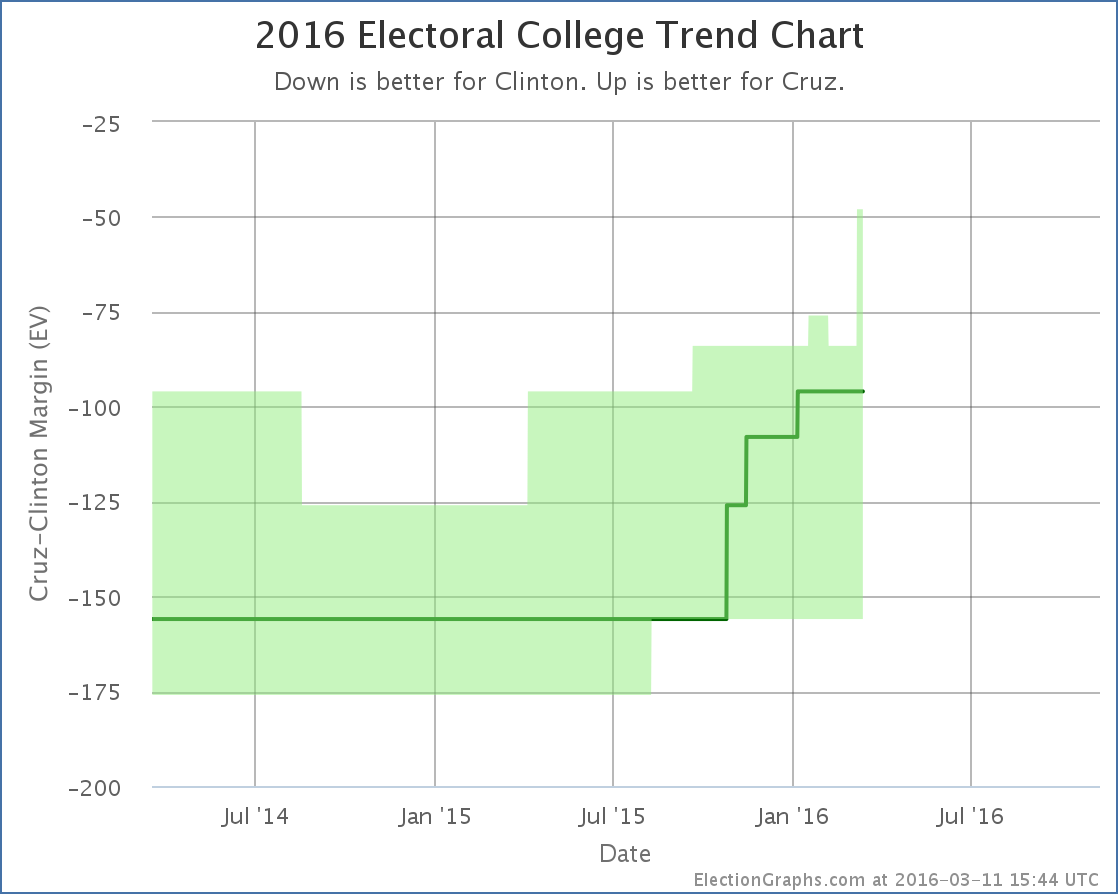
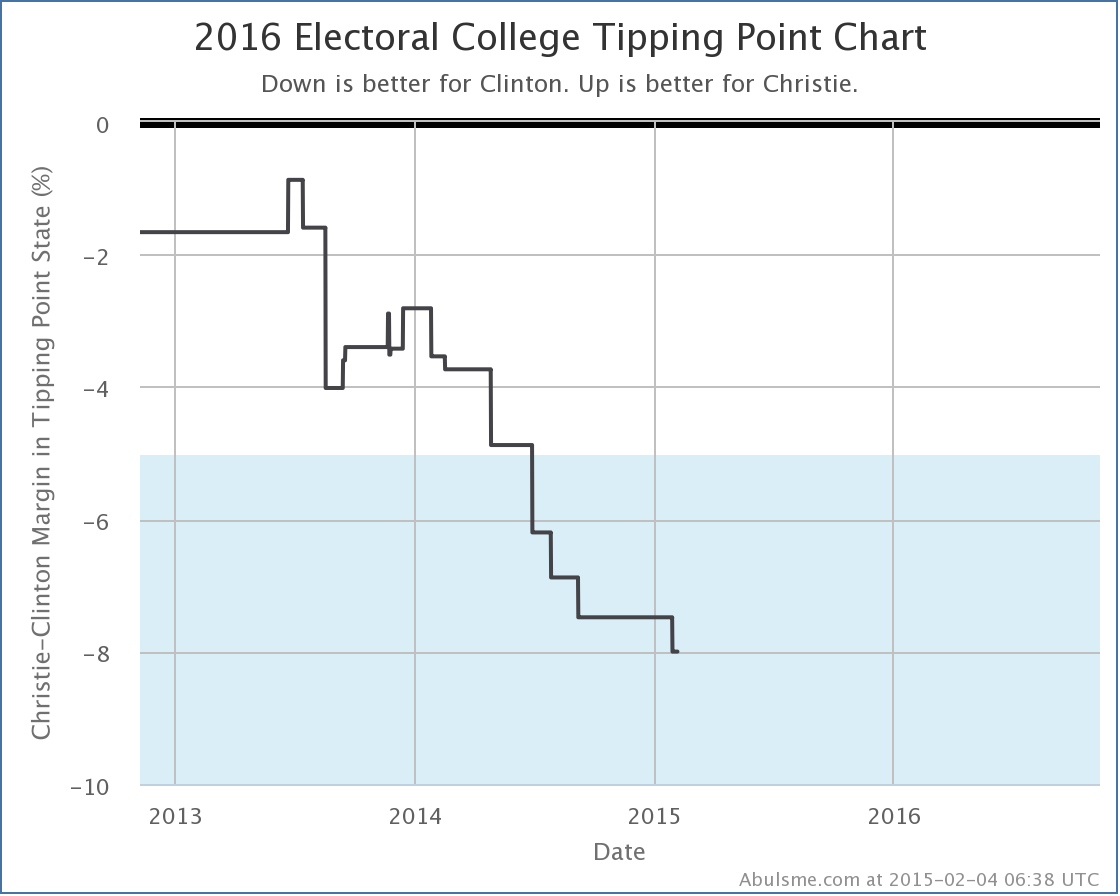
On this metric anyway. As with Trump above, his tipping point also moves, but in the opposite direction:
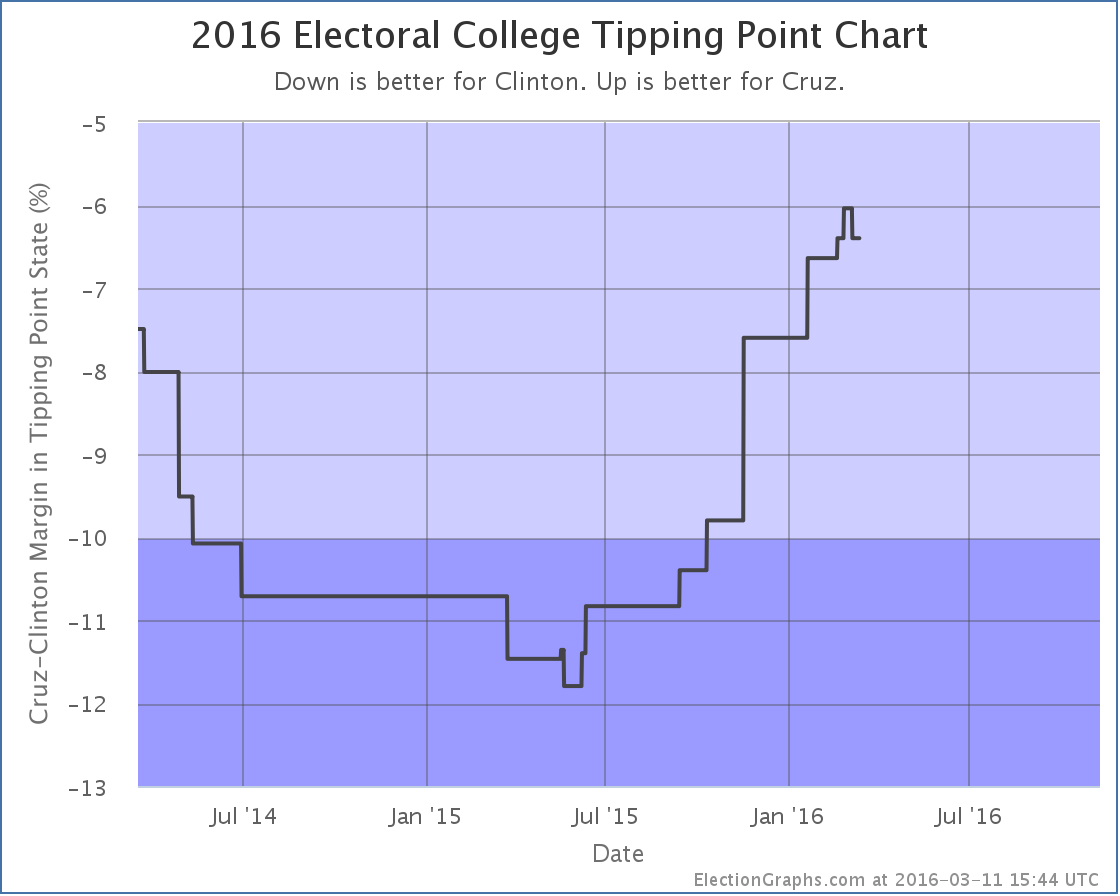
Cruz’s poll average in Florida dropped a bit. The category didn’t change (Strong Clinton) but the movement did cause Cruz’s tipping point to go from 6.0% behind Clinton to being 6.4% behind Clinton.
Either way, Cruz continues to be far behind Clinton when you look at things based on state level polls. As I have discussed here before, looking at national polls makes this matchup look much closer. It is unclear at this point if this is exposing an actual divergence between the popular vote and electoral college due to the regional distribution of candidate support, or if it is simply that there haven’t been enough state level polls of this matchup to catch up with recent changes to support levels. If Cruz becomes the Republican nominee, this would eventually become clear.
Of course, looking at the delegate race that doesn’t look too likely right now, so we may never know.
241.8 days until polls start to close.
Note: This post is an update based on the data on ElectionGraphs.com. Election Graphs tracks both a poll based estimate of the Electoral College and a numbers based look at the Delegate Races. All of the charts and graphs seen in this post are from that site. Additional graphs, charts and raw data can be found there. All charts above are clickable to go to the current version of the detail page the chart is from, which may contain more up to date information than the snapshots on this page, which were current as of the time of this post. Follow @ElectionGraphs on Twitter or like Election Graphs on Facebook to see announcements of updates or to join the conversation. For those interested in individual general election poll updates, follow @ElecCollPolls on Twitter for all the polls as they are added.
We’re still in the phase where the pollsters ask about many candidate combinations. With the most recent polling in Ohio, there is no change in the Clinton vs Trump status, but there were changes to Clinton vs Rubio and Clinton vs Cruz. In both cases, the Republican position improves, and Clinton gets a little weaker.
Clinton vs Trump
No, this didn’t change, but since these are the two frontrunners, just a quick reminder of where that race stands:
Anything from Clinton winning by 156 electoral votes to Trump winning by 102 electoral votes is plausible given the state polls. Clinton winning by 50 electoral votes is the “expected” result if each candidate wins all the states they are ahead in right now.
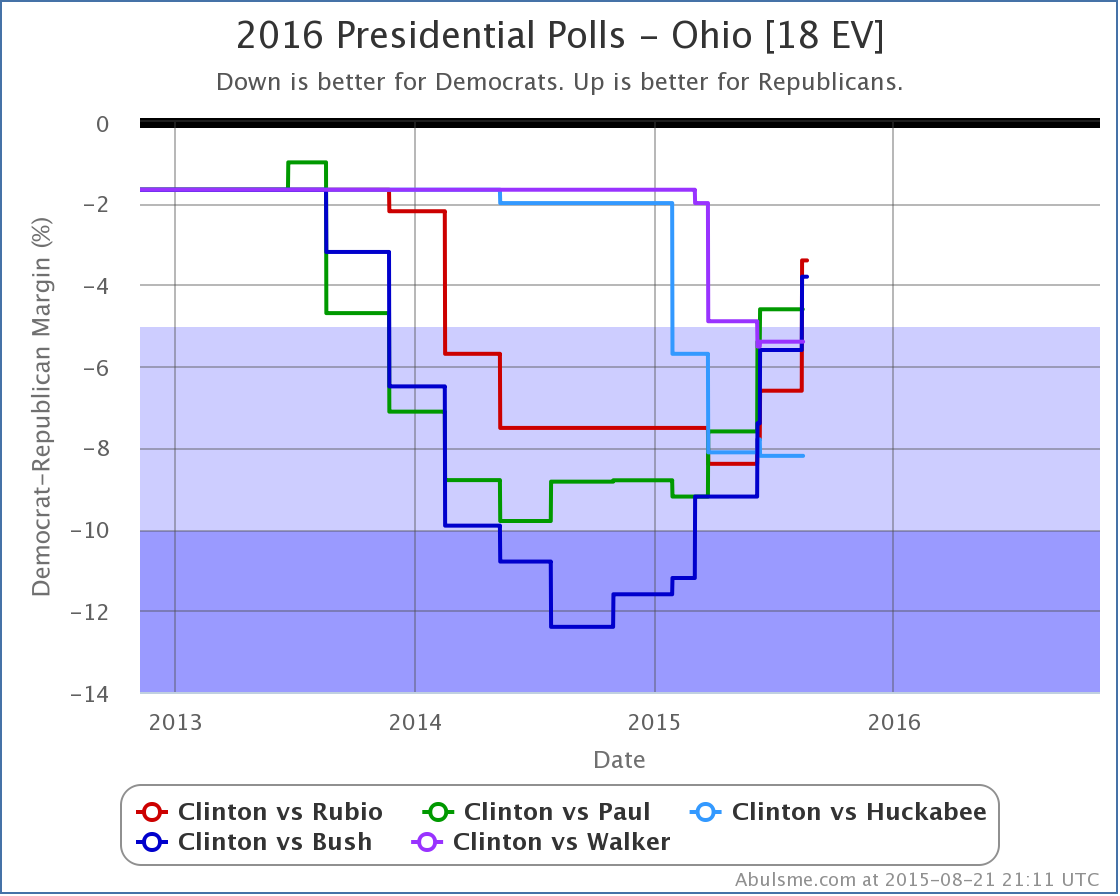
Clinton vs Rubio
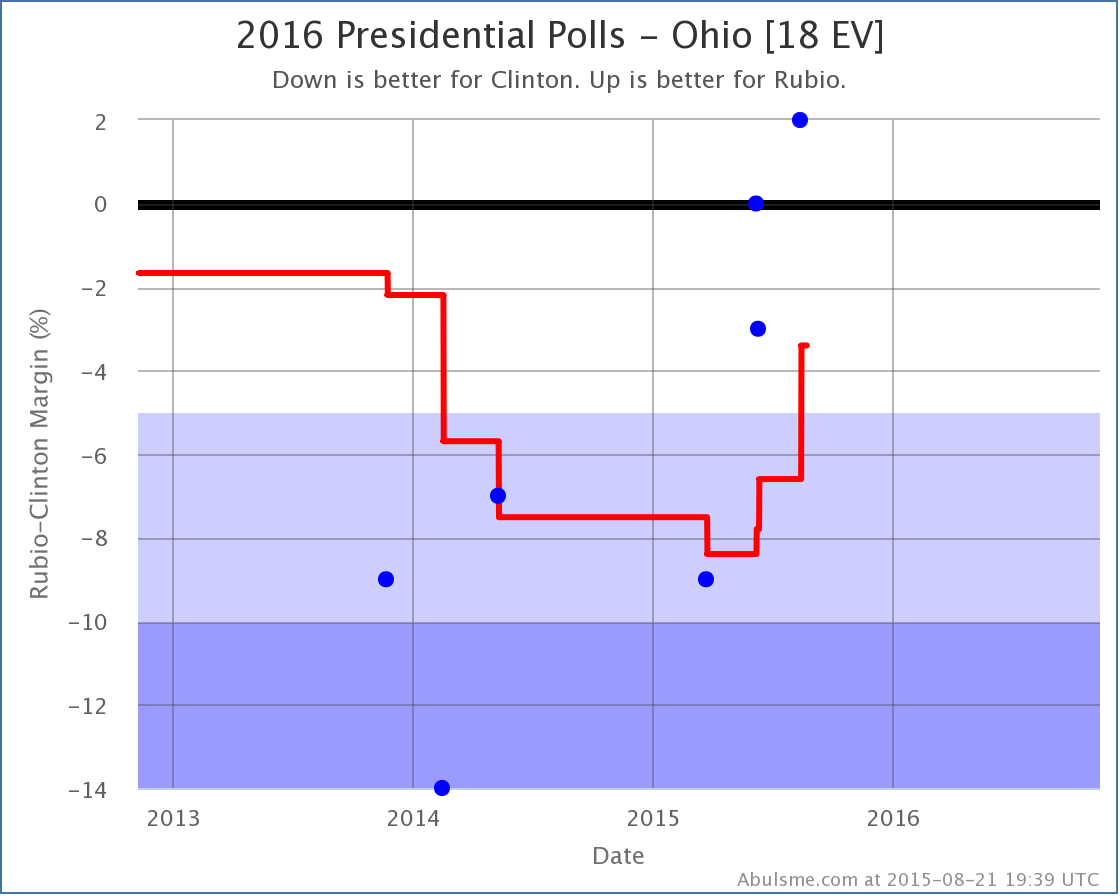
Ohio has been polled less often than one might expect for a state that is traditionally in the “swing state” category, and which looks like it might be again. But the polls for the last year or so have been trending in Rubio’s direction. With this poll, the average pops into the plus side for Rubio. He now leads in Ohio by 1.6% in the average. To be clear, that is still a very close race. But he now has the advantage, so we put Ohio on his side of the ledger.
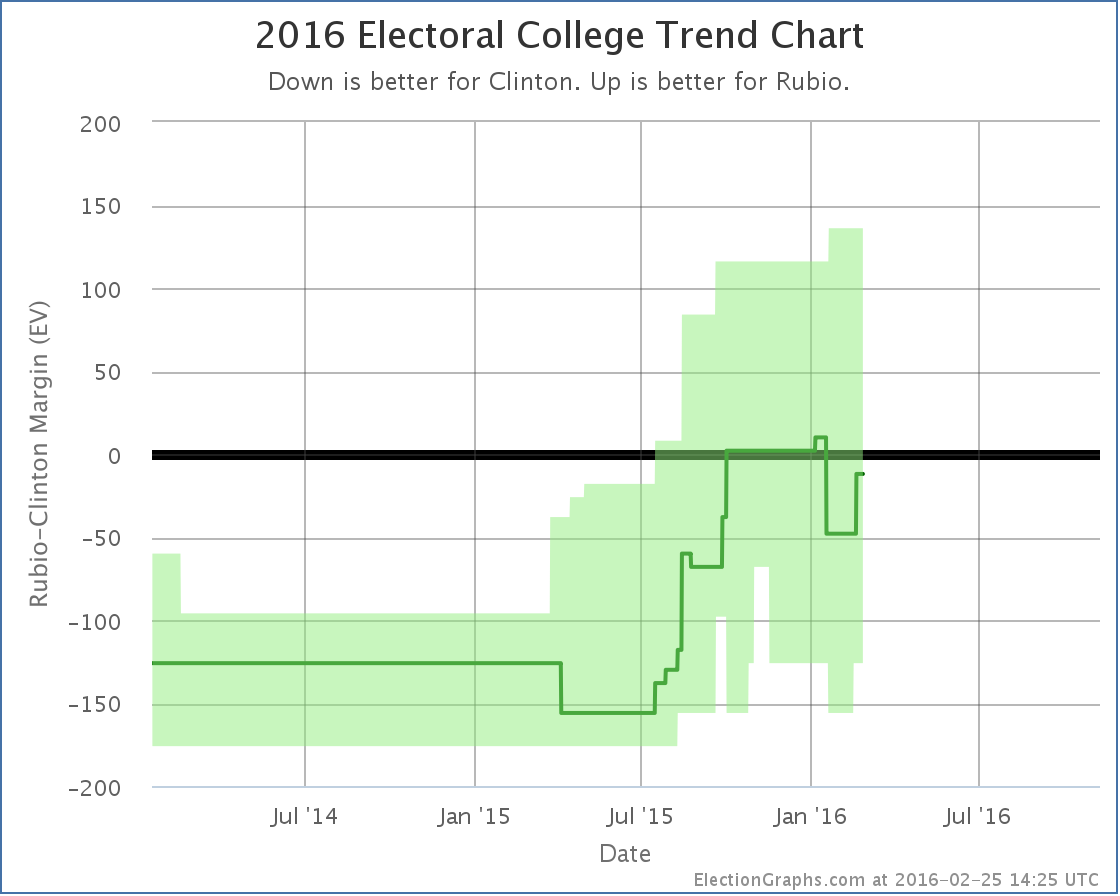
With Ohio back in his column again, if Rubio won every state he is ahead in, and Clinton won every state she is ahead in, Rubio would fall just 12 electoral votes short. He’s not back to leading the race yet, but it is very close. Flipping any one of Florida (0.2% Clinton lead), Virginia (1.2% Clinton lead), Minnesota (1.5% Clinton lead), Michigan (2.9% Clinton lead), or Nevada (4.5% Clinton lead) would do it.
With the large number of close states, anything from Clinton winning by 126 to Rubio winning by 136 would not be surprising though.
Clinton vs Cruz
Cruz hasn’t managed to make Ohio competitive against Clinton yet, she still leads him by 6.0% in the poll average, but because with this update Ohio moved past the previous “tipping point state”, the tipping point here moves a bit toward Cruz.
As a reminder, the tipping point is the margin in the state that would put the winning candidate “over the edge” in the electoral college if you order the states by how strongly they support the candidates. Like this:
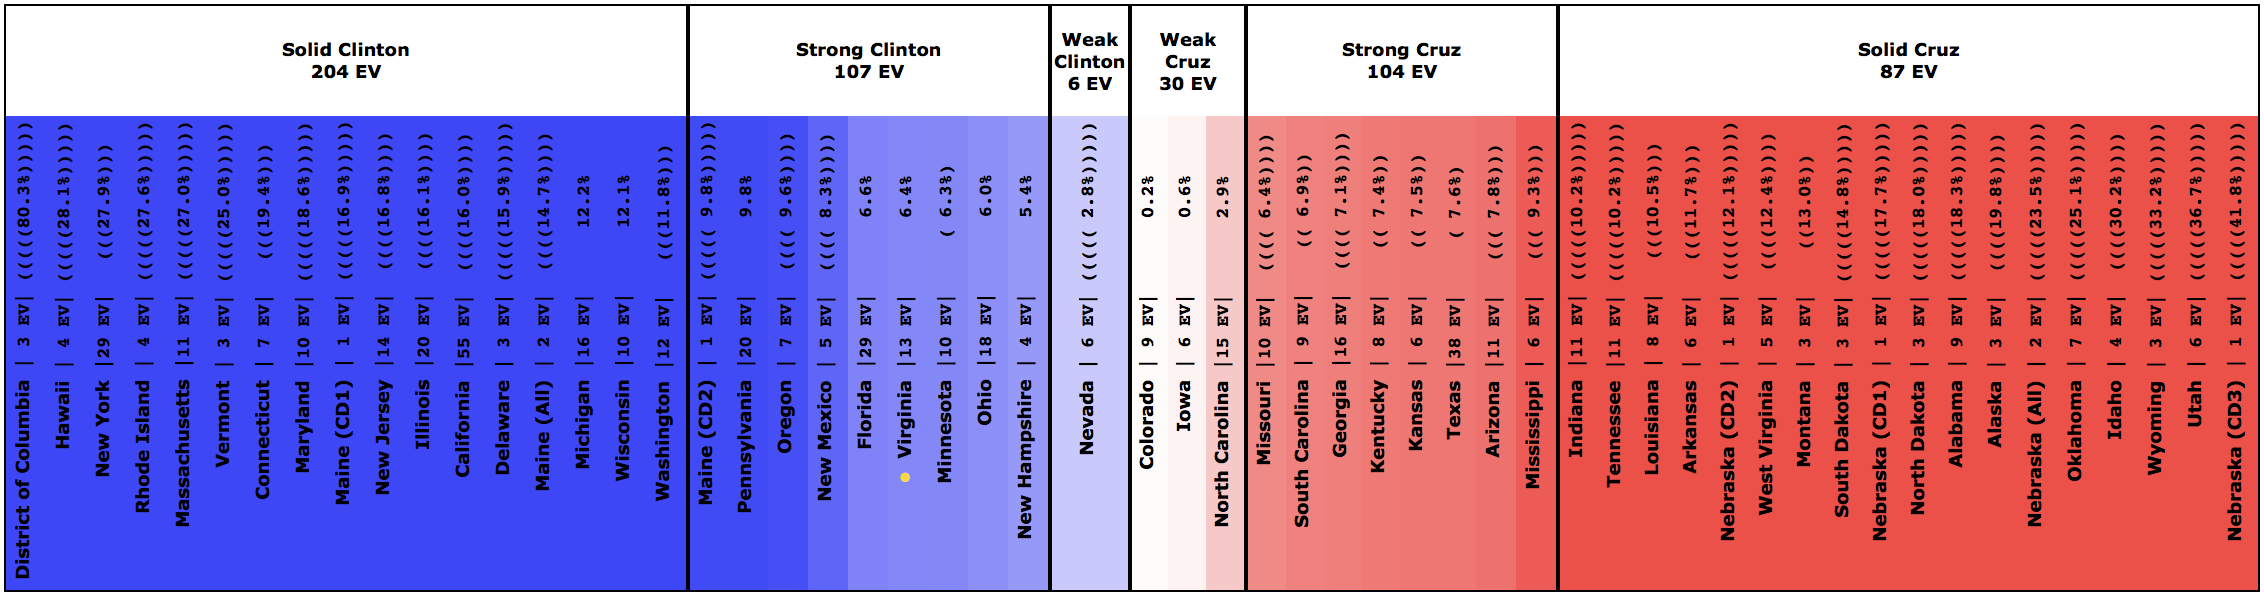
Prior to this update, the tipping point in Clinton vs Cruz had been Florida, where Clinton led by 6.6%. Now the tipping point is Virginia, where Clinton leads by 6.4%.
The tipping point is essentially like looking at the national popular vote, except it takes into account the structure of the electoral college. It tells you how far the polls would have to move across the board in all states to flip the winner.
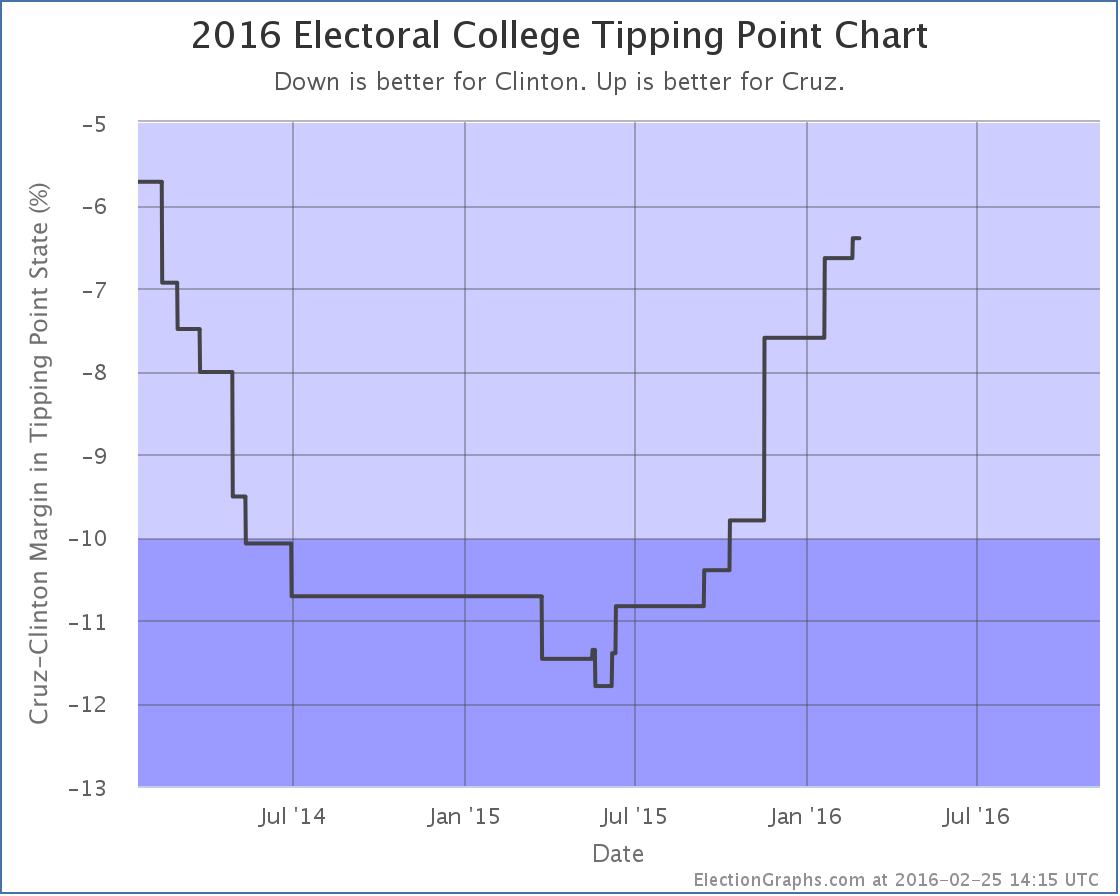
Cruz trails Clinton by 6.4% in this metric… but he has slowly but surely been improving his position since last May. It would take a bit more movement before he actually looked competitive with Clinton though.
And that is where things are today.
256.7 days until polls start to close on election night.
Note: This post is an update based on the data on ElectionGraphs.com. Election Graphs tracks both a poll based estimate of the Electoral College and a numbers based look at the Delegate Races. All of the charts and graphs seen in this post are from that site. Additional graphs, charts and raw data can be found there. All charts above are clickable to go to the current version of the detail page the chart is from, which may contain more up to date information than the snapshots on this page, which were current as of the time of this post. Follow @ElectionGraphs on Twitter or like Election Graphs on Facebook to see announcements of updates or to join the conversation. For those interested in individual general election poll updates, follow @ElecCollPolls on Twitter for all the polls as they are added.
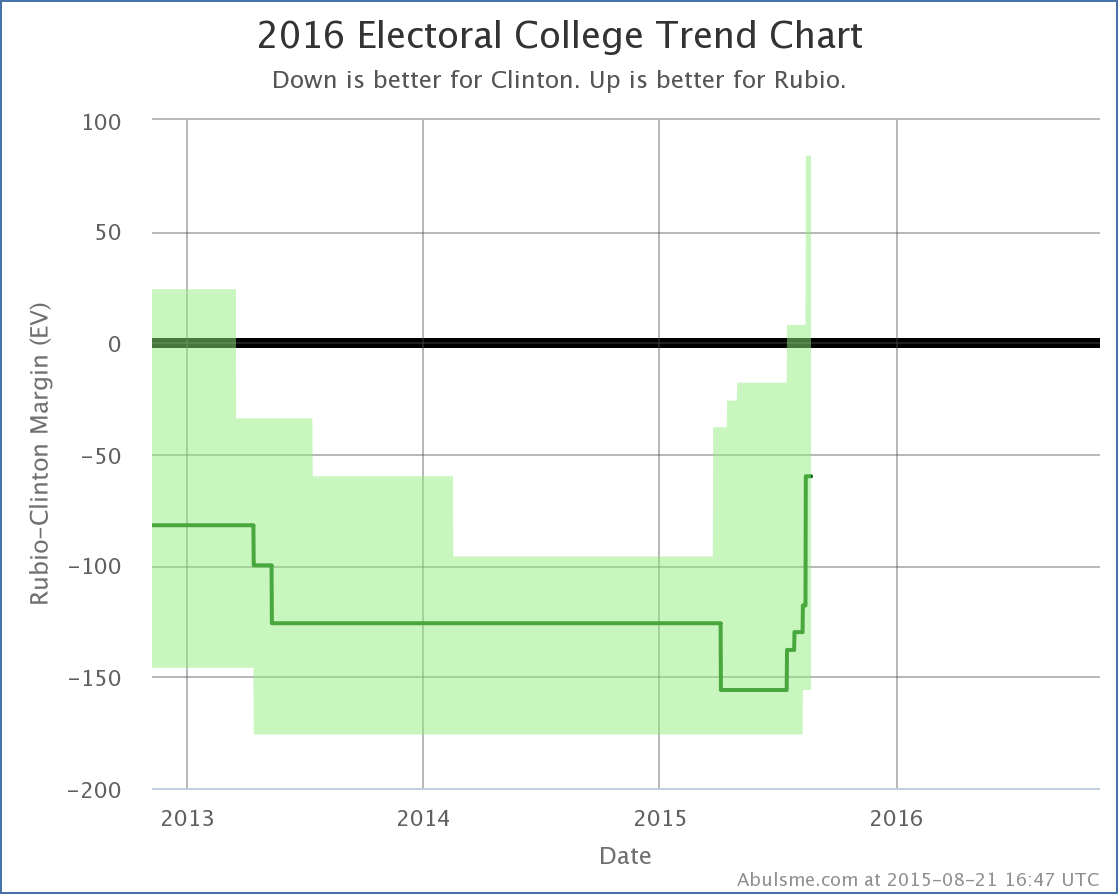
This is probably the most significant update I’ve posted since launching this analysis in November. For the first time, one of the Republicans with significant amounts of polling is actually leading Clinton. Specifically, in Clinton vs Rubio, the “expected result” where each candidate wins all the states where they currently lead in my polling average, is now Clinton 268 to Rubio 270. That is a narrow win, but that is a win.
Since the spring, almost every update has been bad news for Clinton, but the collapse here has been more rapid than that. As recently as July, Clinton was leading Rubio by 156 electoral votes in my analysis. In less than three months, this lead completely evaporated. It is a long way until the election still. And some deterioration was expected. But this trend for Clinton is dramatic. Has she reached the bottom yet? Absent additional major negative revelations, she must be close to a floor… but there is no slowing of this trend visible yet. Things just get worse and worse for Clinton. (At least vs Rubio and Bush… for other opponents, either the trend is less dramatic, or there is just not enough recent state level polling data to draw good conclusions yet.)
Clinton vs Rubio
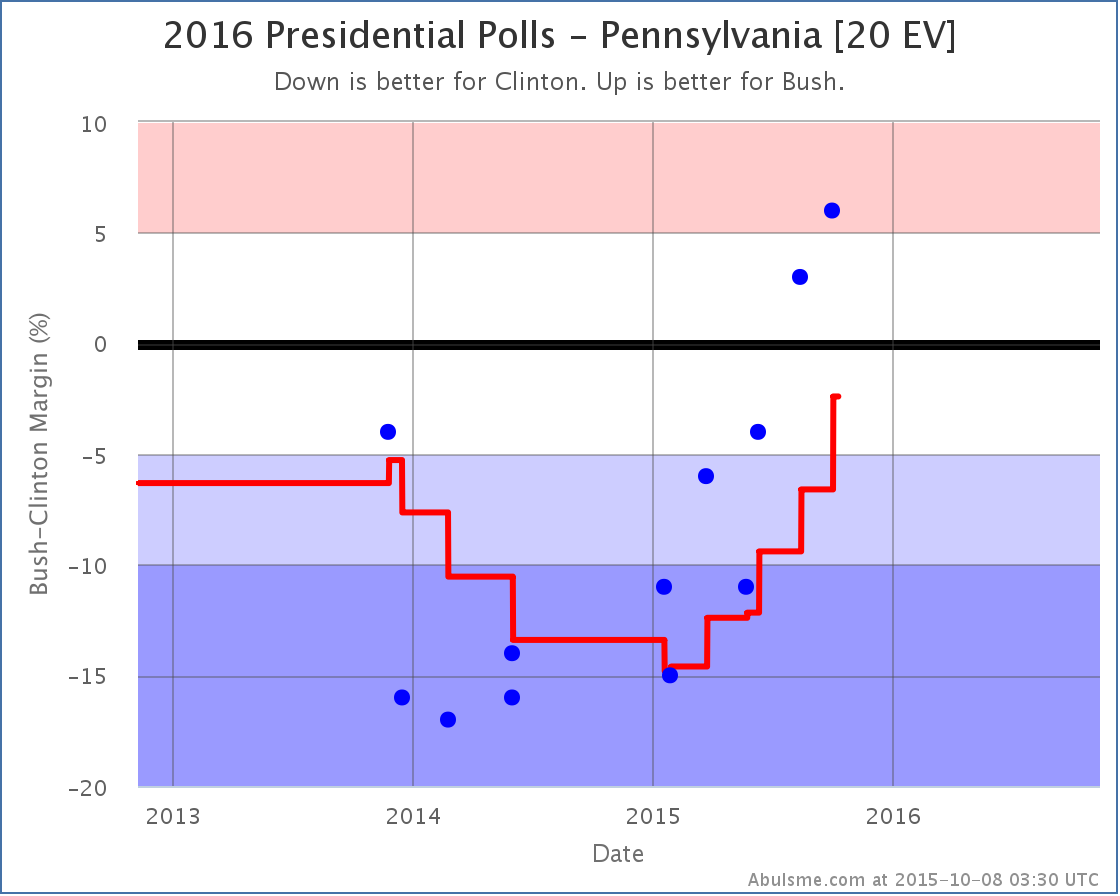
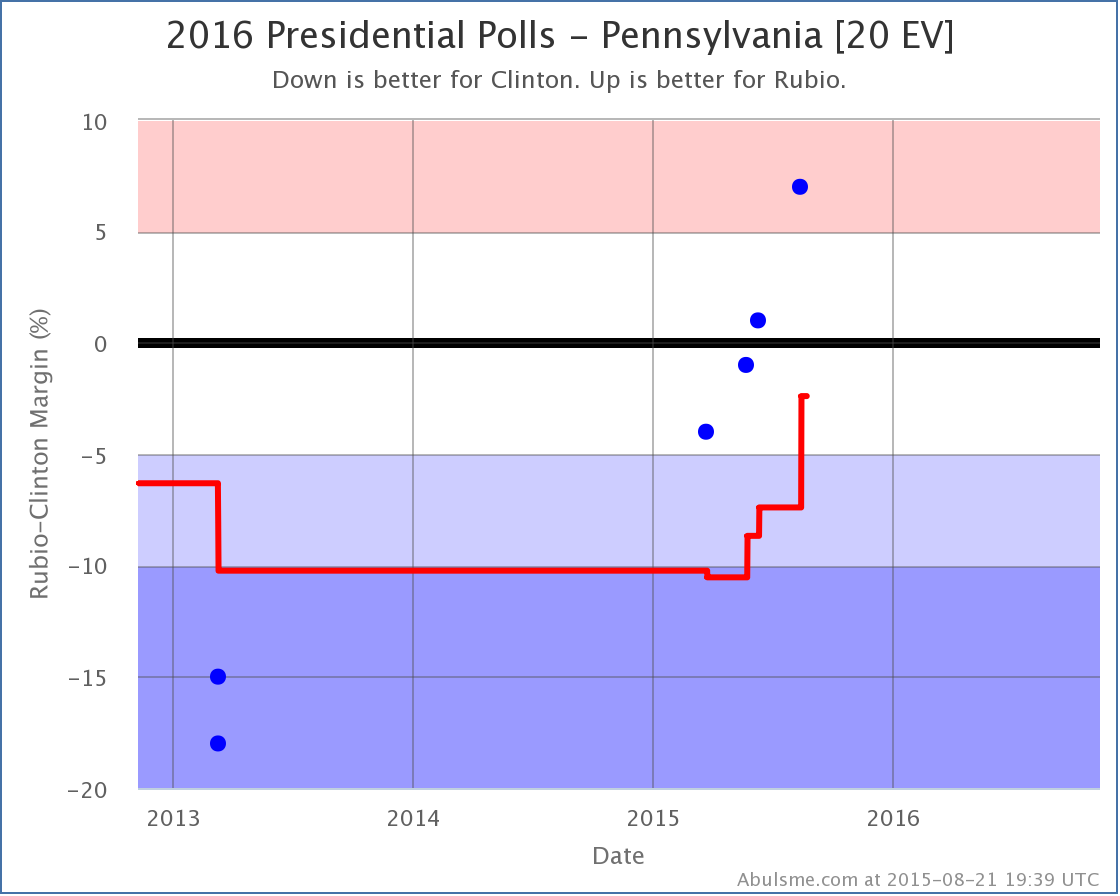
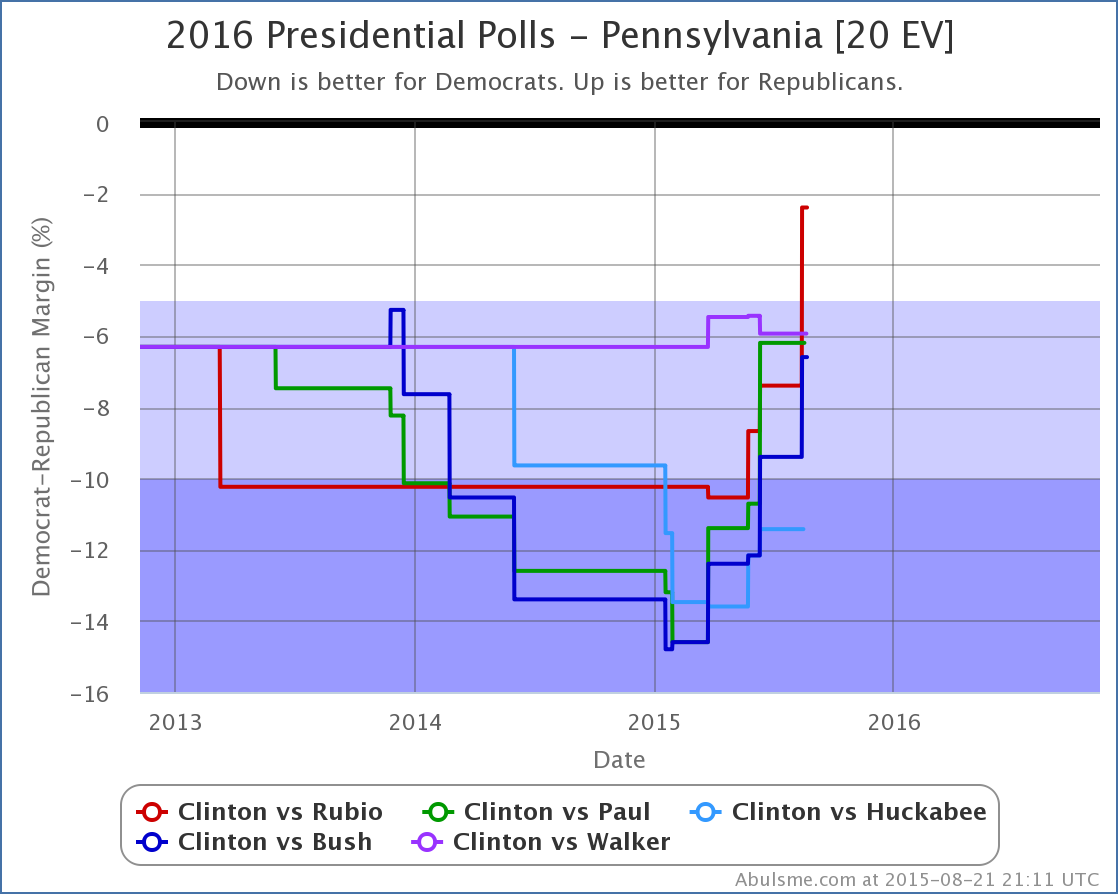
Lets look into the details. First of all, Pennsylvania:
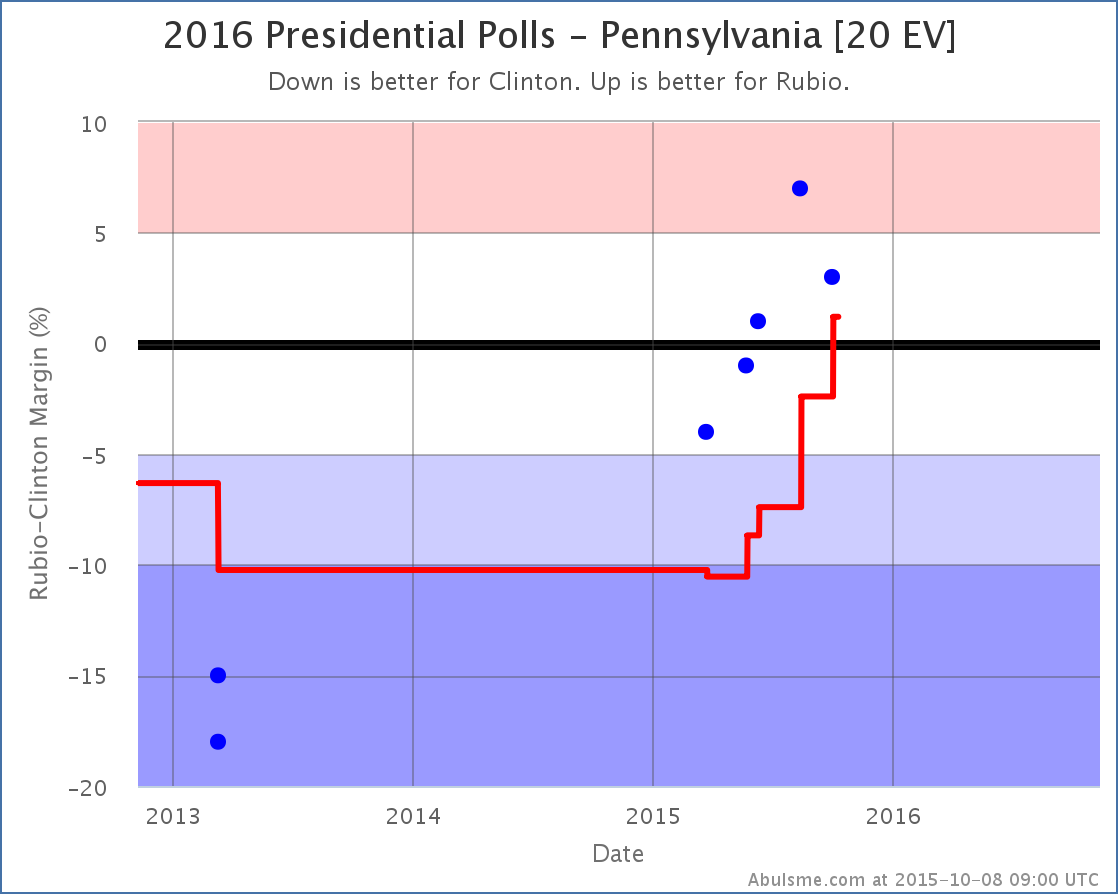
Pennsylvania has not been as heavily polled as some other states, the poll average still covers 6.6 months, but the trend here resembles the trend in many other states, with Clinton losing ground with almost every poll. With this last poll, the average was pulled over to Rubio’s side of the center line. Pennsylvania’s 20 electoral votes was enough to make Rubio the overall winner. This was the big change that caused today’s headline.
Between Pennsylvania’s move, and a smaller move in Ohio that didn’t cross category lines, the tipping point of course moved too:
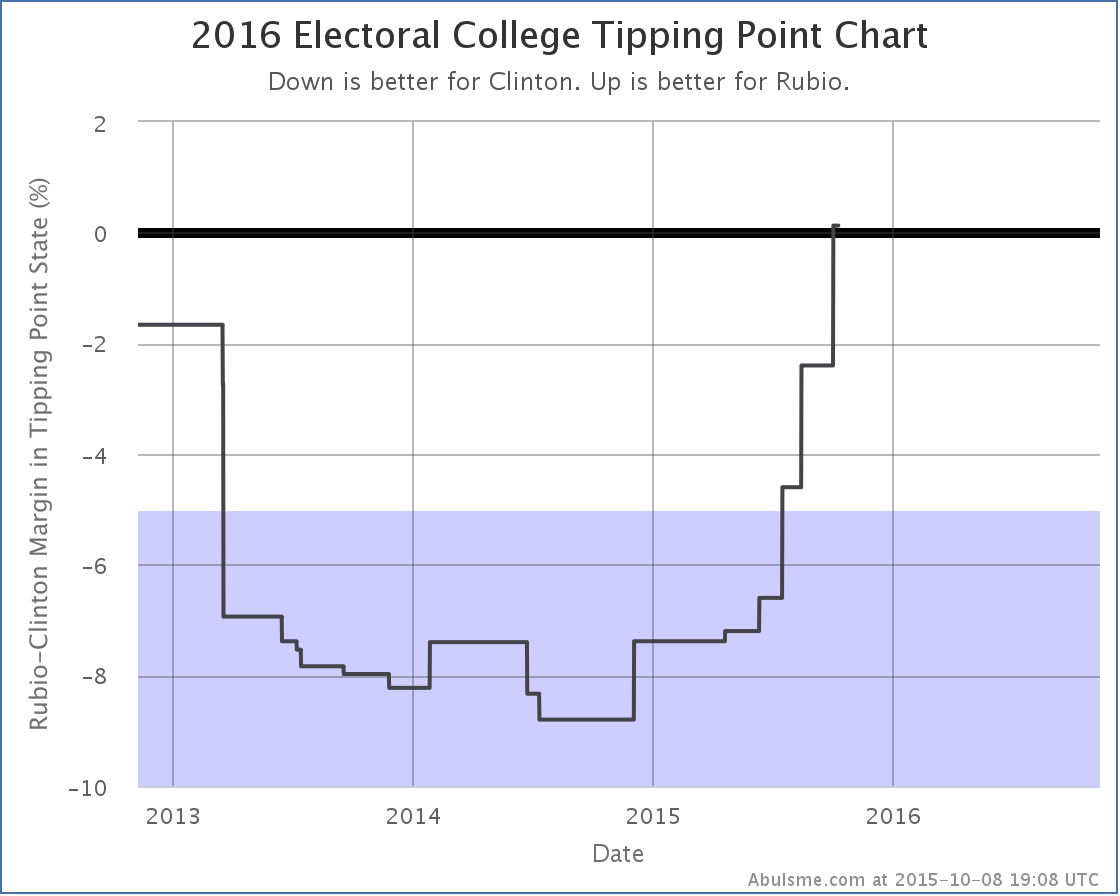
A year ago the tipping point was at 8.8% in Clinton’s favor. It is now Rubio by 0.1%. That is a razor thin margin, but it is a Rubio win.
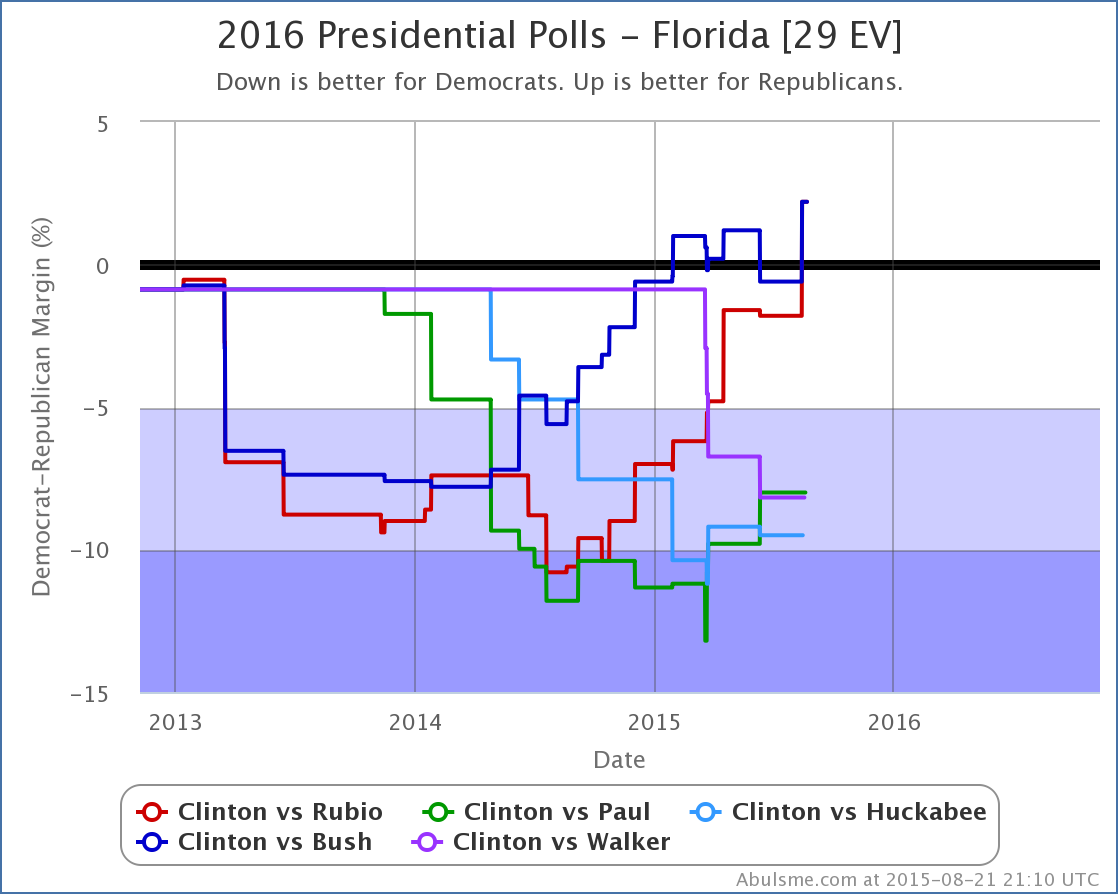
Which brings us to the fact that there actually was one positive thing for Clinton in the latest Clinton vs Rubio results. Florida.
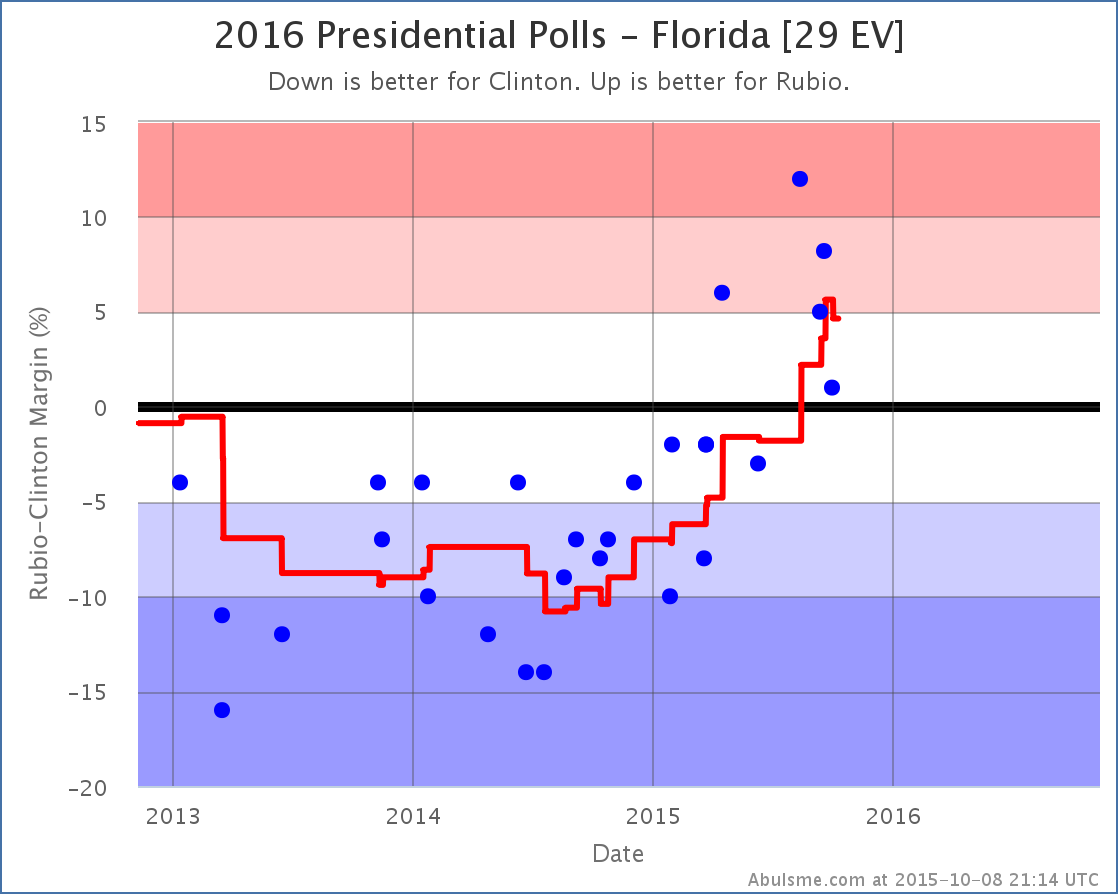
The poll average in Florida actually moves a little toward Clinton with the latest poll, bringing it to a 4.6% Rubio lead. This once again puts Florida in the “could go either way” category based on my classifications, and so improves Clinton’s best case.
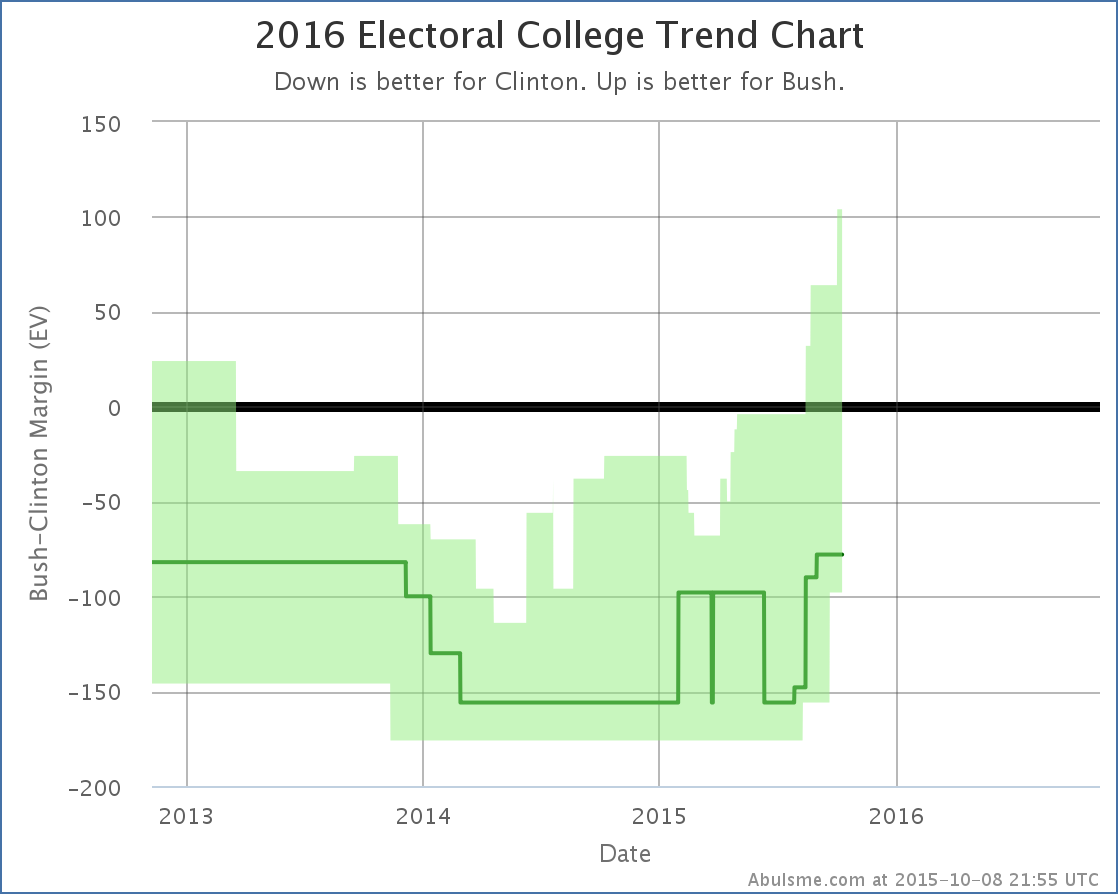
With all of these changes, here is the new “bubble”:
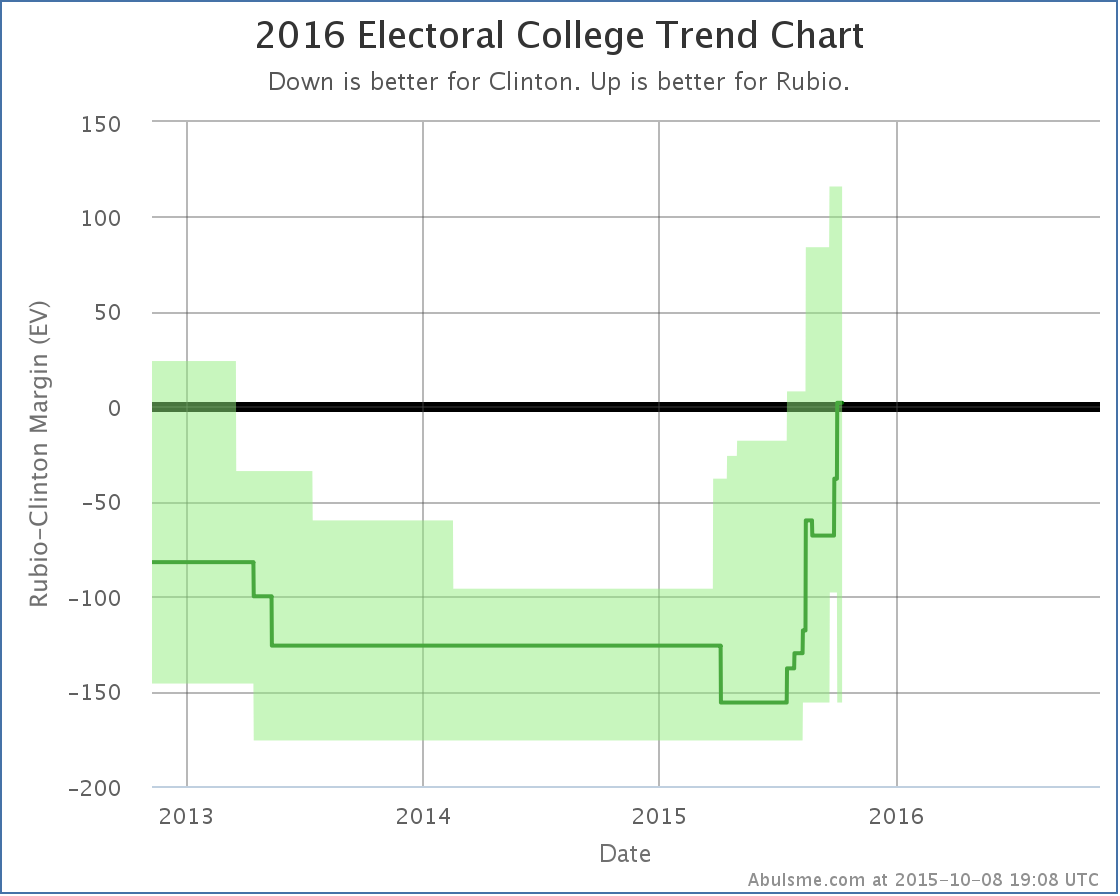
One of the most surprising things about this chart, especially compared to how things looked a year ago, is just the height of that bubble… the range of possible outcomes that are reasonable given the current state of polling. Right now the summary looks like this:
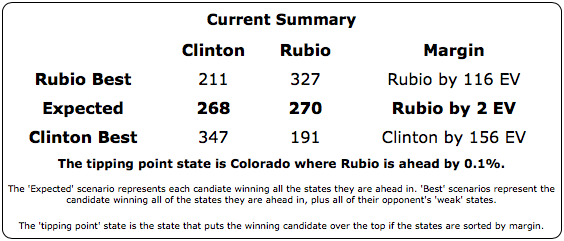
And the state spectrum:
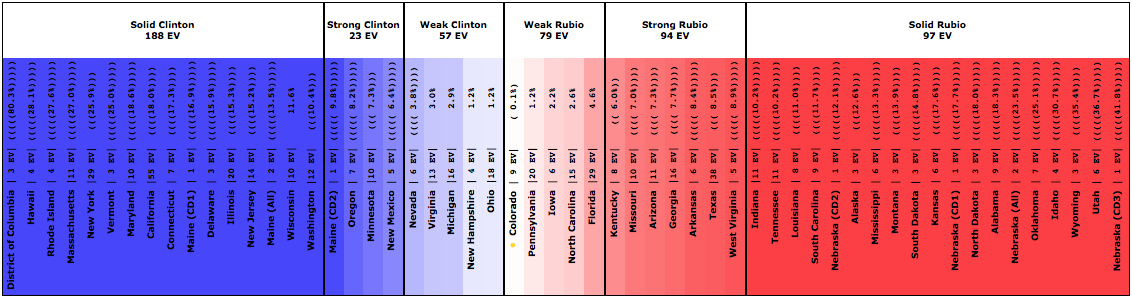
There are now TEN states where the polling is close. 136 electoral votes. Everything from Clinton winning by 156 to Rubio winning by 116 is plausible given only minor moves in the polls. This is a huge range of possible outcomes here.
Right now, the tipping point is right smack in the middle of those states, five on each side of the line… with a margin in the tipping point state of only 0.1% and Rubio ahead by only TWO electoral votes. The only way this could be closer is if we were actually looking at a 269-269 tie.
Right now, 13 months from the election, Clinton vs Rubio is as close to an even race as you could possibly imagine. But with the huge number of close states, it is “close” in the sense of too close to call, but we can’t rule out the possibilities of either candidate winning by a significant margin! There are just too many states that could go either way. (Having said that, results closer to the middle of the range are indeed more likely than those at the edges. Having ALL the close states go to one candidate or the other is extremely unlikely.)
A lot can and will happen in the next year… it is certainly possible that neither of these two candidates end up as the nominees. But this can’t be where Clinton hoped to be at this point. She wanted to be seen as not just inevitable for the Democratic nomination, but with a very healthy lead in the general election.
That is not what is happening.
The question now is if Rubio is able to start strengthening this into a clear lead, instead of just a toss up. Can he start flipping Ohio? New Hampshire? Michigan? If current trends continue, it would not be surprising…
Clinton vs Bush
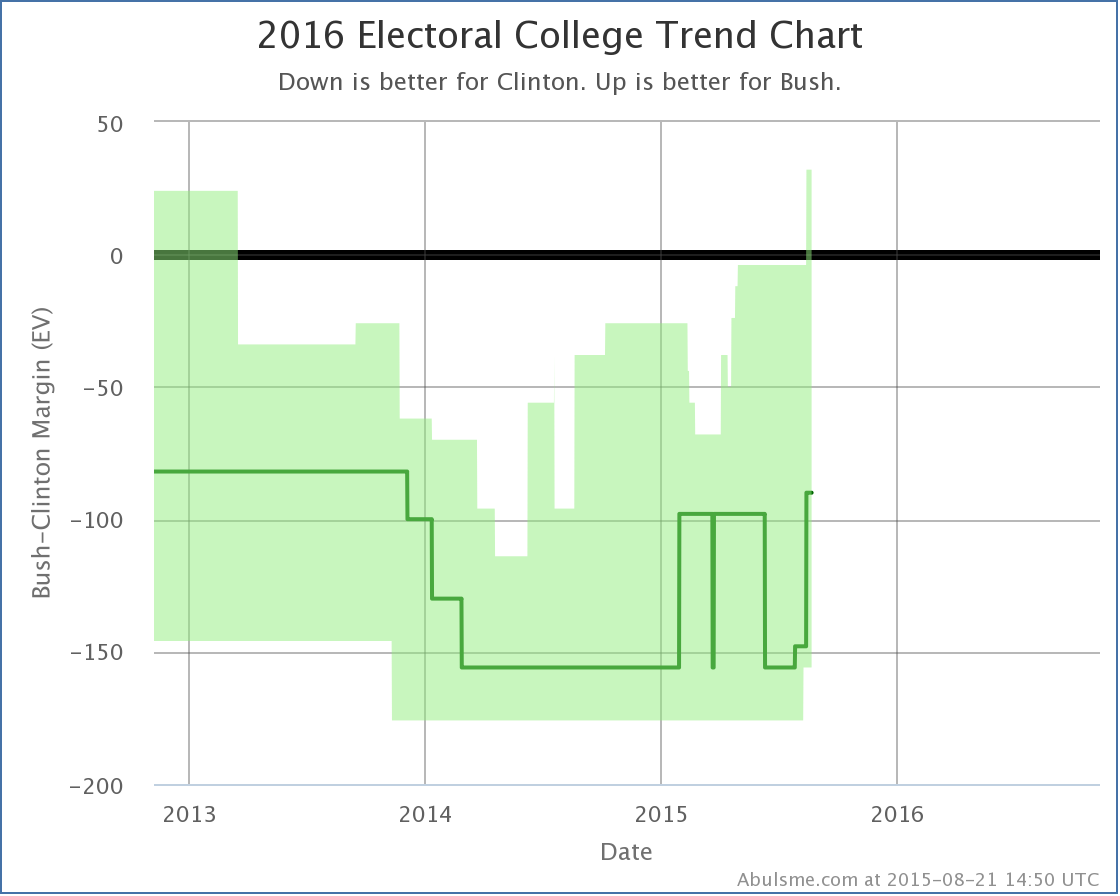
Although the big news was in Clinton vs Rubio, there was also a change in Clinton vs Bush. It also favored the Republican.
Bush is a bit behind Rubio in his Pennsylvania polling against Clinton, but it has also been consistently improving for months. With today’s new poll, Clinton’s lead drops to 2.4%, putting Pennsylvania in the swing state category, and improving Bush’s best case.
Pennsylvania moving into the realm of the possible is that spike in the upper right. Bush’s best case is now to win by 104 electoral votes. The range of possibilities isn’t quite as wide as with Rubio, but at 101 electoral votes in play, it is still pretty wide.
None of this is a prediction of what will happen in November 2016. We are still too far away for that. It is just a snapshot of where we are today.
397.1 days until polls start to close. A lot of drama yet to come in those days.
Note: This post is an update based on the data on ElectionGraphs.com. All of the charts and graphs seen here are from that site. Graphs, charts and raw data can be found there for the race nationally and in each state for every candidate combination that has been polled at the state level. In addition, comparisons of the best polled candidate combinations both nationally and each in each state are available. All charts above are clickable to go to the current version of the detail page the chart is from, which may contain more up to date information than the snapshots on this page, which were current as of the time of this post. Follow @ElecCollPolls on Twitter for specific poll details as I add them. And like Election Graphs on Facebook!
A bunch of changes today prompted by the latest Quinnipiac Swing State Poll. The TL;DR is that Clinton’s situation continues to deteriorate.
The Republicans are gaining on her, despite any talk myself or others have been doing about the Trump phenomenon hurting Republicans more generically. If that is going to happen, there is no good evidence of it yet, at least in state level general election polling.
Specifically, Rubio and Bush are nipping at Clinton’s heels. In today’s update, Bush’s best case moves into winning territory, Rubio’s already winning best case gets even better, both candidates improve their “expected” results and the tipping points are getting very close.
To actually win at this point, Rubio only needs to hold the states he already leads and flip North Carolina (Clinton +0.4%) and Pennsylvania (Clinton +2.4%). Bush has to flip a few states that are already leaning Rubio as well, but at this point he has his tipping point down to only a 3.8% Clinton lead. Easily within the reach of a campaign that goes his way.
Now the details for those who want them.
Clinton vs Rubio
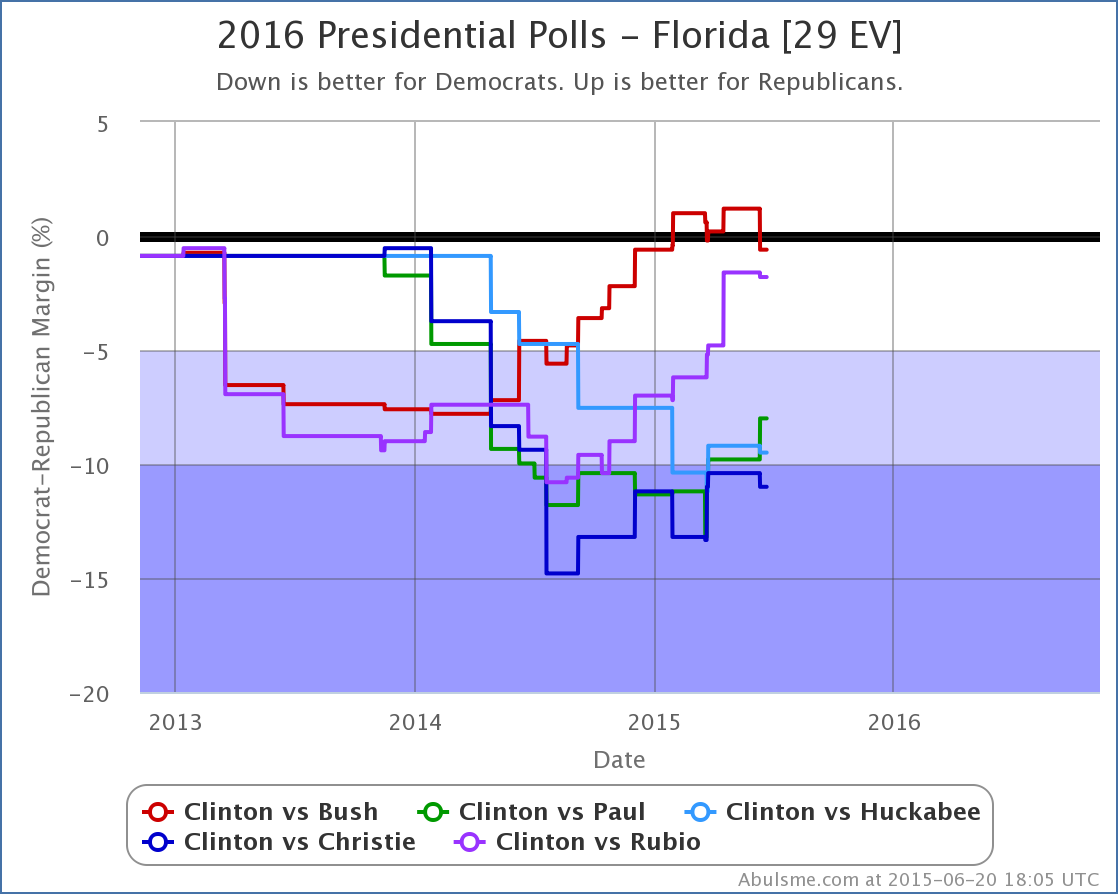
Rubio moves states into better categories for him in Florida, Pennsylvania and Ohio. A quick look at all three charts:
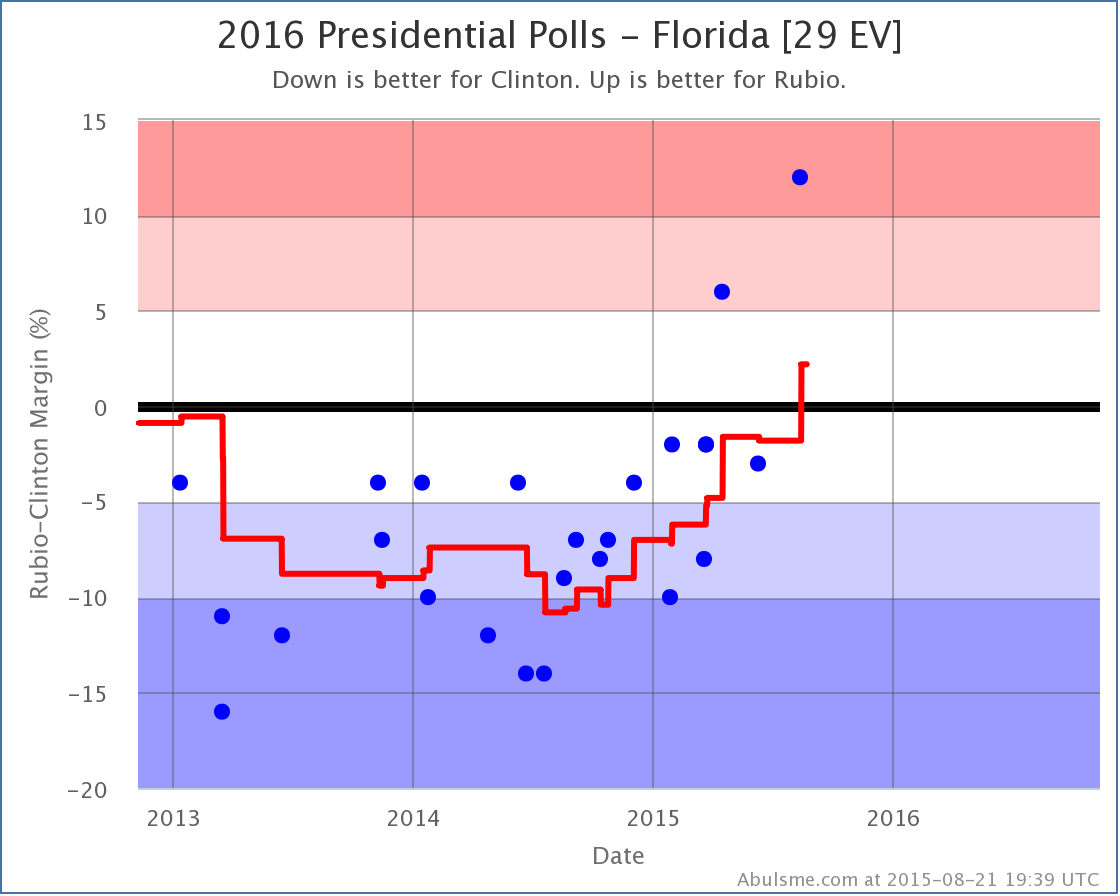
Now, an argument could be made that some of these new data points look like outliers. But we don’t know until we have follow up polls, and that is why we use poll averages and not single polls anyway, so we include the polls in the average and just see what that does.
Florida (29 ev) flips from Weak Clinton to Weak Rubio, improving Rubio’s expected result to Clinton 299 to Rubio 239. This is still a 60 point electoral point loss, but this is the best “expected case” we have seen on any Republican with a significant amount of state level polling against Clinton.
Meanwhile, with both Pennsylvania (20 ev) and Ohio (18 ev) moving from Strong Clinton to Weak Clinton, a very large chunk of electoral votes gets added into the “possible pick up” category for Rubio’s best case, which is now Clinton 227, Rubio 311… an 84 electoral vote WIN for Rubio. This is also the best “best case” we have seen for any significantly polled Republican so far.
This is what Rubio’s “bubble” looks like now:
Florida, Pennsylvania and Ohio are huge electoral prizes. They make a massive difference on these charts. With a Republican in the lead in Florida, and competitive in Pennsylvania and Ohio, it really is a whole different ball game.
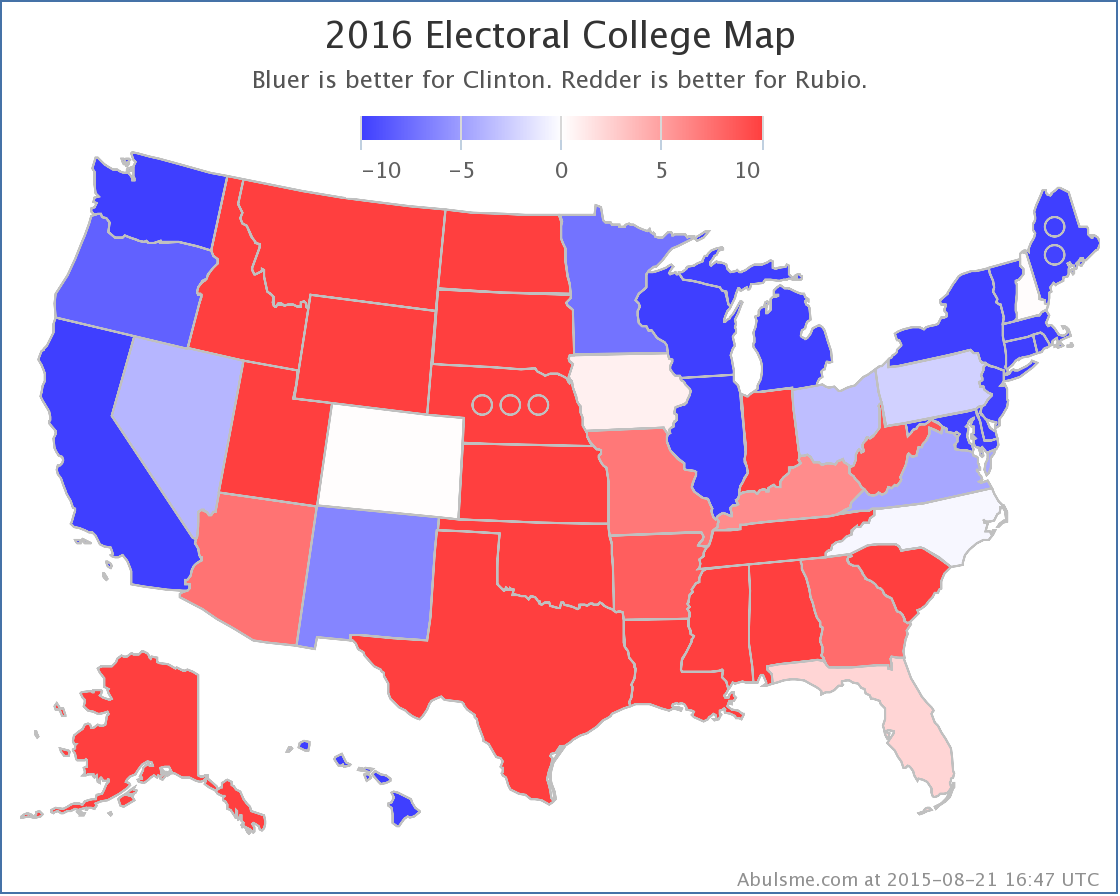
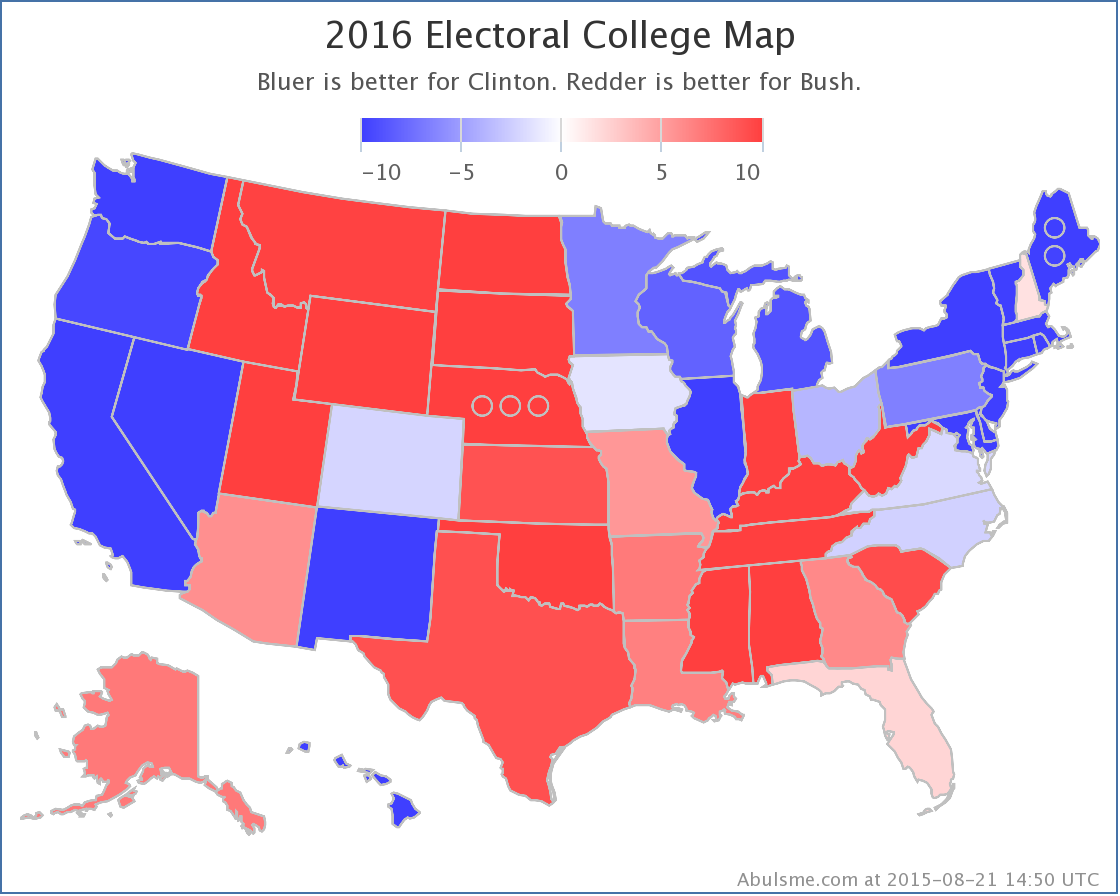
This is the Clinton vs Rubio map right now. With a map like this, Clinton still wins, but it is very very close, and the slightest issue would give the election to Rubio.
Clinton vs Bush
Looking at the Bush charts in FL/PA/OH:
Bush also flips Florida. This improves Bush’s expected case to Clinton 314, Bush 224. This is a 90 electoral vote loss, but better than Bush has looked since late 2013.
And Bush also moves Ohio from Strong Clinton to Weak Clinton. Unlike Rubio though, he does not quite bring Pennsylvania into this category. The trend is there. Pennsylvania has been moving toward Bush all year. But Clinton’s lead is still over 5%. Perhaps that will change with the next poll. But Ohio by itself is enough to improve Bush’s best case to Clinton 253, Bush 285, which is a 32 electoral vote Bush WIN.
So we get Bush’s new bubble:
And his new map:
At this point, Clinton vs Bush and Clinton vs Rubio are the only two of the five best polled candidate pairs where the Republicans have a winning best case. But are the trends heading there for anybody else? Lets take a quick look.
Comparisons
Sometimes the national charts can give good comparative insight, but this time since we’ve been concentrating on FL/PA/OH, lets just look at those comparisons for now.
So just at a glance, in Ohio and Pennsylvania all or most Republicans are improving against Clinton. They almost seem to be moving as a bunch. (Except maybe Huckabee.)
But it looks different in Florida. In Florida, Rubio and Bush have separated themselves from the rest of the crowd. They are the only two of these five making Florida competitive. The others are just wandering around in Strong Clinton territory, with no clear trend between them.
It is very hard to map a Republican win without Florida. Possible maybe, but very hard. The trends are clearly going toward the Republicans in many states. For Rubio and Bush, Florida is doing the same. If the general trend against Clinton continues, we should start seeing other candidates gain ground in Florida too, but it isn’t in evidence yet.
But overall, Clinton is losing ground, and the race is getting closer.
445.1 days until polls start to close.
Note: This post is an update based on the data on my 2016 Electoral College Analysis Site. All of the charts and graphs seen here are from that site. Graphs, charts and raw data can be found there for the race nationally and in each state for every candidate combination that has been polled at the state level. In addition, comparisons of the best polled candidate combinations both nationally and each in each state are available. All charts above are clickable to go to the current version of the detail page the chart is from, which may contain more up to date information than the snapshots on this page, which were current as of the time of this post. Follow @ElecCollPolls on Twitter for specific poll details as I add them.
Today’s update (which included a Detroit News poll in MI and Quinnipiac polls in Florida, Ohio and Pennsylvania) brings seven changes of note to the five best polled candidate pairs. Plus Clinton vs Bush once again takes the top spot as the best polled candidate pair, but there isn’t much else to say about that. As usual, click on any of the charts for more details from election2016.abulsme.com or follow @ElecCollPolls on Twitter for detailed poll information as I add it.
Tipping Point Moves
Five of those seven changes are tipping point changes. (Reminder: The tipping point is the margin in the state that would put the winning candidate “over the top” in the electoral college.) The tipping point changed for all five of the candidate pairs, so instead of looking at them individually, lets look at the comparison:
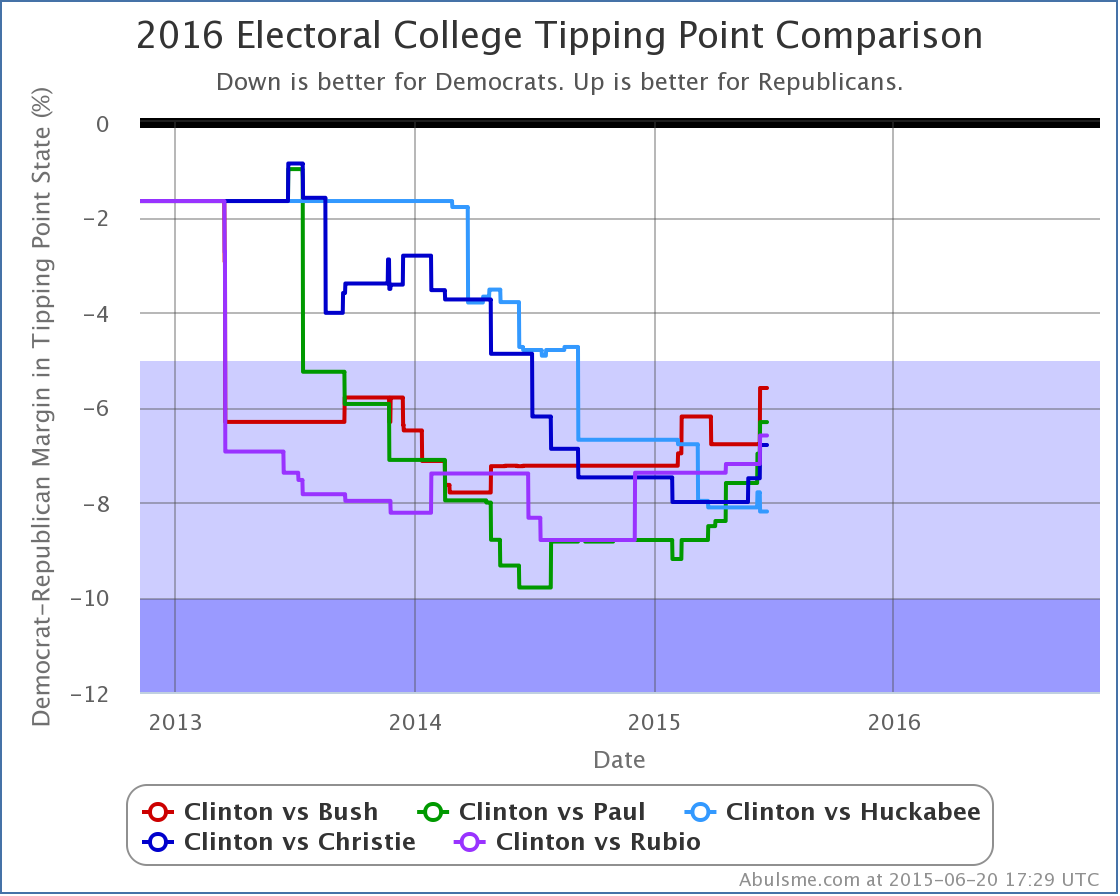
Looking both at the most recent change, and also at the change over the last three months, Bush, Paul, Christie and Rubio have all improved vs Clinton. Only Huckabee’s situation has worsened. For the candidates that are improving, the movement seems to be accelerating.
Bush’s tipping point specifically is down to only 5.6%. This still translates into a “Strong” lead for Clinton according to the categories I have defined, but we’re getting pretty close to the 5.0% boundary. Just a few more good polls for Bush in the right states, and the tipping point could move into the “Weak Clinton” zone, meaning that if Bush managed to win all of the close states (including the ones where Clinton is a little ahead) he would win. At that point, we would have an actual competitive race. Clinton would still be ahead, but a Bush win would be within the realm of reasonable possibility.
Clinton vs Bush
In addition to the tipping point changes, a couple of states changed categories. First up, Bush in Florida.
Florida moves from just barely Bush, to just barely Clinton. Bottom line, in this paring, Florida is close. Right now this is true for only Bush and Rubio. The other three Republican candidates in the top five polled pairs trail Clinton badly:
For Bush though, for the moment, Florida slips off the list of states he is ahead in, and his “expected case” drops:
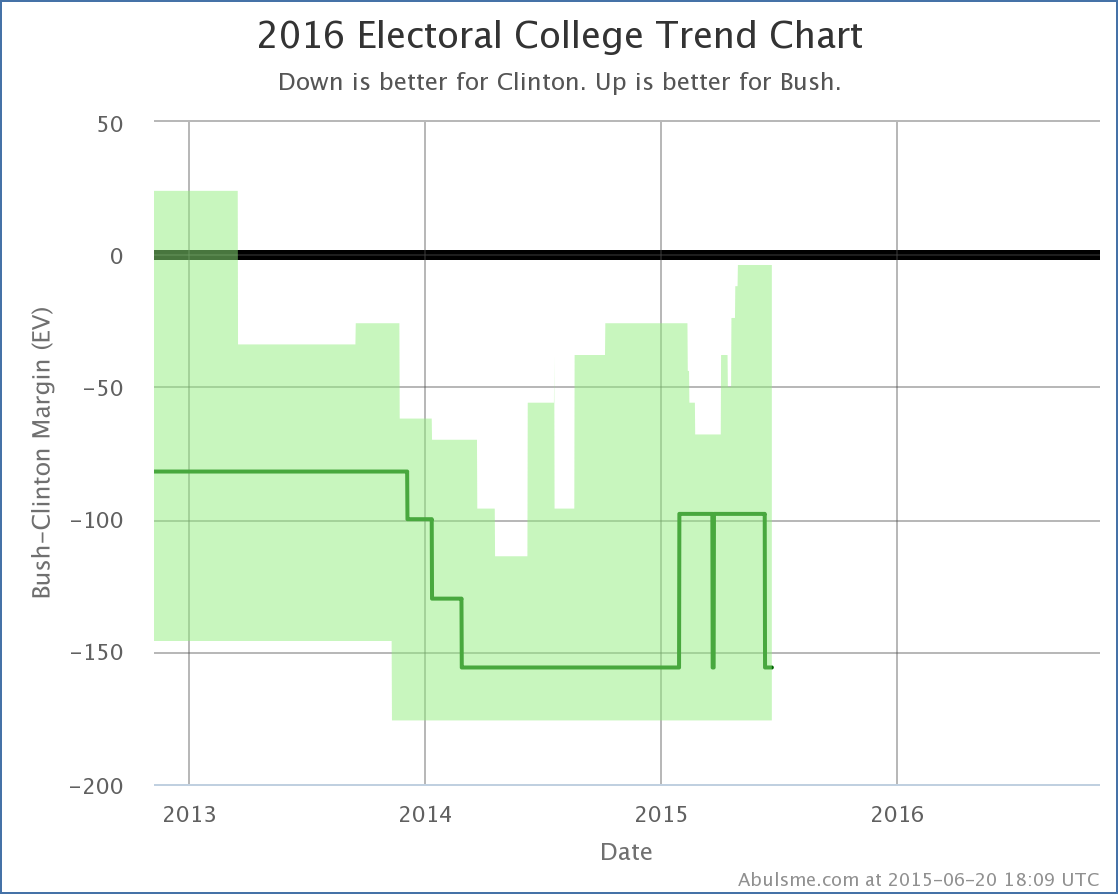
This brings Bush’s “expected” result back to Clinton 347 to Bush 191, a 156 electoral vote loss. (This is the same margin at the moment as Huckabee, Christie and Rubio… only Paul differs right now, losing by only 138 electoral votes because unlike the others, Paul is ahead in Colorado.)
Clinton vs Paul
The other category change is that in Clinton vs Paul, Ohio moves from Strong Clinton to Weak Clinton:
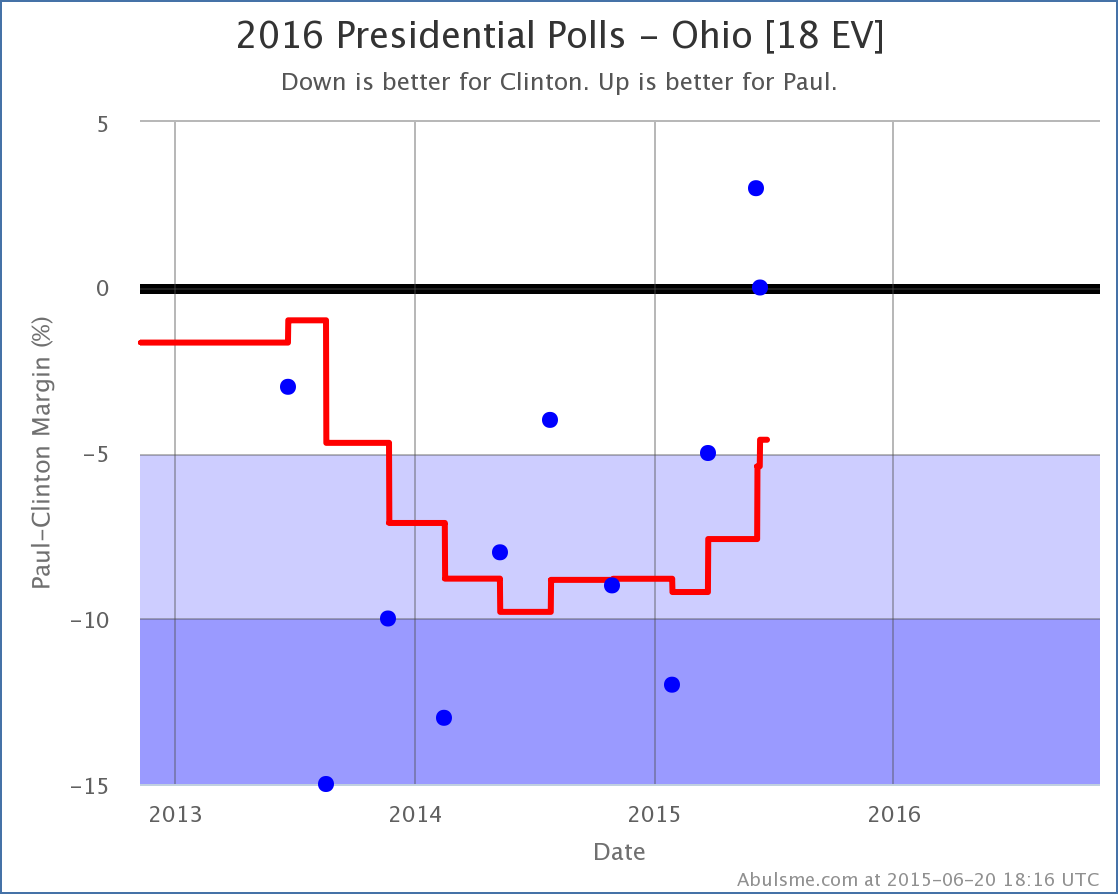
The last two polls actually show Paul ahead in Ohio. The average, which covers almost 8 months of polls at the moment, isn’t there yet, but it is moving in Paul’s direction. Ohio is looking closer and closer.
And that isn’t just Paul. If we do the comparison in Ohio, we see this movement is broader:
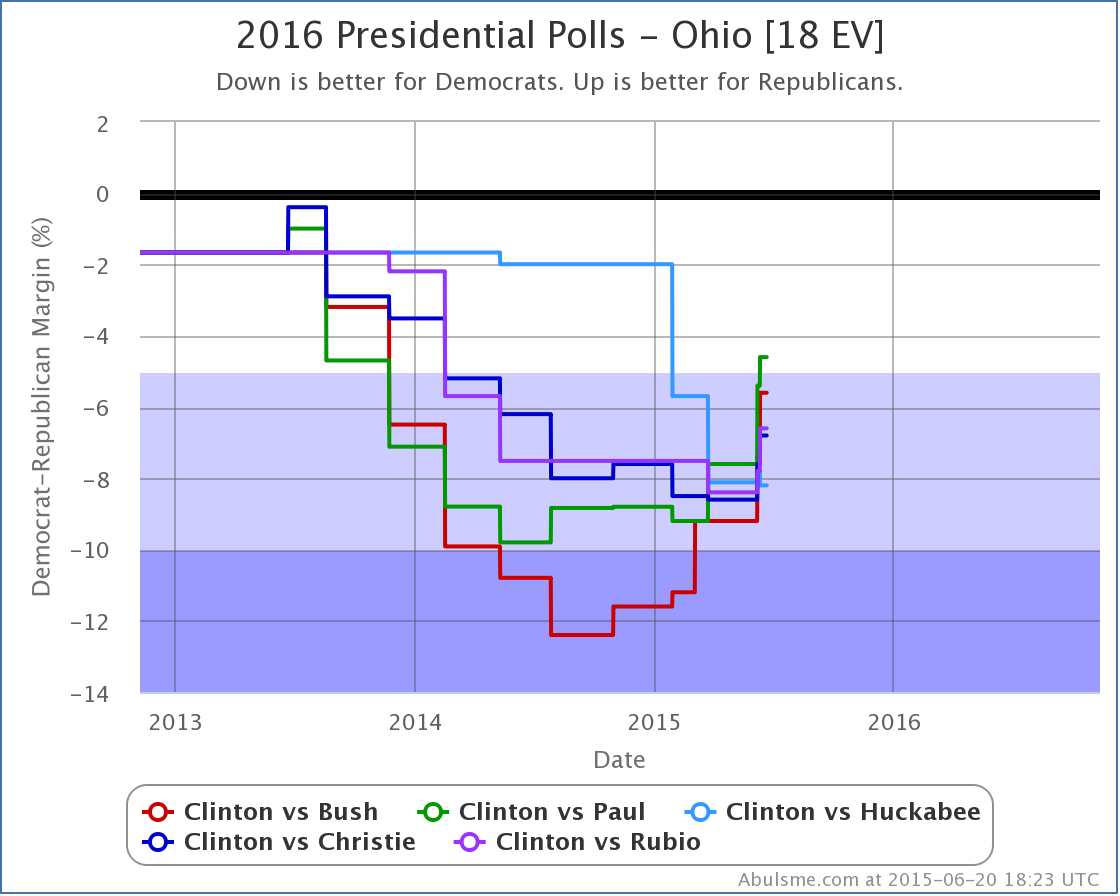
Once again, everybody except Huckabee is improving against Clinton. Or perhaps it would be better to say that Clinton is falling. Either way, Ohio is looking closer than it did. Paul is the first of these five candidates to move Ohio into the “potential win” category according to my classifications, but Bush isn’t far behind.
For Paul, this improves his “best case” where we give him all of the states he is ahead in, plus all the states where Clinton’s lead is less than 5%:
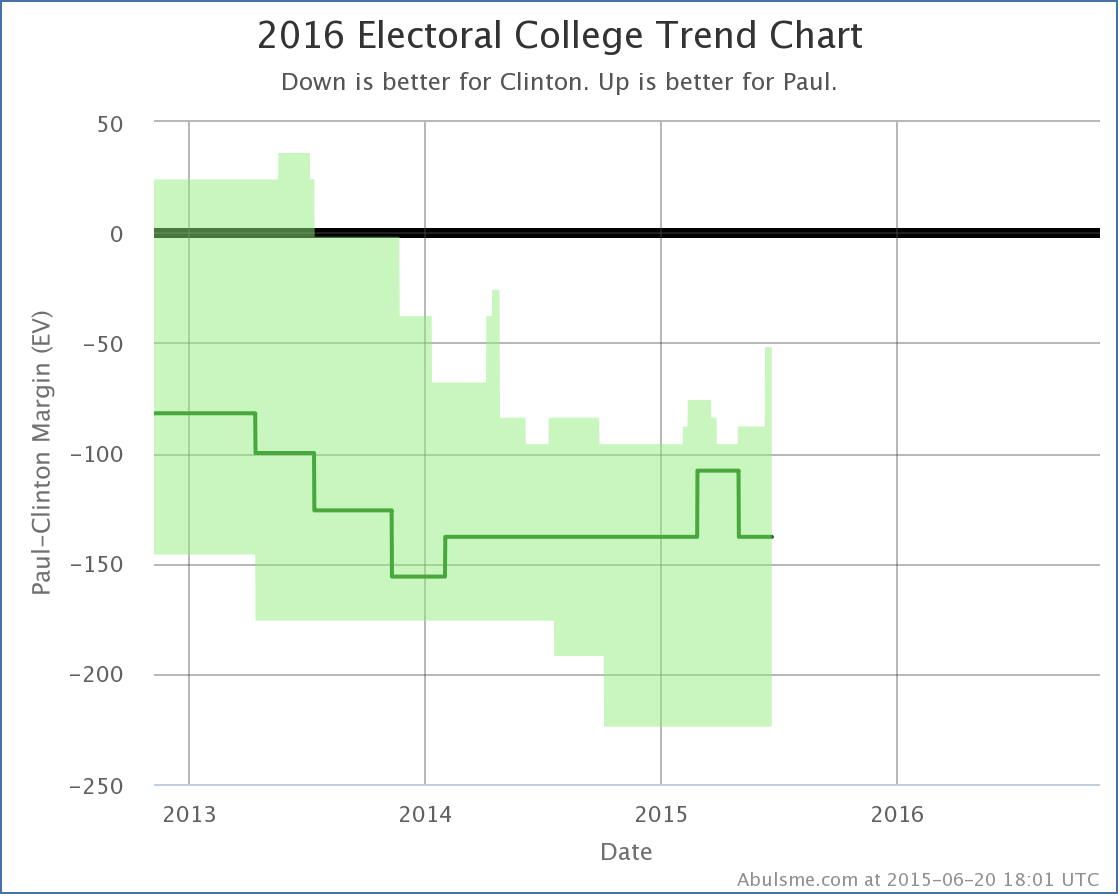
In his “best case” Paul now only loses to Clinton by 52 electoral votes. This is Paul’s best best case since I officially launched this analysis after the November election.
Pennsylvania
The polls this time around in Michigan didn’t change anything, but the ones in Pennsylvania are worth mentioning even though there were no category changes for any of the five candidate pairs.
Brandon Finnigan (@ConArtCritic) of the Ace of Spades HQ Decision Desk election tracking site tweets constantly about how Republicans should be targeting Pennsylvania as the keystone (get it?) to their election strategy. In his recent article “How The GOP Could Win Pennsylvania” he outlines the argument. So lets look at how the state is going given current polling. (Which of course will change a lot before we get to the election.)
Moves in Pennsylvania did contribute to some of the tipping point changes we talked about today, and when we look at Pennsylvania, we are seeing what looks like clear movement toward the Republicans, even though it isn’t quite switching categories yet:
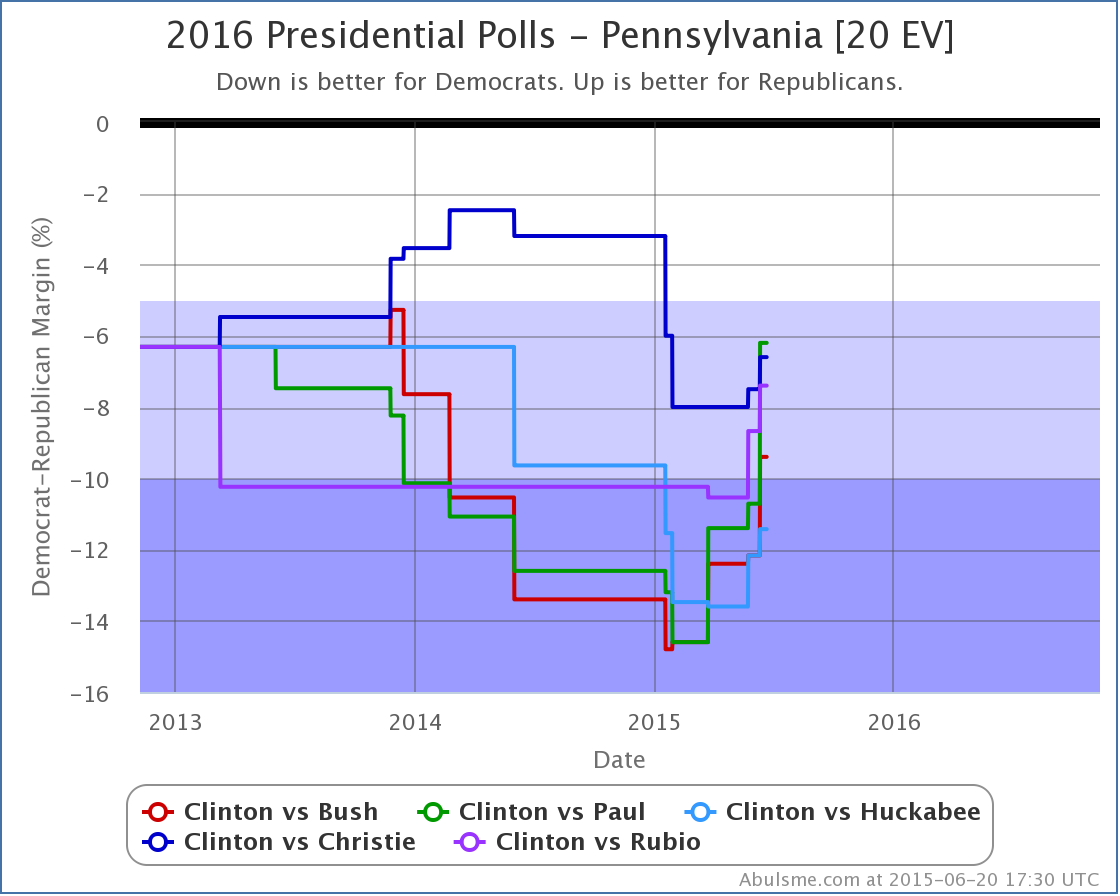
All five candidates have improved against Clinton in the last three months, some of them by large margins. Paul went from down by 14.6% in March, to down by only 6.2% right now. That is a huge move!
Now, this probably isn’t because any of the candidates are specifically targeting Pennsylvania at this point, but more likely just a reflection of Clinton’s overall decline nationally. None of the candidates have made it close in my poll averages yet, but Clinton’s margins have been narrowing rapidly.
Finnigan is certainly right that if the Republicans can make Pennsylvania close, let alone turn it red, this probably means an overall Republican victory in the electoral college, because whatever they did that could flip Pennsylvania would almost certainly flip other blue states that currently are closer than Pennsylvania as well.
Now, does that mean targeting Pennsylvania specifically rather than going after those closer states first is the best strategy? I don’t know.
For Bush for instance, if you start with the states he is already ahead in and then see which states he would need to flip to win, you get this list (in order by how far behind Bush is right now in my poll averages):
At that point Bush would have enough electoral votes to win. To get to Pennsylvania on this list, you’d have to also go past Minnesota, Nevada, Wisconsin, and Michigan. Then Pennsylvania.
Would it be better to concentrate directly on the seven states above? Or is jumping forward to Pennsylvania’s 20 electoral votes somehow an easier path? If Pennsylvania is specifically more vulnerable due to some of the factors Finnigan mentions, then maybe.
I think Finnigan’s point is broader than that though. It isn’t that Pennsylvania is a better target than Ohio or Colorado, although maybe it is. It is more that if the Republicans took Pennsylvania seriously, and did everything they needed to do to win Pennsylvania, then those same things could be applied more broadly, and a lot of other states would move too, and the Republicans would not just win, but win clearly, not a “just barely” sort of win like they got in 2000 and 2004.
The movement we’re seeing so far does show that Pennsylvania is movable. Can it move enough to make it red? I have my doubts absent the Democratic candidate simply collapsing on a nationwide basis. But Pennsylvania might be worth watching anyway…
Bottom Line
Aside from Florida moving her direction but remaining pretty close, and Huckabee generally not doing well, Clinton seems to be continuing to weaken against most Republicans. This reflects the campaign beginning to get under way in earnest, and the name recognition gap slowly diminishing. The question is where this trend ends. After a few debates happen, do we reach some sort of steady state Clinton lead a bit narrower than it is today, or do the Republicans continue to gain on her until we really have a race that could go either way, or even with Republicans in the lead?
As usual, stay tuned. 507 days to go!
Note: This post is an update based on the data on my 2016 Electoral College Analysis Site. All of the charts and graphs seen here are from that site. Graphs, charts and raw data can be found there for the race nationally and in each state for every candidate combination that has been polled at the state level. In addition, comparisons of the best polled candidate combinations both nationally and each in each state are available. All charts above are clickable to go to the current version of the detail page the chart is from, which may contain more up to date information than the snapshots on this page, which were current as of the time of this post. Follow @ElecCollPolls on Twitter for specific poll details as I add them.
Edit 23:07 UTC to add some additional links to the election site and Twitter.
This last week brought a new set of Ohio results from PPP. With this poll Clinton lost significant ground against basically all opponents in the averages. Concentrating as we usually do on the five best polled candidate combinations, this is what we see:
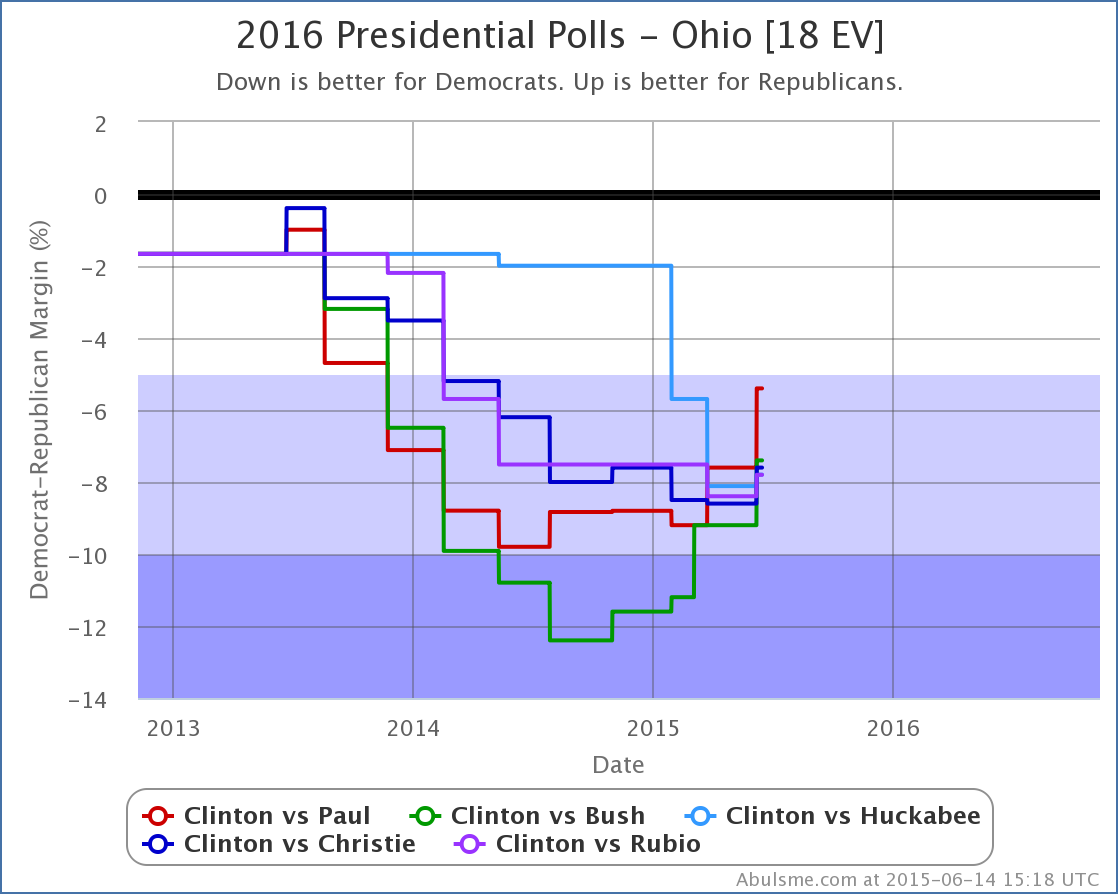
All five of these candidates improved against Clinton based on this latest poll. Looking back a little and comparing now with three months ago, we see that Paul, Bush and Christie have improved their positions, while Rubio and Huckabee have fallen further behind. Of these, Paul has moved the most, from down by 9.2% in March, to only down by 5.4% now, a gain of 3.8%. Paul now does the best of these five candidates against Clinton in Ohio.
Ohio is not a good place for Clinton to be losing ground. Ohio’s 18 electoral votes can make a huge difference. Many paths for Republican victory require Ohio. And the losses here are quite possibly indicative of similar slippage in other states that haven’t been polled enough lately to see it yet. This is not a happy trend for Team Clinton.
Lets switch to looking nationally. Do we see loss of ground there too?
These changes in the Ohio average directly change the tipping point for two of the five candidates, Paul and Huckabee. Paul moves from being down by 7.6% with the tipping point in Ohio, to only being down 7.0% in Minnesota. Meanwhile Huckabee moves from being down 8.1% with the tipping point in Ohio, to being down 7.8%, with his tipping point still in Ohio.
But lets look again at all five candidates against Clinton over not just this change, but the last few months:
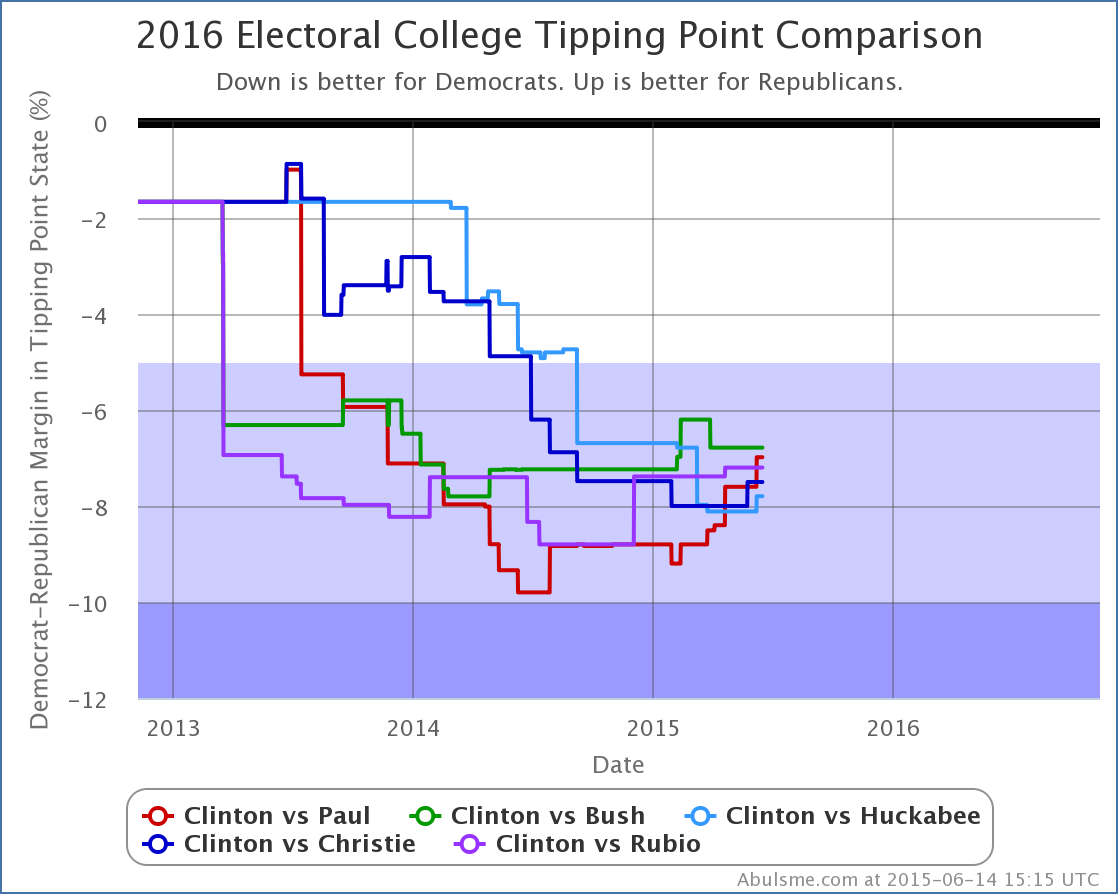
Once again lets compare now to three months ago. Remember, the tipping point essentially represents how much national public opinion needs to move to flip the electoral college result. Paul, Huckabee, Christie and Rubio have all improved since March. Only Bush has declined in that timeframe. (Bush is still better than he was six months ago though.)
Also once again, Paul has improved the most against Clinton during that the last three months, going from down 8.8%, to only down 7.0%.
And yes, yes, all five of these candidates are still way behind. But the overall movement seems to be in the Republican’s favor at the moment. If these trends continue, before too long we may have an actual race on our hands instead of a Clinton blowout!
As I noted in the latest Curmudgeon’s Corner podcast, the real media bias is toward having an exciting race, and while I’m not “the media” I am not immune to this bias… a closer race is a more fun race to watch… so I’ll always be rooting for whoever is behind. :-)
Seriously though, when I posted my first analysis of the 2016 race on this site in November, I mentioned that we should expect tightening, and that Clinton would most likely never again look as good as she did then. The general public had barely heard of most of the non-Clinton candidates, she had come off her Secretary of State stint with fairly high approval ratings, and the campaign against her had yet to start in earnest… and she had been keeping quiet, so fewer opportunities for her to make mistakes too.
As things get in to gear, all of those things change. We’ve just seen the very beginnings of this, and already there is a visible impact in Clinton’s lead. Her lead is still a healthy one, but we’re definitely seeing the signs of the battle starting to be engaged.
513 days to go.
Note: This post is an update based on the data on my 2016 Electoral College Analysis Site. All of the charts and graphs seen here are from that site. Graphs, charts and raw data can be found there for the race nationally and in each state for every candidate combination that has been polled at the state level. In addition, comparisons of the best polled candidate combinations both nationally and each in each state are available. All charts above are clickable to go to the current version of the detail page the chart is from, which may contain more up to date information than the snapshots on this page, which were current as of the time of this post.
Today’s poll update was the addition of the Quinnipiac Swing State Poll, which included Florida, Ohio and Pennsylvania. Within the five “best polled” candidate combinations, this caused three changes worthy of note here. All three were moves toward Clinton and away from the Republicans.
First up, since it is the only one that actually involves changing the electoral summary for a candidate pair… Clinton vs Huckabee.
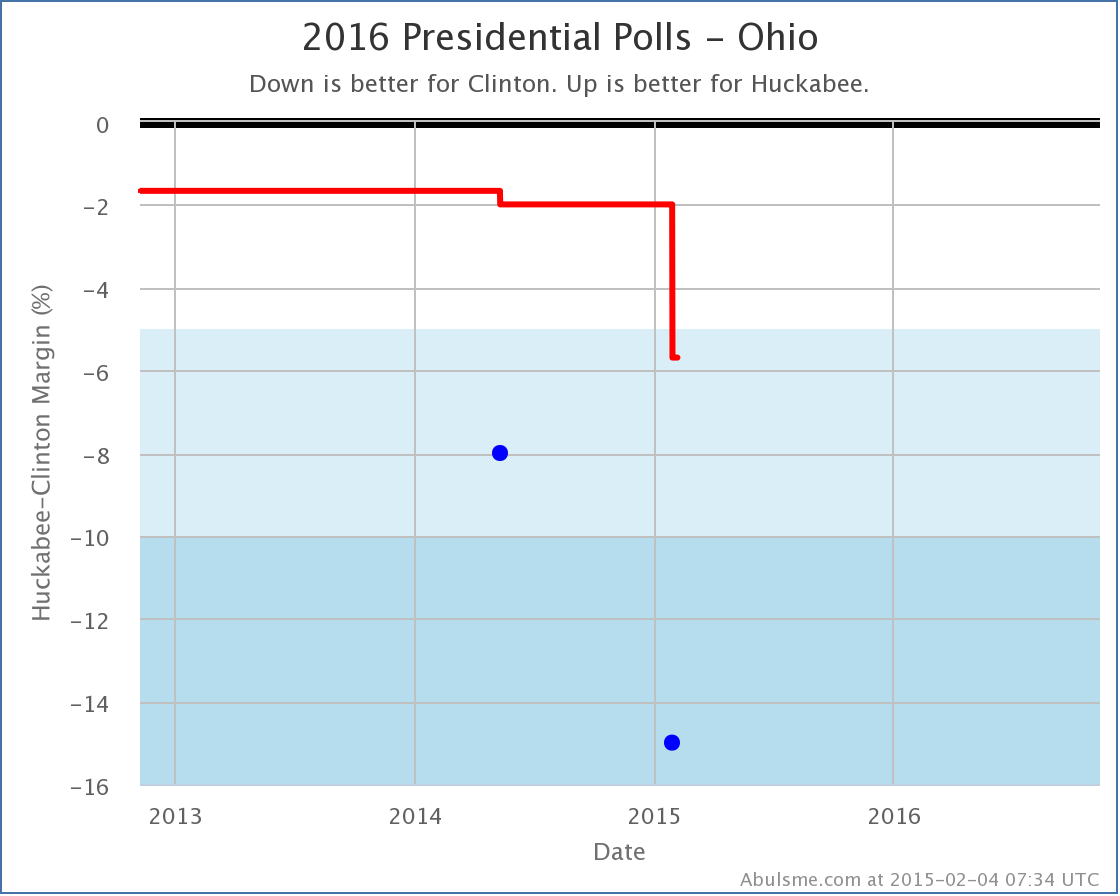
This is only the second time Clinton vs Huckabee in Ohio has been polled, but both new polls pull the state more toward the Democrat than the average of the last five presidential elections (which gave a 1.7% Dem advantage). This latest Ohio poll pulls the five poll average to a 5.7% lead for Clinton, which takes the state out of the “Weak” category which I allow to swing back and forth between the candidates to produce the “Best Case” scenarios for each candidate.
With the loss of Ohio from the list of “Possibles”, Huckabee’s “best case” moves from Clinton by 14 EV, to Clinton by 50 EV.
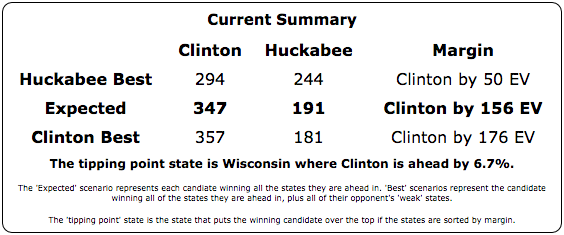
Of the five “best polled” candidate combinations, Clinton vs Huckabee is still #5 with much less comprehensive polling than Paul, Bush and Christie, so this may still be overstating where Huckabee would really be if more states were more fully polled.
The next two changes don’t actually change the Expected or Best cases for candidates, but rather are just changes to the “Tipping Point”. The tipping point essentially describes how much polls would have to move nationally (assuming an even distribution of movement in all states) to change who has the lead in the electoral college… in other words, how far ahead or behind the candidate is overall.
So next up is Clinton vs Paul:
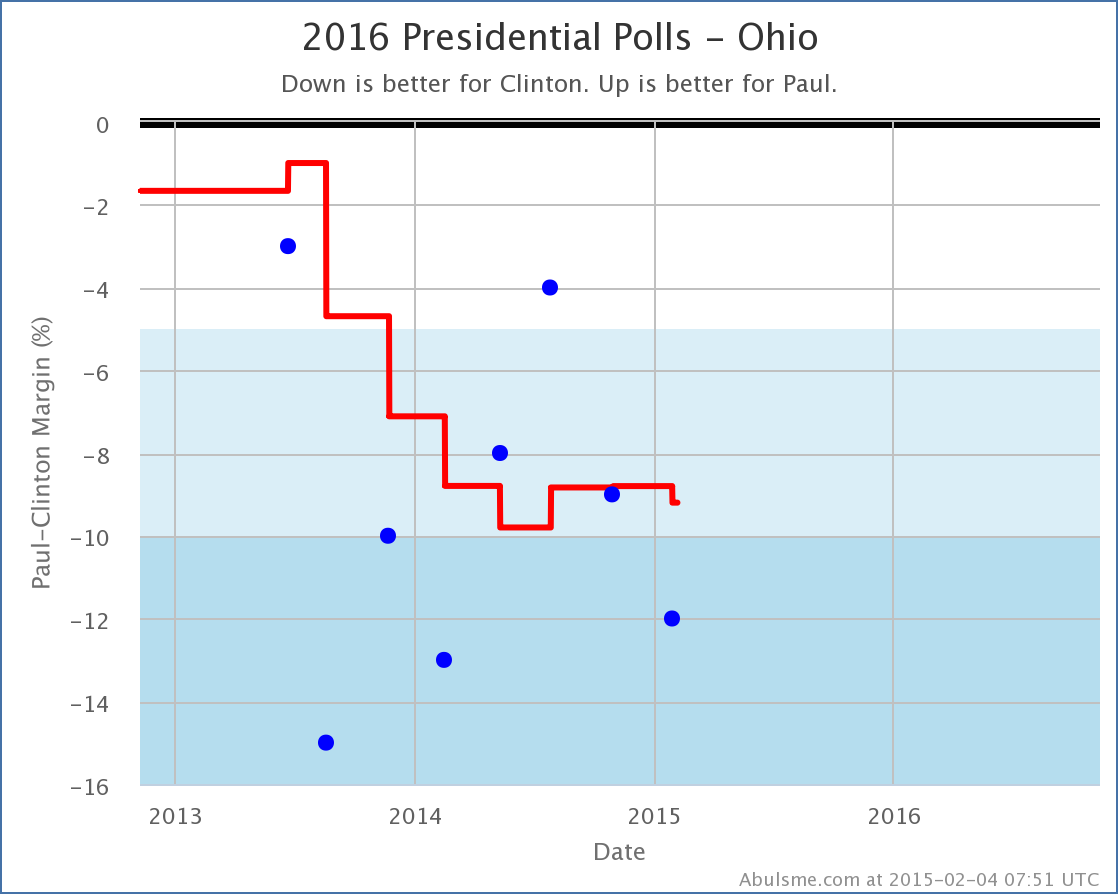
With the new poll, Paul moves from being behind 8.8% in Ohio, to being behind 9.2% in Ohio. Both of these are in the “Strong Clinton” category, so there is no category change here, but Ohio was the tipping point state in this contest, and so any movement in this state will generally mean movement in the tipping point.
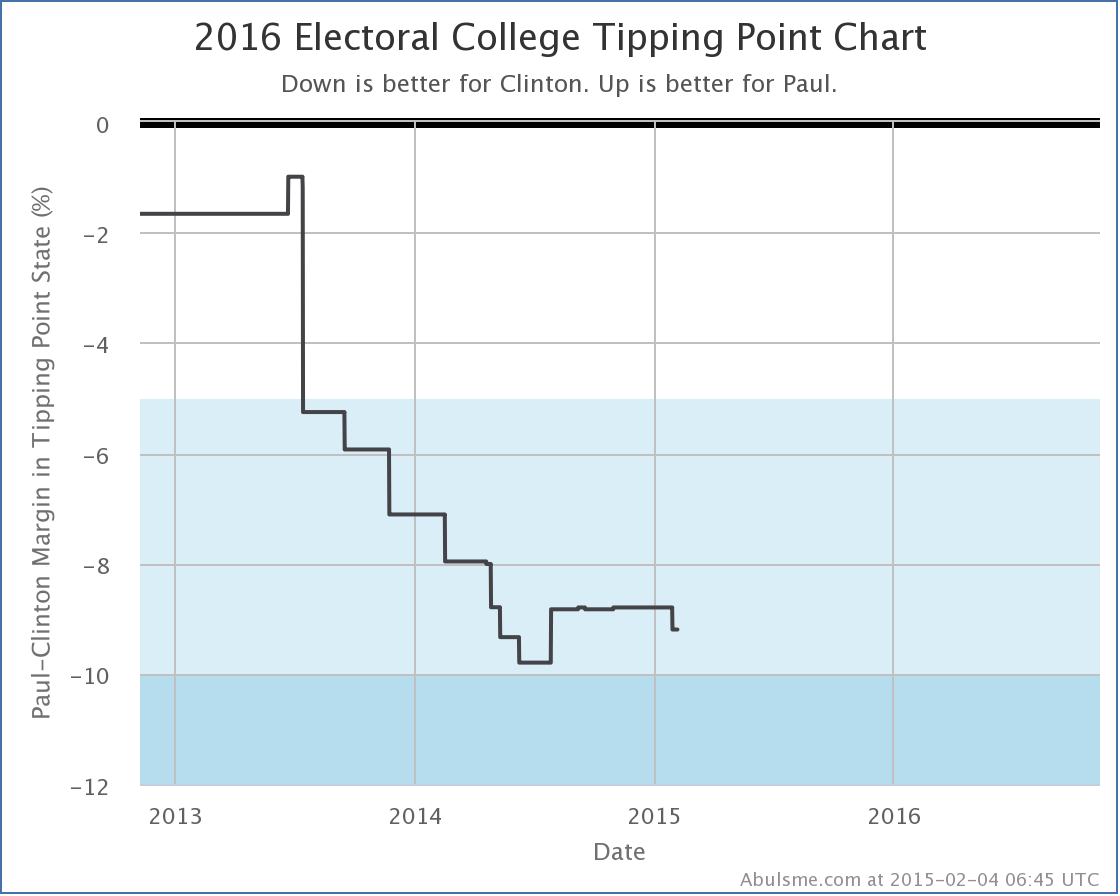
As you can see, the Clinton vs Paul tipping point has been between an 8% and 10% Clinton lead for most of the last year, so this isn’t breaking any new ground. The trend before last summer on this chart was basically just the process of getting enough polls to have a good view of this candidate pair, so things have essentially just been pretty flat since then. The new change doesn’t really change that, although I’m sure Paul would still rather see this line go in the other direction. (Well, if Paul was looking at my charts, which he isn’t. :-) )
Finally, Clinton vs Christie. This time, the changes in two states were relevant:
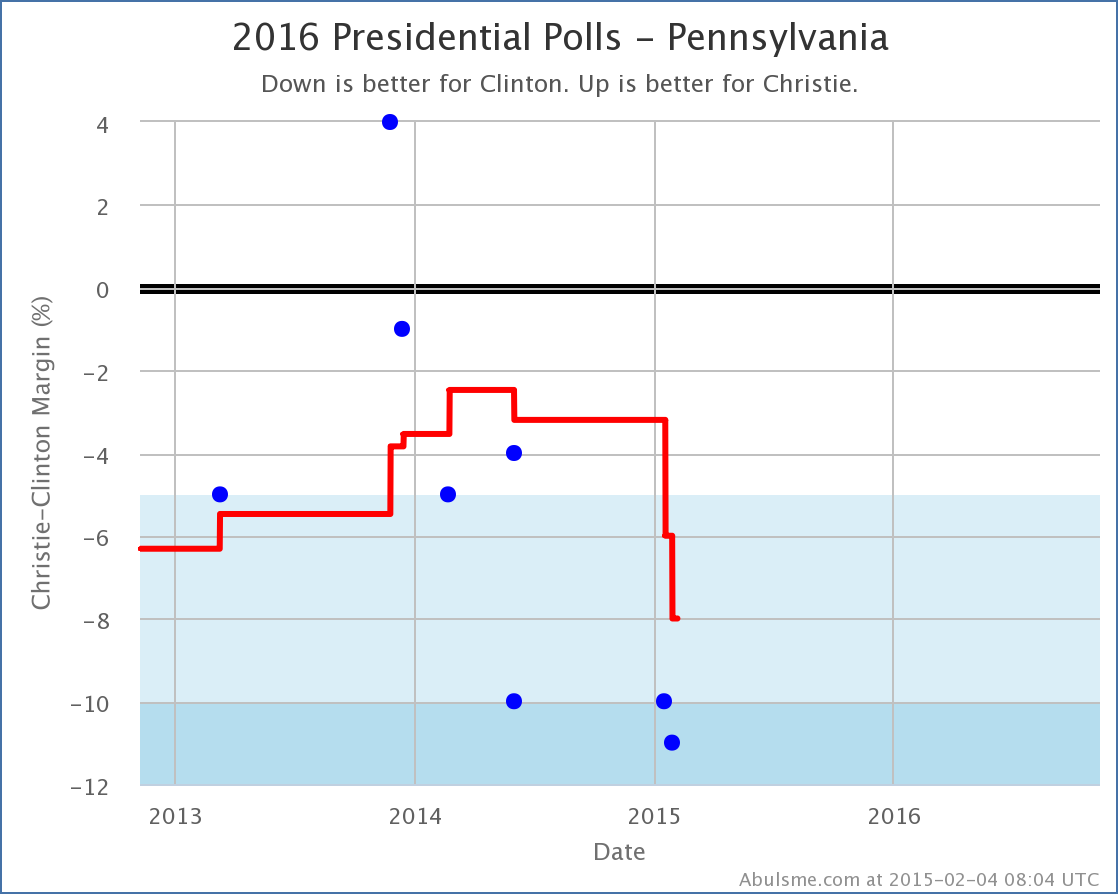
Last week I talked about Christie fading in Pennsylvania. The new polls today reinforce that trend, further worsening Christie’s position in Pennsylvania. It dropped him from being behind by 6.0% to being behind 8.0%, which pushed Pennsylvania past the previous tipping point of 7.5% in Minnesota.
Now, Ohio also moved away from Christie with today’s polls (from Clinton by 7.6% to Clinton by 8.5%). If it hadn’t, Pennsylvania would have pushed past Ohio too, which would have had a different result for the Tipping Point.
In the end, the tipping point for Clinton vs Christie moved from Clinton by 7.5% in Minnesota, to Clinton by 8.0% in Pennsylvania.
Unlike Clinton vs Paul, with Clinton vs Christie we’ve basically just been seeing a continued trend away from Christie and toward Clinton. Christie has not been faring well lately on this front.
Before closing up, lets look at a couple of the comparison charts between the five best polled candidate pairs.
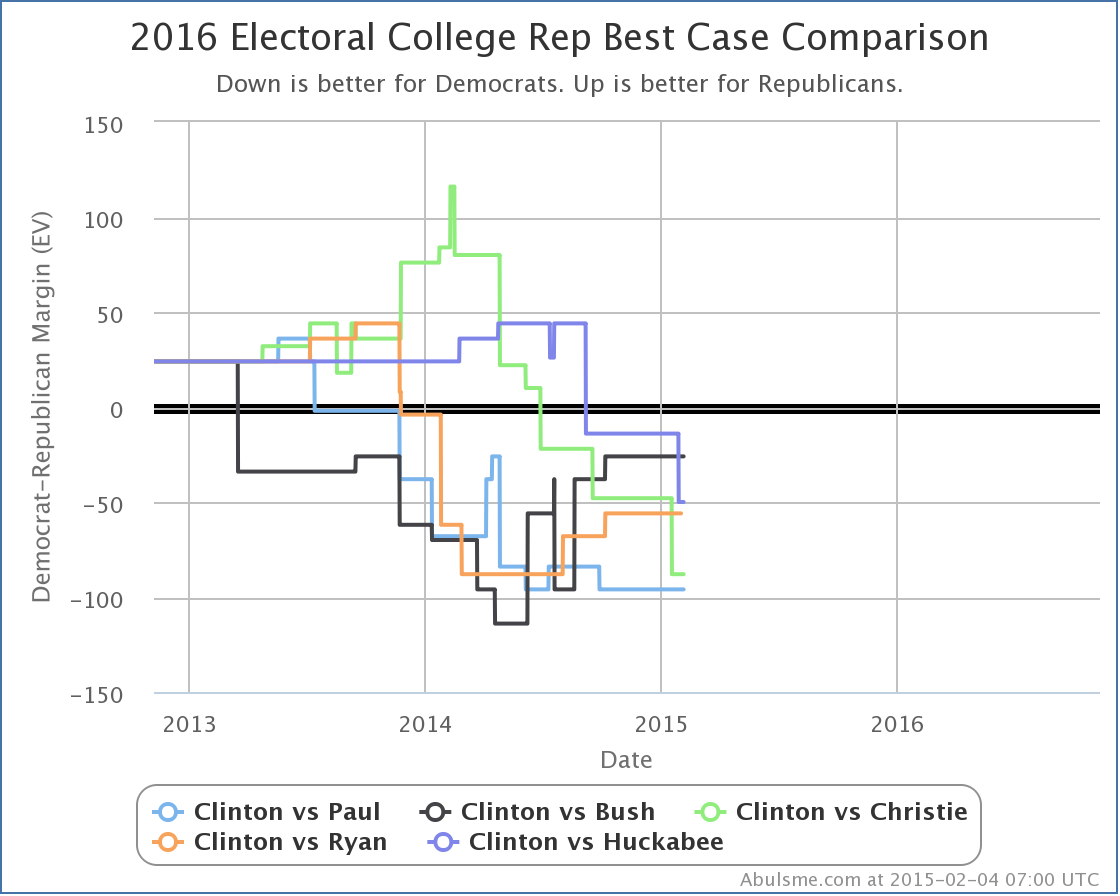
With Huckabee’s decline in best case, the Republican with the best best case against Clinton is now Bush, but that Best case is still losing by 26 electoral votes. (And the expected case if Bush did NOT manage to flip all the Weak Clinton states is Bush losing by 156 electoral votes.)
The worst best case versus Clinton is still Paul, losing by 96 electoral votes even if you give him all the Weak Clinton states. (Paul’s expected case is a bit better than Bush though, only losing by 138 electoral votes.)
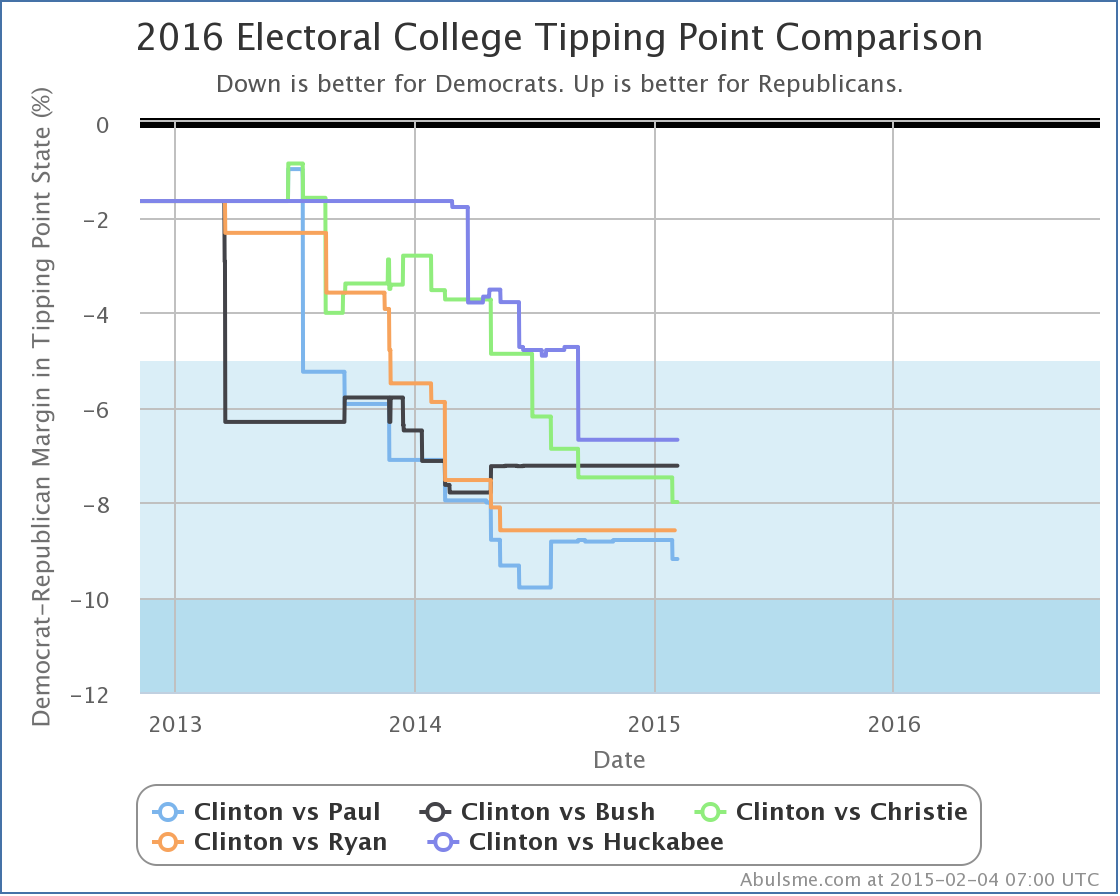
It looks a little different in terms of tipping point, with Huckabee doing best this time (behind by 6.7% in Wisconsin). Paul still in the rear here, behind by 9.2%.
Now, as people keep pointing out, and I will too, polls this far out from the election are NOT PREDICTIVE. All of the charts I’ve shown above say NOTHING about what the actual results in November 2016 will be. NOTHING.
However, that does NOT mean they are meaningless, or that they should be ignored. (Or why am I bothering with all this?) No, polls right now still give you a sense as to where things stand TODAY, which while it won’t tell you who will win 643 days from now, it DOES tell you how much work the candidates who are currently behind have to do in order to flip things. (Alternately, how much wiggle room the candidate in the lead has available as buffer against mistakes they might make.)
So, yes, pay attention to the polls. Even now. Just don’t make the mistake of believing that just because Clinton is way ahead of everybody now that necessarily means that will still be the case in a year and a half, when the polls DO start having some predictive power.
PS: There was also a tipping point change today for Clinton vs Romney but even with today’s new polls, Clinton vs Romney is still only the 20th best polled candidate combination, and with Romney declaring he isn’t going to run after all, he’s no longer as likely to climb the ranks as I thought a few weeks ago. If I had to guess as to the next change in the “Top Five” it would be Clinton vs Rubio (currently #7, but Rubio actively talking about being a candidate) replacing Clinton vs Ryan (currently #4, but Ryan having said he won’t run).
Edit 10:11 UTC – Added “Electoral College” prefix to title for consistency.


|
Romney |
Obama |
| Romney Best Case |
264 |
274 |
| Current Status |
206 |
332 |
| Obama Best Case |
205 |
333 |
Between 04:15 and 04:30 UTC, three more states were called. Missouri for Romney, and Oregon and Ohio for Obama. All three of these were fully expected, but Ohio put Obama over 270.
CNN waited until they called Ohio at 04:18 UTC to call the election, even though based on the polls by the time we got to election day, Ohio wasn’t even close. Once Iowa was called 9 minutes earlier, Romney had no more ways to win.
At this point, the only question is the margin of Obama’s victory.
As of this update, the five poll average hasn’t missed a state yet. Four states and two congressional districts to go.
(Of the close ones… there is also Alaska and Nebraska’s 3rd, but those will certainly go to Romney.)
Edit 2012 Nov 7 05:13 to add that last parenthetical note.

This was supposed to be a day where not much would happen in the polls, the campaign is after all over, right? But my final scan of the polls showed a flurry of polls moving things toward Obama in some key states. Now, a lot of these last polls are internet tracking polls, which some folks question and don’t include in their averages at all. But I have always included them.
As usual, I’ll start by looking at the three states changing status today, and then we’ll take one final look at all the swing states.

For most of the last month Wisconsin has seen an Obama lead of less than 5%. A new poll with a 7% lead for Obama gets added in my last update, and pushes the five poll average up above 5% to 5.3%. So Wisconsin gets pulled out of the list of states that Romney could even conceivably win. There won’t have been a 5% move in the last day or two, and even if the polls were very wrong, they won’t be THAT far wrong.

Ohio, Ohio, Ohio! All the talk the last few weeks (if not most of the last few months) has been about Ohio. But look at that trend. After bottoming in the middle part of October… a bottom which by the way was still a lead… Obama has been gaining ground day after day for the last two and a half weeks. Today there were a couple of new polls showing Obama with really big leads in Ohio. Those MIGHT be outliers. We’ll know when the votes are counted. But with or without those new polls today, the trend is undeniable. Obama has been ahead in Ohio all along, and the last few weeks has been increasing his lead.
Perhaps Romney’s decision to throw resources into Pennsylvania and Michigan reflect the fact he knew he had already lost Ohio. There are still ways to win without Ohio, but they are much harder.
Ohio had been on one of Romney’s best paths to victory. It seems to have slipped away. With today’s update the five poll average jumps to a 5.5% Obama lead. I no longer include the possibility of Romney winning Ohio in his best case.

Florida has been bouncing back and forth. I have said each time that it was essentially too close to call, and we would know who wins once the votes are counted. Today I added some new polls, some of which show a substantial Obama lead. As with Ohio, these MAY be outliers. But they do look like possible movement. The five poll average not only goes above the line, but actually jumps to the highest point it has been since the 1st debate… up to a 2.3% Obama advantage. This might… MIGHT… actually represent real movement.
By my five poll averages, Florida is now the second closest state. (The first is North Carolina, where Romney only holds a 1.4% lead.) So it could go either way. It EASILY could. But right now, at the very end, the polls seem to give the advantage to Obama.
The votes start getting counted in the eastern part of Florida in less than two hours. I guess we’ll know soon enough.
But, Florida flipping at the very last moment to Lean Obama, even if it really is still too close to call, does make me smile, because when we look at the map and summary…

|
Romney |
Obama |
| Romney Best Case |
310 |
228 |
| Current Status |
206 |
332 |
| Obama Best Case |
190 |
348 |
YES! That is right, 332-206 is back! As I tweeted a little while ago, “It is as if months and months of campaigning on both sides changed absolutely nothing…”
All year long, the “Current Status” of my five poll average has bounced around, but it has always returned to an Obama victory with a 332-206 margin. It has been like a magnet. It is as if this is where this race has “wanted” to be. This is the natural location of public opinion at the moment, with events temporarily pushing things one way or another, but this being the “normal” state that things return to.
Now, a few of the states are close. Nine states and two congressional districts have margins less than 5% at the moment. Four states have margins less than 2.5%. That would be North Carolina, Florida, Colorado and Iowa. If we see deviations from the “Current Status” those are the four states most likely to flip. And they very well might.
But time is running out, so let me jump to the summary of the close states as they stand in my five poll average today.
With the areas he is ahead by more than 5% in, Romney starts out at 190 electoral votes. Then we have the areas he is ahead in:
- Nebraska 2nd (1): 3.8% Romney lead
- North Carolina (15): 1.4% Romney lead
That gets Romney to 206 electoral votes. That is still 63 electoral votes short! So let’s start pulling in states in order of how far behind Romney is (and therefore how likely he is to flip them):
- Iowa (6): 2.0% Obama lead
- Florida (29): 2.3% Obama lead
- Colorado (9): 2.4% Obama lead
- New Hampshire (4): 2.8% Obama lead
- Maine 2nd (1): 2.8% Obama lead
- Virginia (13): 3.6% Obama lead
- Michigan (16): 4.5% Obama lead
Now, if Romney does win Michigan, he can then afford to lose Virginia and Maine’s 2nd. So the “easiest” path to victory for Romney is now to keep Nebraska’s 2nd and North Carolina, then pull out wins in Iowa, Florida, Colorado, New Hampshire and Michigan.
But Romney is behind by 4.5% in Michigan right now. That looks like an incredibly unlikely outline unless all the polls are not just wrong, but outrageously wrong.
If Romney fails to get Michigan, what’s left of the close states are:
- Pennsylvania (20): 4.8% Obama lead
- Nevada (6): 4.8% Obama lead
Not much there to work with, unless, again, the polls are all just completely wrong.
So one last look at the chart of the margin in the tipping point state (which is now Michigan):

The trend toward Obama is unambiguous. The election is over. Romney won’t “move the polls” now. Romney’s only hope is that the polls were just very very wrong. At this point, for Romney to be ahead, the polls have to be showing a consistent 4.5% bias toward Obama. Not just specific pollsters, but some sort of bias that affected all the pollsters, left right and center.
This seems incredibly unlikely.
We’ll see in a few hours of course. I’ll bet that the pollsters are right though. This is an Obama win. The only question is how late in the evening things go before that is obvious even to the people who don’t want to believe it.
As I type this, the first polls close in less than 15 minutes. Those are only parts of states. The first full polls close in just over an hour, at 0:00 UTC (7 PM Eastern, 4 PM Pacific). That batch of states includes Virginia, the first close state to start reporting results.
If Romney looks like he is winning Virginia, then his odds for winning go up considerably. If Romney is losing Virginia, as the polls would predict, then it will confirm that things are heading as expected toward an Obama victory.
People have asked me a few times for my actual prediction for the race. Technically speaking the way I have organized the models I show here, all it really says is that Obama is ahead, but Romney can still win if he sweeps all the close states.
But I think it should be obvious the result I am predicting. It has been showing up in my model all year long.
My prediction: Obama wins 332 to 206.
I won’t be surprised if some of North Carolina, Florida, Colorado and Iowa go differently than my five poll average. But 332 to 206 is my prediction at the moment. And Florida, Colorado and Iowa are not enough to change the results, so I predict an Obama victory regardless.
Now it is time to just sit back and wait for the returns to come in.
I will be here and posting updates for most of the evening. My wife does need to go to the airport tonight, but we don’t need to leave home until 10 PM Pacific (1 AM Eastern). I am guessing the result will be obvious by then.
Note: Chart and map from the Abulsme.com 2012 Electoral College Prediction page. Both assume Obama vs Romney with no strong third party candidate and show polling as it currently exists. Things will change before election day. On the map red is Romney, blue is Obama, gold states are too close to call. Lines on the chart represent how many more electoral votes a candidate would have than is needed to tie under several different scenarios. Up is good for Obama, Down is good for Romney.


First, lets talk about Virginia.
Virginia actually should have flipped back from “Weak Obama” to “Lean Obama” YESTERDAY. The data was in my spreadsheet. Virginia had clearly dropped below a 5% Obama lead again, to 4.3%. I have no idea how I missed it, but I did, and I did not mention it in yesterday’s update. I screwed up. I have corrected the historical trend graph above to reflect this category change as of yesterday.
The graph below of the Virginia polls is as it was YESTERDAY, not yet including new data from today:

As I mentioned when Virginia changed status on Wednesday, it is just bouncing back and forth. The recent history now looks like this:
- Sep 14 to Sep 20 – Lean Obama (6 days)
- Sep 20 to Sep 22 – Weak Obama (2 days)
- Sep 22 to Sep 23 – Lean Obama (1 day)
- Sep 23 to Sep 28 – Weak Obama (5 days)
- Sep 28 to Oct 3 – Lean Obama (6 days)
- Oct 3 to Oct 4 – Weak Obama (1 day)
- Oct 4 to ??? – Lean Obama
The latest change to move the state back to being a close state happened BEFORE any polls that were taken after the first debate.
Now, I wouldn’t have known this yesterday, but today’s update contains two new Virginia polls, the first ones taken after the debate, and they suddenly show Romney ahead! So the five poll average is dropping rapidly, and is now down to a 2.8% Obama lead. So maybe this time we are done bouncing, and we’ll either stay close but leaning Obama, or end up moving to Leaning Romney. We’ll see. But as of the update that should have happened yesterday but I missed (damn it!) Virginia was still just bouncing back and forth, hovering around the “Obama 5% Lead” mark.
Next up is a state that really does change due to today’s new data:

Ohio had been moving rapidly in Obama’s direction. Every new day of polls seemed to increase Obama’s lead. Obama’s lead had gone over 5% on September 26th and had gotten up to a 7.8% lead in the 5 poll average as of yesterday.
Today I added two new polls, both taken entirely on the 4th, which is of course after the first debate. One shows Obama up by only 1%, the other shows Romney up by 1%. Together they average to a tie. If more polls end up backing up these two new polls, it will show a very substantial movement due to the debate, on the order of a 7% or 8% shift. That would be gigantic.
For now though, with three polls before the debate and two after, Obama’s lead in the five poll average is down to 4.2%. That puts the state back into the “Lean Obama” category, and puts it back into play for Romney.
To summarize the updated state of the race:
|
Romney |
Obama |
| Romney Best Case |
281 |
257 |
| Current Status |
206 |
332 |
| Obama Best Case |
191 |
347 |
The big change of course is that Romney’s best case once again includes winning. If he sweeps all the close states, now once again including Ohio and Virginia, he can win 281 to 257. Now, of the six close states, he is only ahead in North Carolina according to my five poll average, so this is still a tall order.
But the new polls in Ohio indicate there just might have been a big debate effect. Other new polls with post debate data in Virginia, as mentioned above, and in Florida also show noticeable tightening, just nothing that changes a state to a new category yet. Both Virginia (if I’d properly updated it yesterday) and Florida were already categorized as close states. The new polls, so far, have made these states even closer, but have not actually flipped them over to be leaning Romney.
If more new polls over the next few days continue to show big improvements for Romney though, we could see some of the Lean Obama states start flipping over to being Lean Romney states, and we could see a few more Weak Obama states become close Lean Obama states.
So far we just have Ohio making a category change that seems like a clear debate effect. But Ohio is a big state, and there has still been very light post-debate polling. We’ll know better what the real effect of the first debate was after a few more days.
Then we’ll hit the VP debate, and other changes in the news cycle, which will make it hard to determine if any further changes are really due to the debate, or from other things that happen later.
Bottom line though, coming off a very bad month most of September, since September 27th Romney has been bouncing back. Since then his numbers have been fairly consistently improving.
For now I’ll stick by the prediction that the beginning of September was his post-primary high water mark in my models though. I think his levels at that point… namely a 317 to 221 best case if he were to win ALL of the close states (an unlikely outcome) and a 303 to 235 Obama win “current status” if everybody just takes the states they are ahead in… is likely to serve as a ceiling for Romney’s gains. I don’t think he’ll be able to break past that point.
Unless of course Obama has a whole lot more bad performances like his debate this week up his sleeve for the coming weeks. If that happens, then who knows. :-)
Note: Chart and map from the Abulsme.com 2012 Electoral College Prediction page. Both assume Obama vs Romney with no strong third party candidate and show polling as it currently exists. Things will change before election day. On the map red is Romney, blue is Obama, gold states are too close to call. Lines on the chart represent how many more electoral votes a candidate would have than is needed to tie under several different scenarios. Up is good for Obama, Down is good for Romney.
|
|


