This is the website of Abulsme Noibatno Itramne (also known as Sam Minter). Posts here are rare these days. For current stuff, follow me on Mastodon

Categories

Calendar

April 2024
S M T W T F S
 123456
78910111213
14151617181920
21222324252627
282930  

Electoral College: Clinton vs Bush now “best polled” combination for 2016

Some new polling was added today from PPP in North Carolina. It didn’t change the status of any state for any of the top five “best polled” candidates, nor did it change the tipping points for any of those. However, it did move Clinton vs Bush ahead of Clinton vs Paul in the metric I use to measure how good the polling is for the various candidate combinations. This means that Clinton vs Bush is now the default view when you go to election2016.abulsme.com.

Now, this does NOT necessarily mean that Clinton and Bush are the front runners in their respective primary races… although there is a strong argument that they are… it just means that there is currently better state by state polling data for this particular combination than any of the others.

Given this, I thought a quick overview of the Clinton vs Bush combination was in order.

Screen Shot 2015-02-05 at 02.58.16706

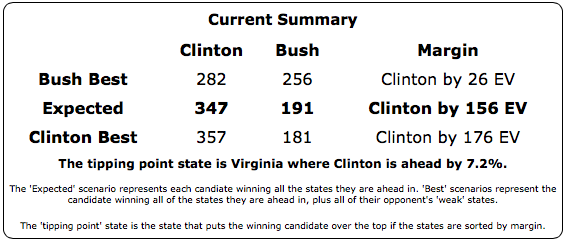
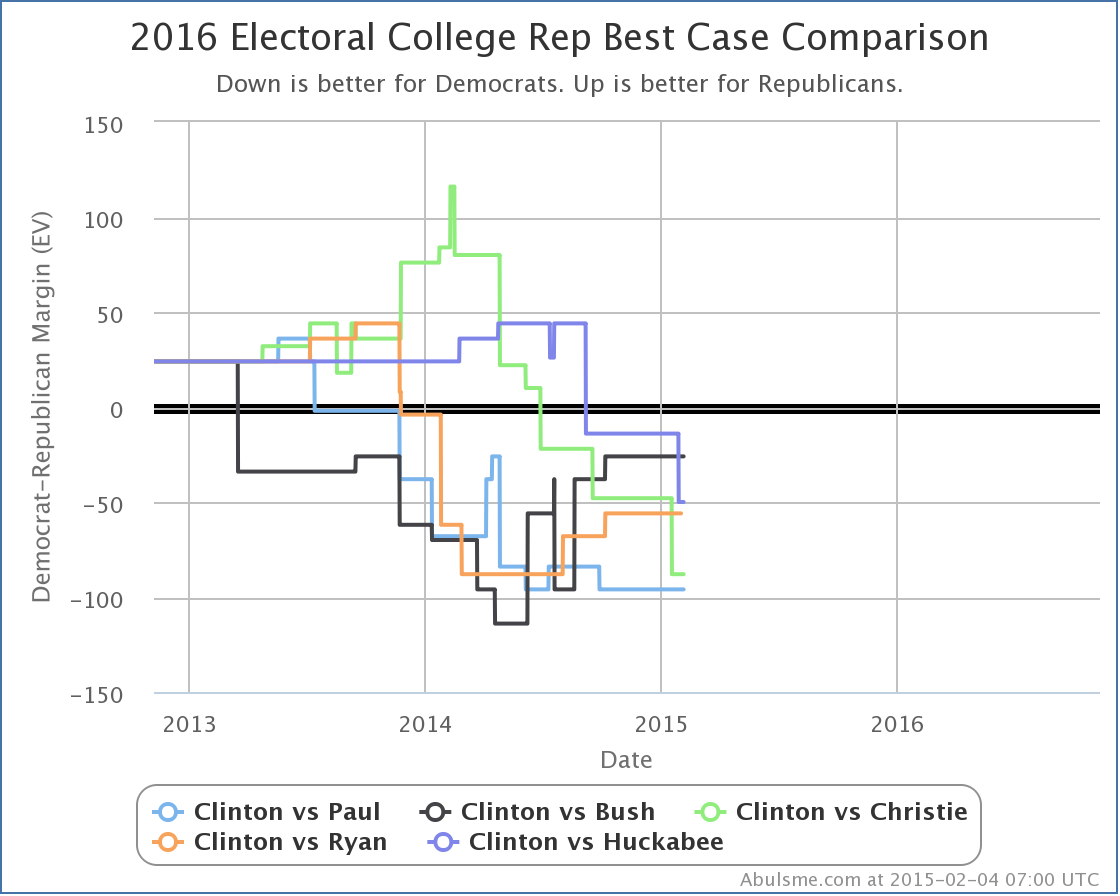
So, as with all the other “top five” Republicans against Clinton, Bush is behind, even in the “Best Case” where you give him all of Clinton’s weak states.

chart-5

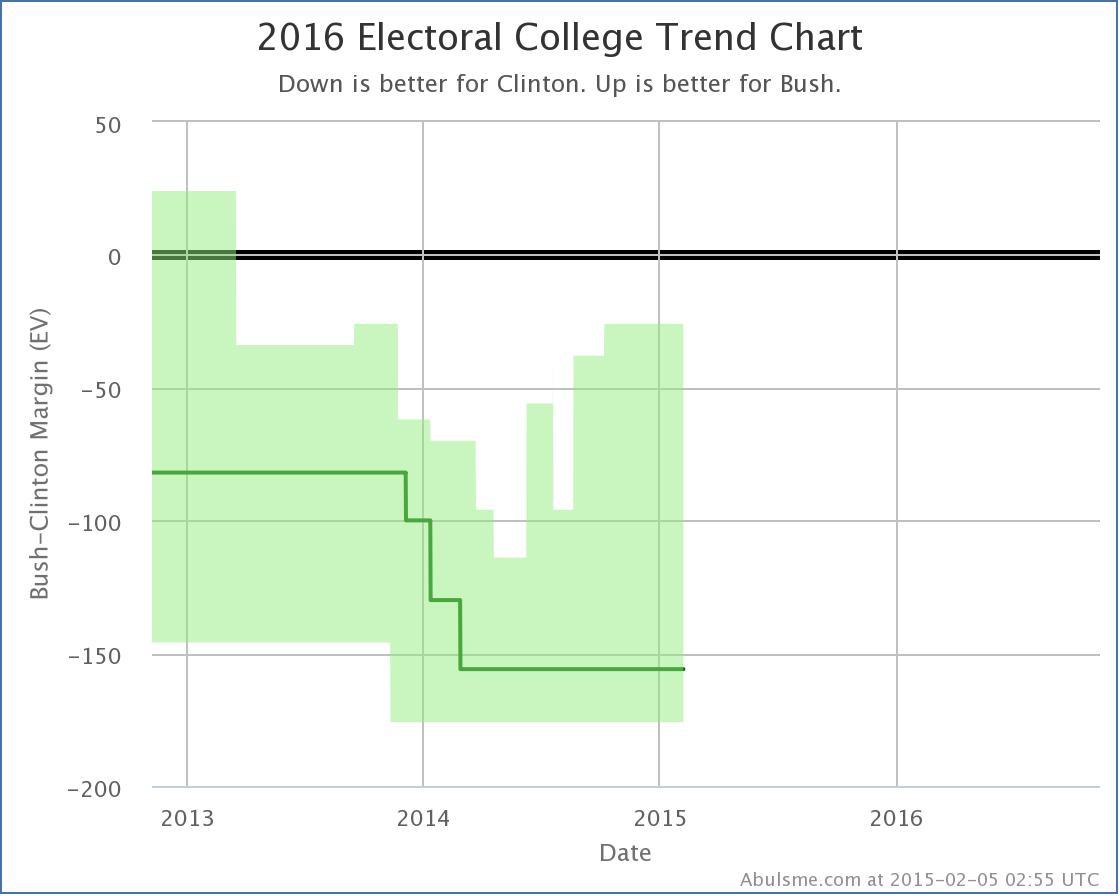
But, unlike some of the others, Bush’s “best case” has been steadily improving since last spring.

And while it hasn’t happened yet, there are two states right on the verge of flipping and improving his expected case as well…

chart-6

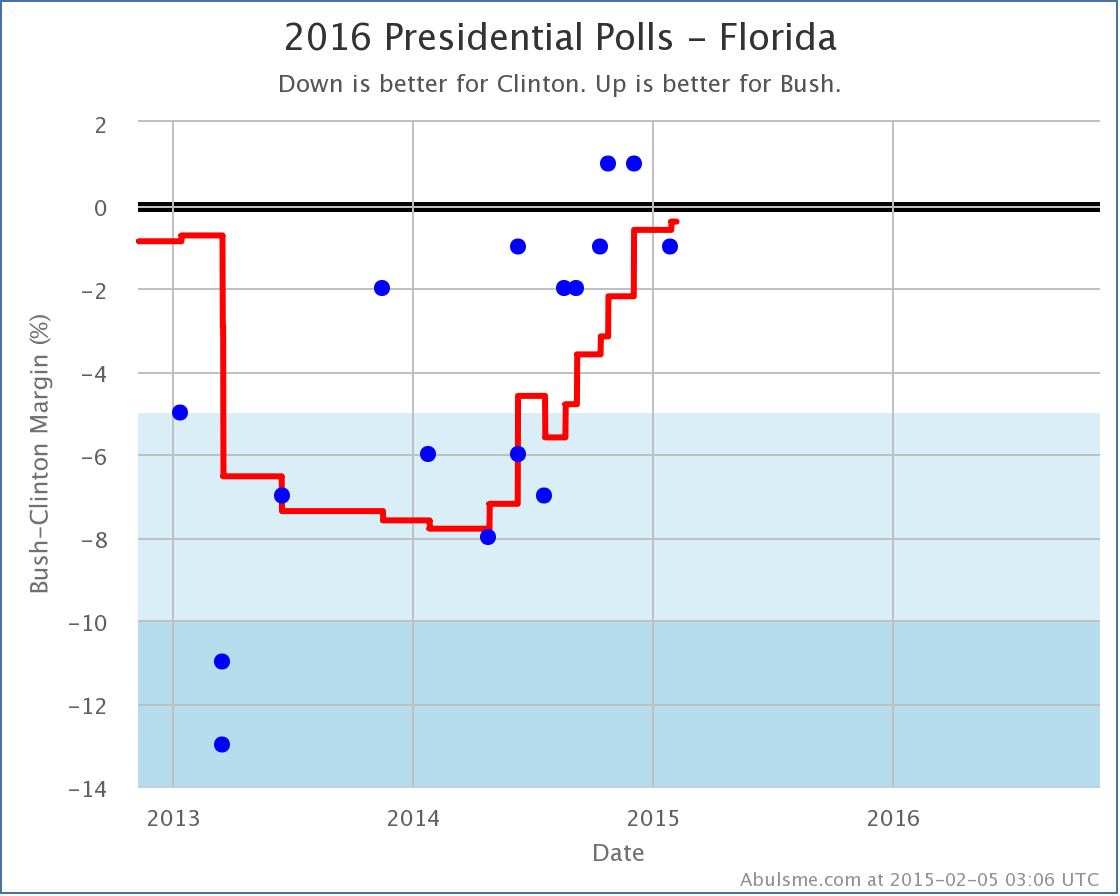
Florida, with 29 electoral votes, considered by many a “must win” for any Republican path to victory, has been trending strongly away from Clinton and toward Bush since bottoming out in the first part of 2014. Currently Clinton’s lead is 0.4% in my average. One more good poll for Bush, and Florida will move into his column.

chart-7

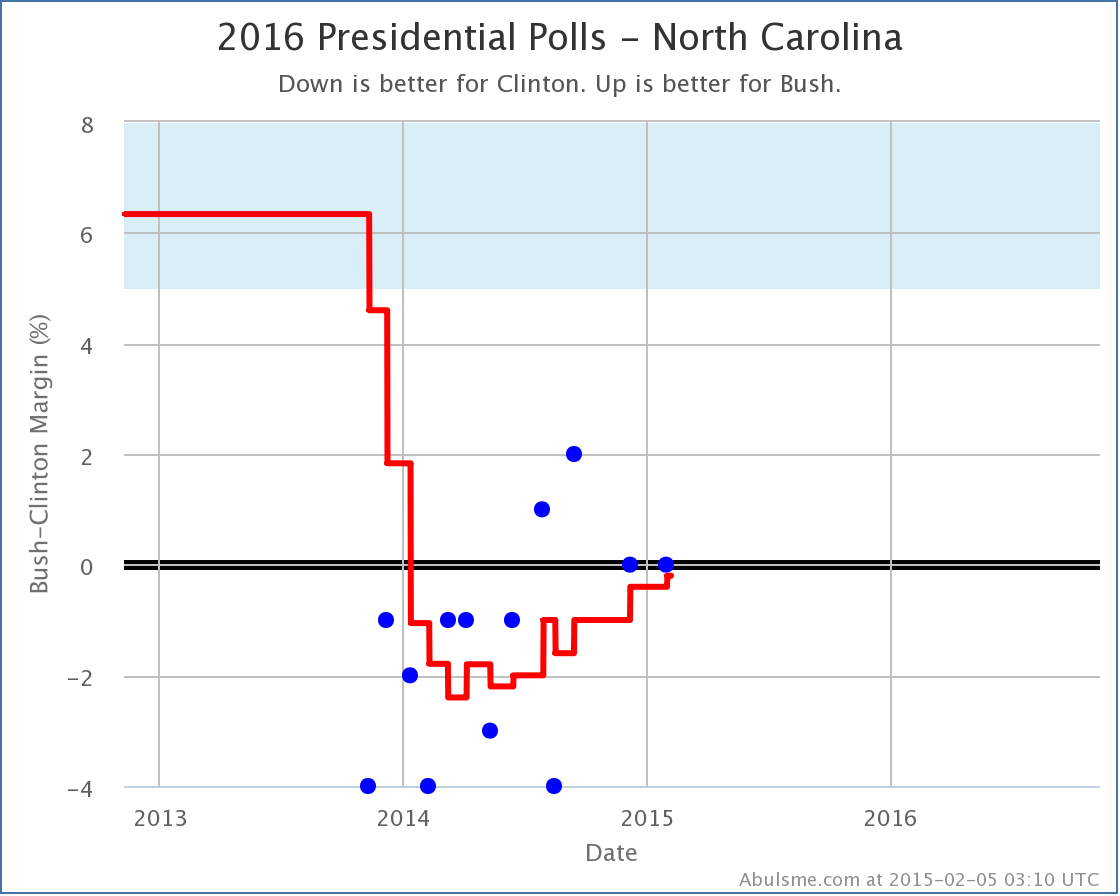
Ditto with North Carolina with 15 electoral votes, where Clinton’s lead is a minuscule 0.2%. Both these states are really neck and neck, but the trend has been in Bush’s direction in both.

Do not be surprised if these flip and Bush’s “expected case” starts moving in his direction soon.

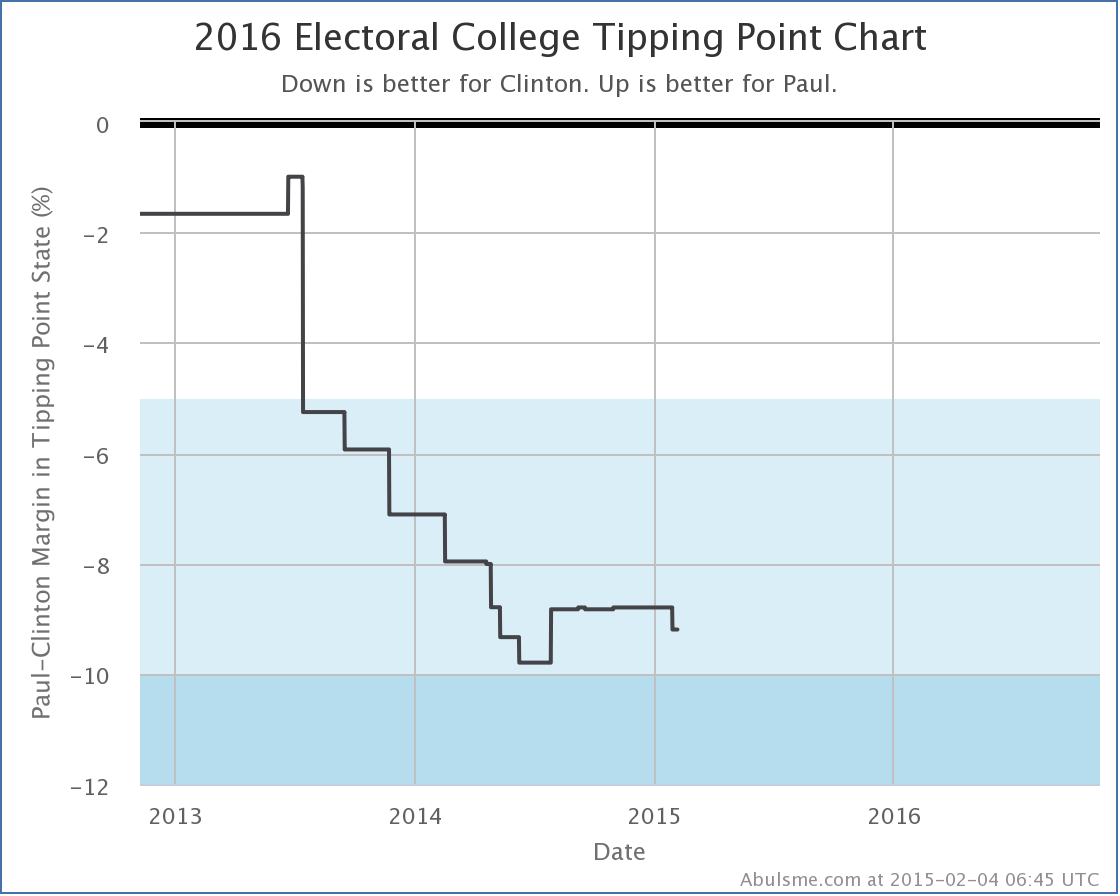
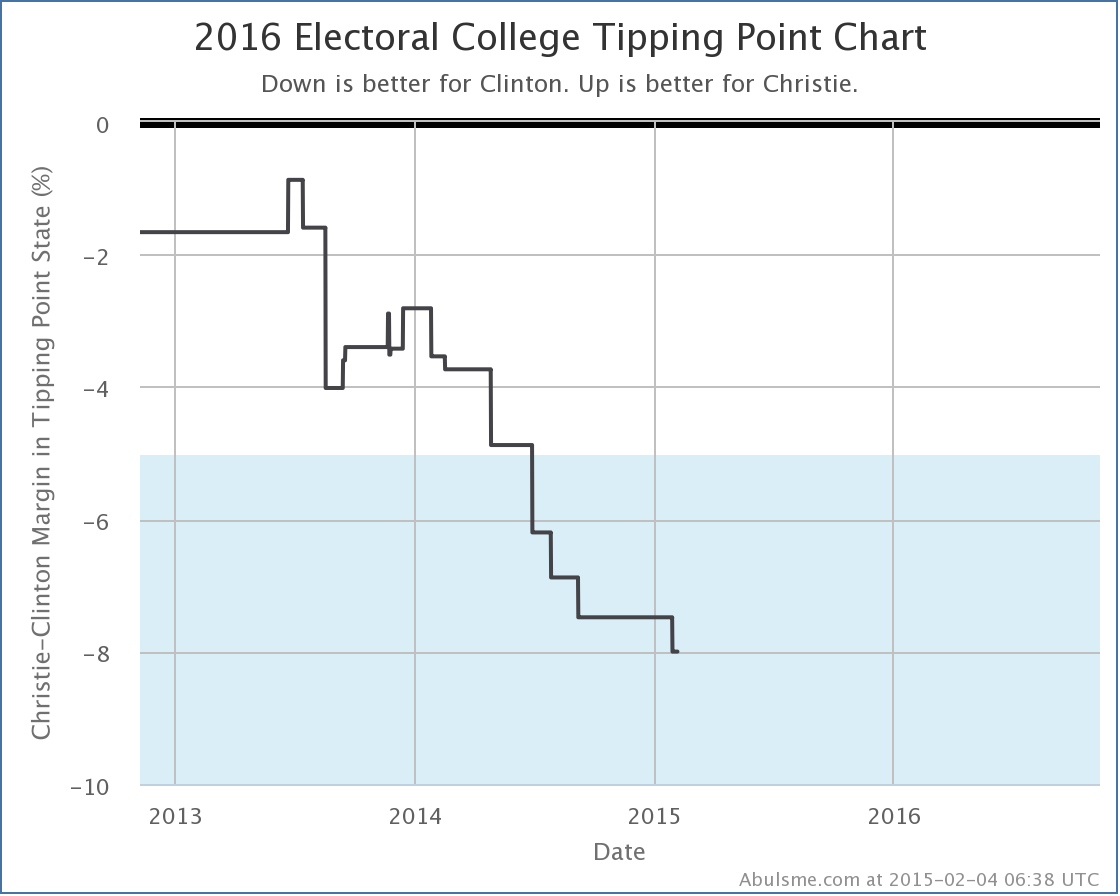
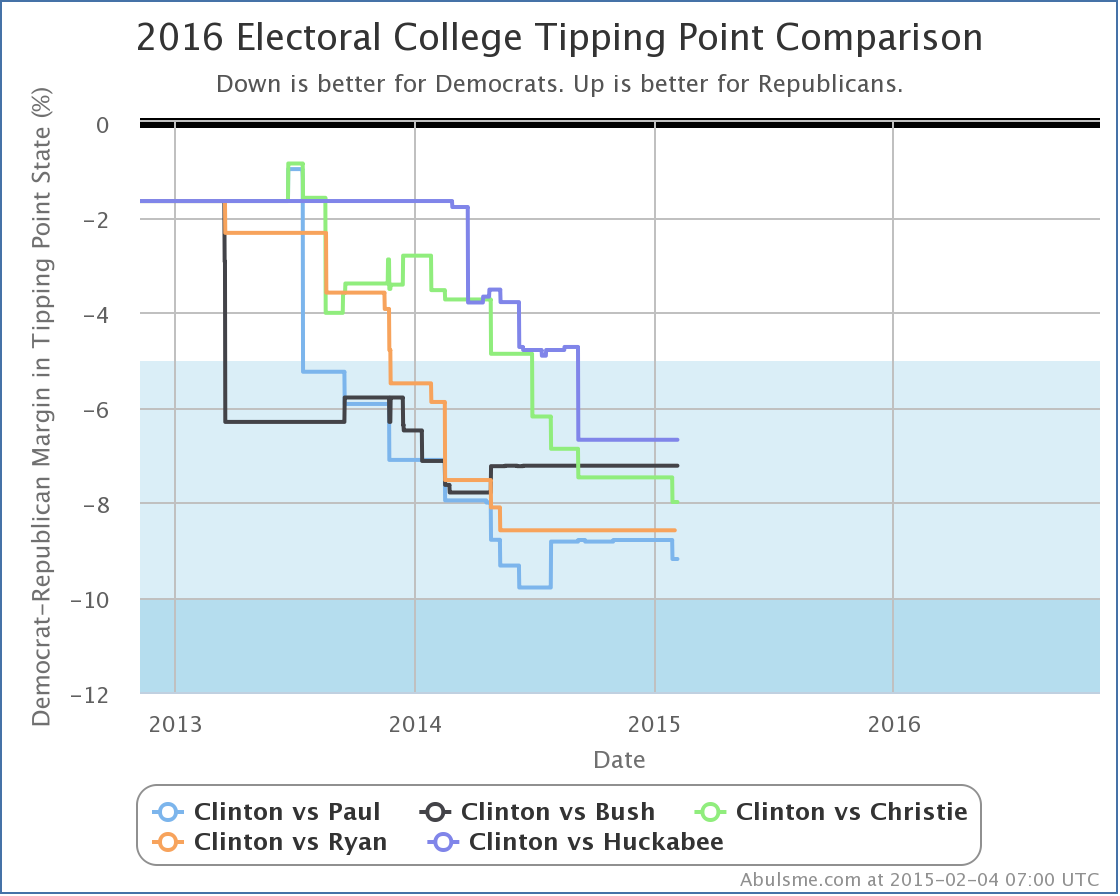
Of course, to actually win, a lot of states need to move. The “tipping point” measures this.

chart-8

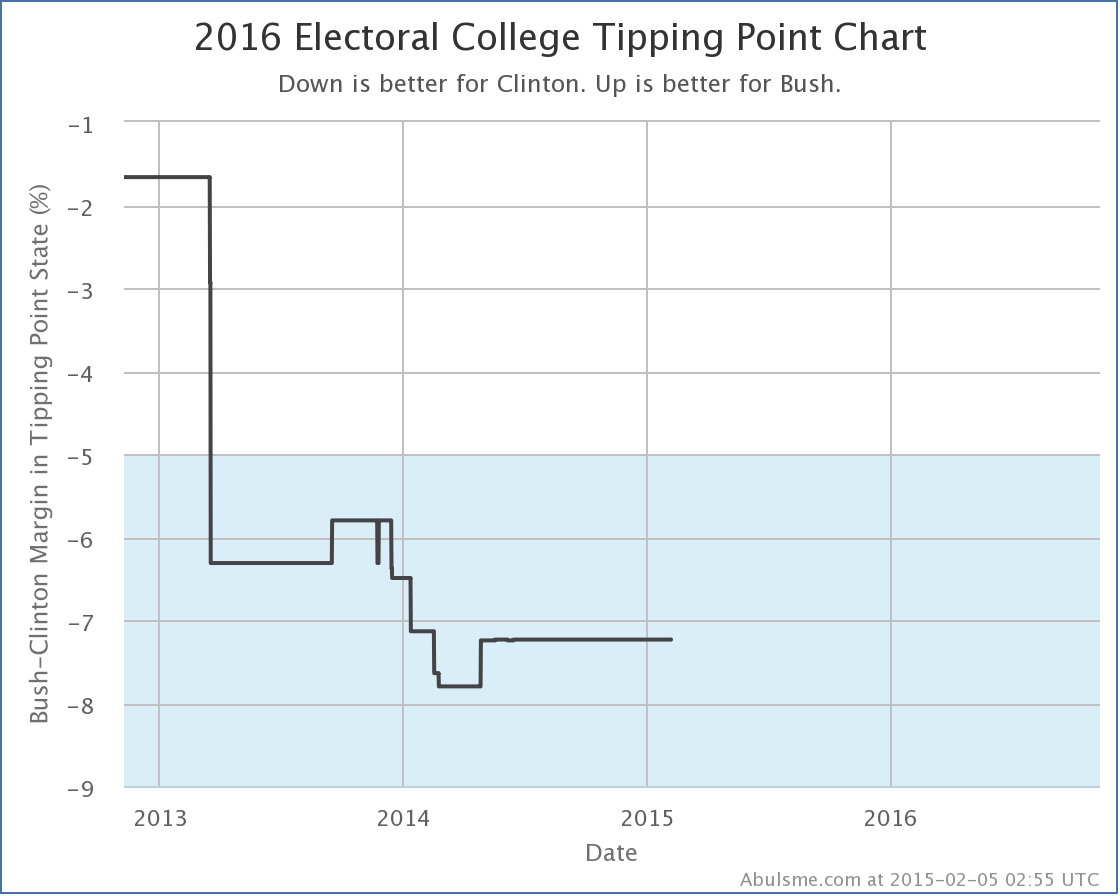
No significant movement here recently. Does this move Bush isn’t moving all the states he needs to? Maybe. But more likely, there just hasn’t been much new polling in the states near Bush’s current tipping point.

To start seeing movement in the tipping point for Clinton vs Bush, we need some new polls in states like New Hampshire (last poll in November), Wisconsin (last poll in April), Virginia (last poll in March), Minnesota (last poll in June) or Colorado (last poll in July).

The age of the polls in these states shows just how far away we still are from having a large enough volume of state level polling to have a good “real time responsive” sort of take on the situation. At this stage, polling is still slow and sparse in most states, and you have to interpret things accordingly.

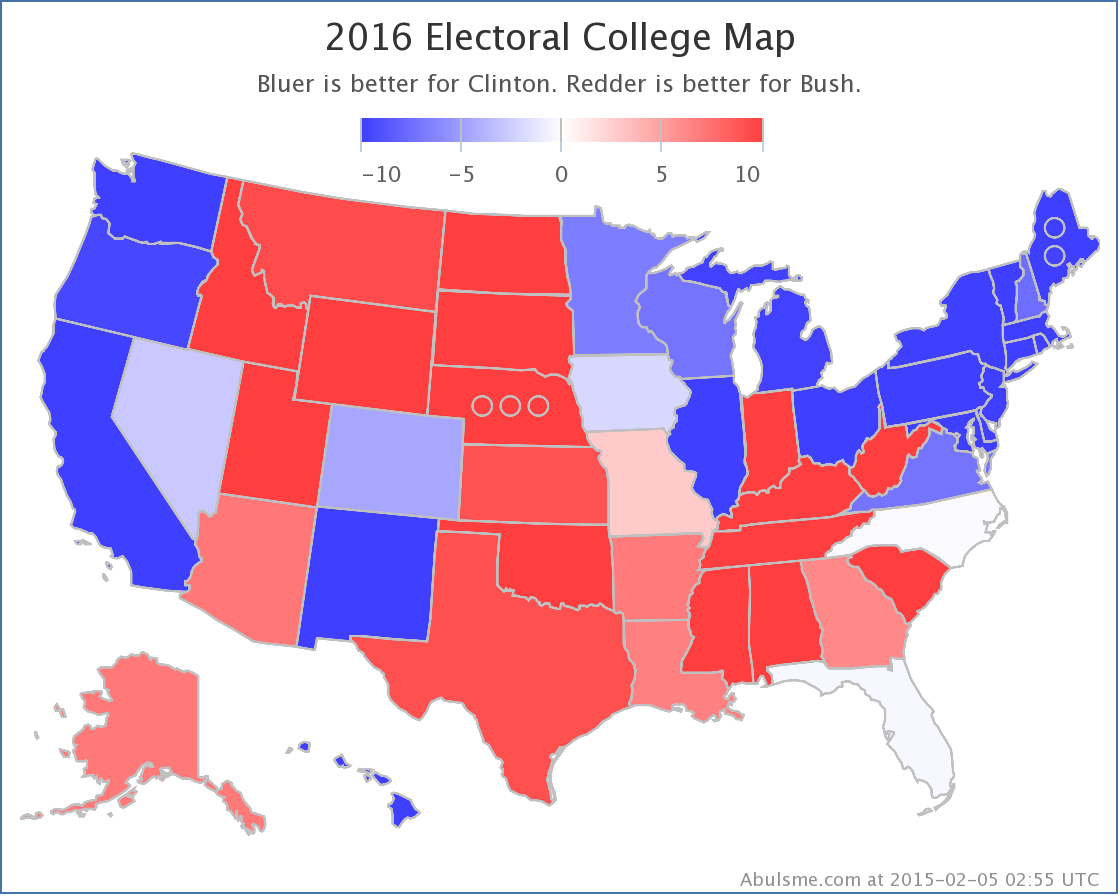
Now, you can’t give a summary without the traditional map. So here is the current Clinton vs Bush map…

chart-9

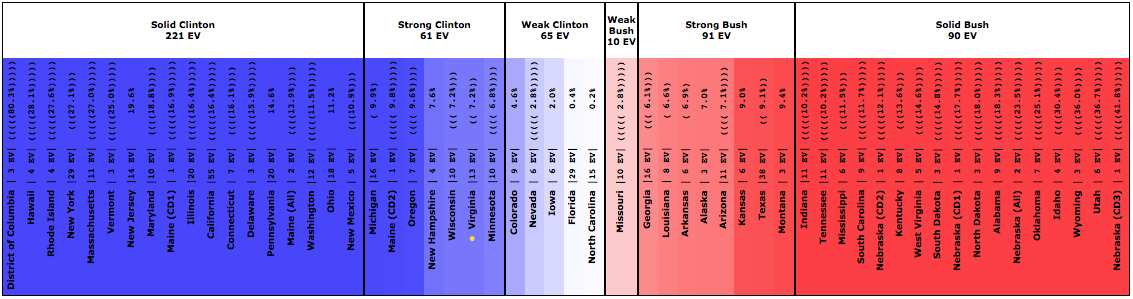
And finally, here is how that looks as a spectrum of the states broken down into the various classifications:

Screen Shot 2015-02-05 at 03.32.45313

So there is our new “best polled” candidate combination… for the moment…

Electoral College: Paul, Christie, Huckabee all weaken vs Clinton

Today’s poll update was the addition of the Quinnipiac Swing State Poll, which included Florida, Ohio and Pennsylvania. Within the five “best polled” candidate combinations, this caused three changes worthy of note here. All three were moves toward Clinton and away from the Republicans.

First up, since it is the only one that actually involves changing the electoral summary for a candidate pair… Clinton vs Huckabee.

chart

This is only the second time Clinton vs Huckabee in Ohio has been polled, but both new polls pull the state more toward the Democrat than the average of the last five presidential elections (which gave a 1.7% Dem advantage). This latest Ohio poll pulls the five poll average to a 5.7% lead for Clinton, which takes the state out of the “Weak” category which I allow to swing back and forth between the candidates to produce the “Best Case” scenarios for each candidate.

With the loss of Ohio from the list of “Possibles”, Huckabee’s “best case” moves from Clinton by 14 EV, to Clinton by 50 EV.

Screen Shot 2015-02-04 at 7.41.53

Of the five “best polled” candidate combinations, Clinton vs Huckabee is still #5 with much less comprehensive polling than Paul, Bush and Christie, so this may still be overstating where Huckabee would really be if more states were more fully polled.

The next two changes don’t actually change the Expected or Best cases for candidates, but rather are just changes to the “Tipping Point”. The tipping point essentially describes how much polls would have to move nationally (assuming an even distribution of movement in all states) to change who has the lead in the electoral college… in other words, how far ahead or behind the candidate is overall.

So next up is Clinton vs Paul:

chart (1)

With the new poll, Paul moves from being behind 8.8% in Ohio, to being behind 9.2% in Ohio. Both of these are in the “Strong Clinton” category, so there is no category change here, but Ohio was the tipping point state in this contest, and so any movement in this state will generally mean movement in the tipping point.

chart (2)

As you can see, the Clinton vs Paul tipping point has been between an 8% and 10% Clinton lead for most of the last year, so this isn’t breaking any new ground. The trend before last summer on this chart was basically just the process of getting enough polls to have a good view of this candidate pair, so things have essentially just been pretty flat since then. The new change doesn’t really change that, although I’m sure Paul would still rather see this line go in the other direction. (Well, if Paul was looking at my charts, which he isn’t. :-) )

Finally, Clinton vs Christie. This time, the changes in two states were relevant:

chart (3)

Last week I talked about Christie fading in Pennsylvania. The new polls today reinforce that trend, further worsening Christie’s position in Pennsylvania. It dropped him from being behind by 6.0% to being behind 8.0%, which pushed Pennsylvania past the previous tipping point of 7.5% in Minnesota.

chart (4)

Now, Ohio also moved away from Christie with today’s polls (from Clinton by 7.6% to Clinton by 8.5%). If it hadn’t, Pennsylvania would have pushed past Ohio too, which would have had a different result for the Tipping Point.

In the end, the tipping point for Clinton vs Christie moved from Clinton by 7.5% in Minnesota, to Clinton by 8.0% in Pennsylvania.

chart (5)

Unlike Clinton vs Paul, with Clinton vs Christie we’ve basically just been seeing a continued trend away from Christie and toward Clinton. Christie has not been faring well lately on this front.

Before closing up, lets look at a couple of the comparison charts between the five best polled candidate pairs.

chart (6)

With Huckabee’s decline in best case, the Republican with the best best case against Clinton is now Bush, but that Best case is still losing by 26 electoral votes. (And the expected case if Bush did NOT manage to flip all the Weak Clinton states is Bush losing by 156 electoral votes.)

The worst best case versus Clinton is still Paul, losing by 96 electoral votes even if you give him all the Weak Clinton states. (Paul’s expected case is a bit better than Bush though, only losing by 138 electoral votes.)

chart (7)

It looks a little different in terms of tipping point, with Huckabee doing best this time (behind by 6.7% in Wisconsin). Paul still in the rear here, behind by 9.2%.

Now, as people keep pointing out, and I will too, polls this far out from the election are NOT PREDICTIVE. All of the charts I’ve shown above say NOTHING about what the actual results in November 2016 will be. NOTHING.

However, that does NOT mean they are meaningless, or that they should be ignored. (Or why am I bothering with all this?) No, polls right now still give you a sense as to where things stand TODAY, which while it won’t tell you who will win 643 days from now, it DOES tell you how much work the candidates who are currently behind have to do in order to flip things. (Alternately, how much wiggle room the candidate in the lead has available as buffer against mistakes they might make.)

So, yes, pay attention to the polls. Even now. Just don’t make the mistake of believing that just because Clinton is way ahead of everybody now that necessarily means that will still be the case in a year and a half, when the polls DO start having some predictive power.

PS: There was also a tipping point change today for Clinton vs Romney but even with today’s new polls, Clinton vs Romney is still only the 20th best polled candidate combination, and with Romney declaring he isn’t going to run after all, he’s no longer as likely to climb the ranks as I thought a few weeks ago. If I had to guess as to the next change in the “Top Five” it would be Clinton vs Rubio (currently #7, but Rubio actively talking about being a candidate) replacing Clinton vs Ryan (currently #4, but Ryan having said he won’t run).

Edit 10:11 UTC – Added “Electoral College” prefix to title for consistency.