Well, Super Tuesday is over except for a few straggling delegates that were not yet determined when it was time to start writing this post. So how did things end up? A lot of places will concentrate on “states won” and say that Clinton won 7 states and Sanders won 4. That’s well and good, but we’re going to look at what actually matters… the delegate totals.
First as a reminder, on Sunday I used current polling to predict where we would end up on delegates. Subtracting out “Delegates Abroad” which as it turns out won’t report results for a few more days, the polling suggested we would get results something like:
Estimate: 526 Clinton, 339 Sanders
And where are we actually? I’ll refrain from going through this state by state and just jump to the totals.
Actual: 504 Clinton, 335 Sanders, 26 TBD
The 26 TBD delegates are from Texas (19 delegates) and Tennessee (7 delegates). They could still split in such a way that the estimate ends up exactly correct. But even if it doesn’t, it will have been pretty close.
Bottom line is that the results are very closely in line with what would have been expected given the polling. No surprises here.
Where does that put our all important “% of remaining delegates needed to win” chart?
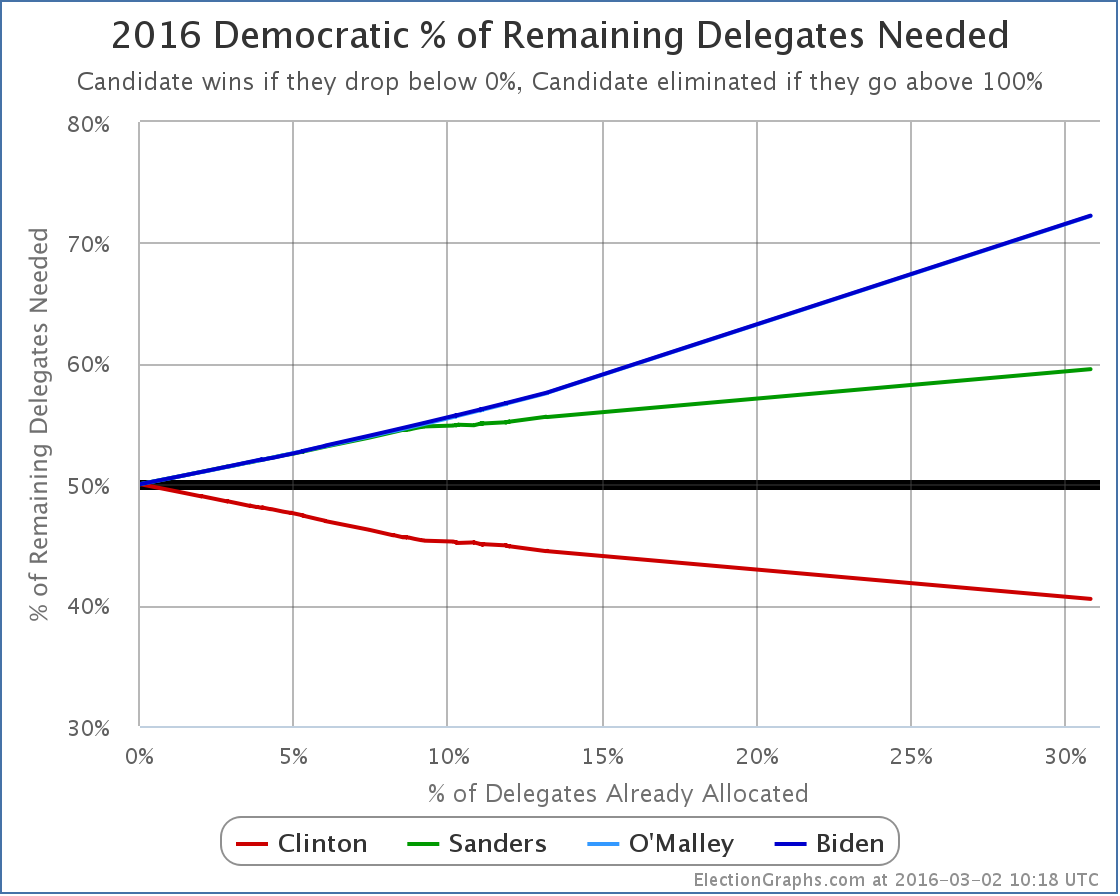
Clinton now only needs 40.52% of the remaining delegates to win the nomination. Sanders needs 59.54% of the remaining delegates to win.
Or of course large numbers of Clinton superdelegates have to start defecting to Sanders, which would raise Clinton’s number, and lower Sanders’ number. But there continues to be no sign of any such movement. And with Sanders continuing to lose the race for non-super delegates as well, it seems unlikely that a a big rush of “back the winner” movement will be heading Sanders’ way any time soon.
In the title of this post, I ask “what next?”. But even if Sanders had some “momentum” coming out of Super Tuesday (he really doesn’t) getting to 60% of the delegates in the coming contests would be a very tall order. His performance so far has been nowhere near that level. The Sanders folks may not be quite ready to admit it yet, but absent a Clinton implosion of historic proportions, the Sanders race for the nomination is over. If Sanders continues to fight on through the remaining contests, it isn’t to win, it is back to “making a point”, and “giving exposure to his issues”, and “moving the party towards him”, which was probably his original goal before he started doing a lot better than people originally expected. Those are legitimate reasons to continue a campaign. But it is not about winning the nomination.
What next? Clinton slowly but surely pushes her lead until she has 2,382 delegates and wins the nomination.
Before closing up, just a quick comparison:
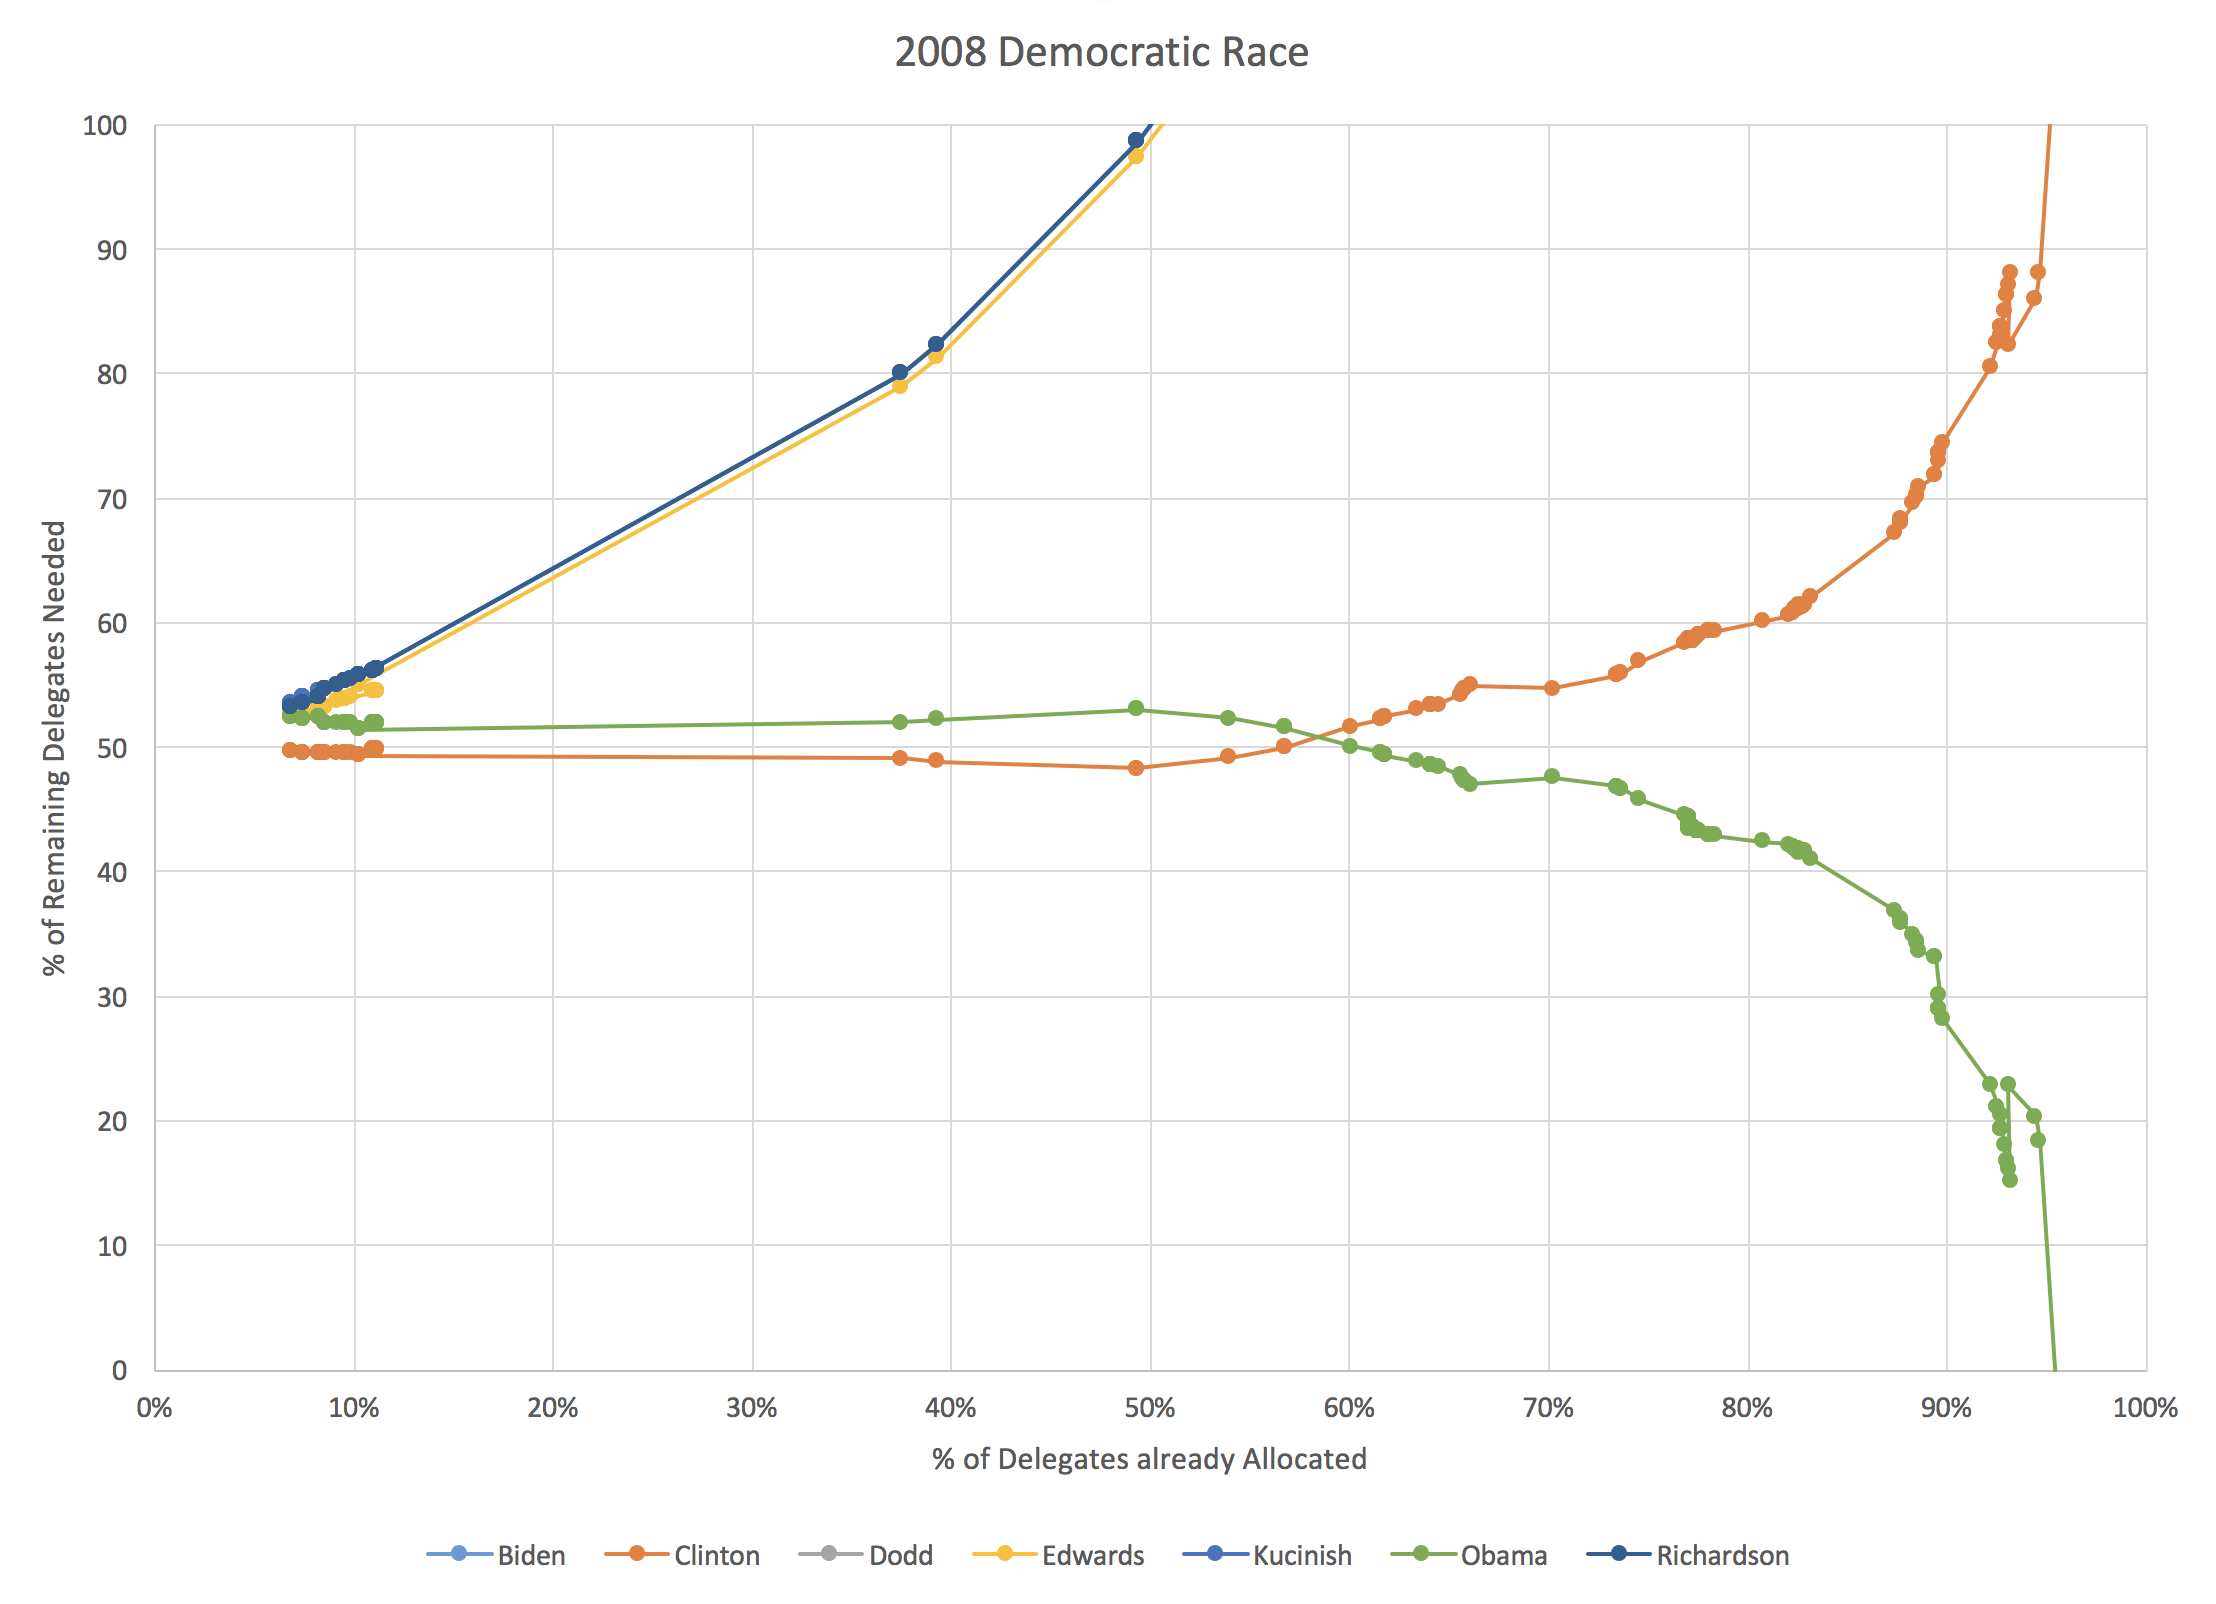
Although I didn’t produce the chart in exactly the same form when I did the analysis in 2008, a few minutes in Excel with the old data produced the equivalent chart for 2008. It is interesting to compare where we are.
First of all, at just over 30% of the delegates allocated, Clinton was still ahead in 2008! But it was much closer than things are today. She needed about 49% of the remaining delegates to win, compared to only needing about 41% today. Obama needed about 52% of the remaining delegates to catch up and win. Which he obviously did. At that point he already had about 47% of the delegates that were already allocated though… while Sanders only has about 29% of the delegates. (Both 2008 and 2016 numbers of course include superdelegates.) So while Obama was able to mount a come from behind win from this point in the delegate race, Sanders is far far behind where Obama was.
Sanders is now approximately where Clinton was when about 80% of the delegates had been determined. In 2008, that was in late April. The media was still talking about the Clinton/Obama race at that point, and hyping up increasingly outlandish scenarios where Clinton could still win, because a race is more interesting than having a clear winner, but anybody watching the numbers knew it was over at that point absent a catastrophic event.
In any case, back here in 2016, I will of course continue to watch the races and post updates after each contest. If a major event happens that changes everything and puts Sanders back on track to win you will see it here. Absent that though, we’re just going to be watching Clinton’s slow march toward mathematically clinching the nomination.
[Update 2016-03-03 02:17 UTC – Update on super Tuesday delegates. The 7 TBD delegates in Tennessee broke 6 for Clinton, 1 for Sanders. The 19 TBD delegates in Texas broke 12 for Sanders, 7 for Clinton. In addition in Minnesota the estimates were adjusted to give one less delegate to Sanders, and one more to Clinton. Net for this round of updates: Clinton +14, Sanders +12, bringing totals to Clinton 1060, Sanders 431, O’Malley 1. This does not substantively change the analysis above.]
[Update 2016-03-04 02:51 UTC – Superdelegate update: Net Clinton +2]
[Update 2016-03-05 16:41 UTC – Superdelegate update: Net Clinton +6]
[Update 2016-03-06 07:30 UTC – Final superdelegate update prior to results from March 6th states: Net Sanders +1]
Note: This post is an update based on the data on ElectionGraphs.com. Election Graphs tracks both a poll based estimate of the Electoral College and a numbers based look at the Delegate Races. All of the charts and graphs seen in this post are from that site. Additional graphs, charts and raw data can be found there. All charts above are clickable to go to the current version of the detail page the chart is from, which may contain more up to date information than the snapshots on this page, which were current as of the time of this post. Follow @ElectionGraphs on Twitter or like Election Graphs on Facebook to see announcements of updates or to join the conversation. For those interested in individual general election poll updates, follow @ElecCollPolls on Twitter for all the polls as they are added.
[Edit 16:44 UTC to actually answer the “What’s next?” from the title.]