In the latest Curmudgeon’s Corner Sam and Ivan talk about:
Recorded on 29 Jul 2012 Length this week – 1:23:52 |
 |
|||||
|
||||||
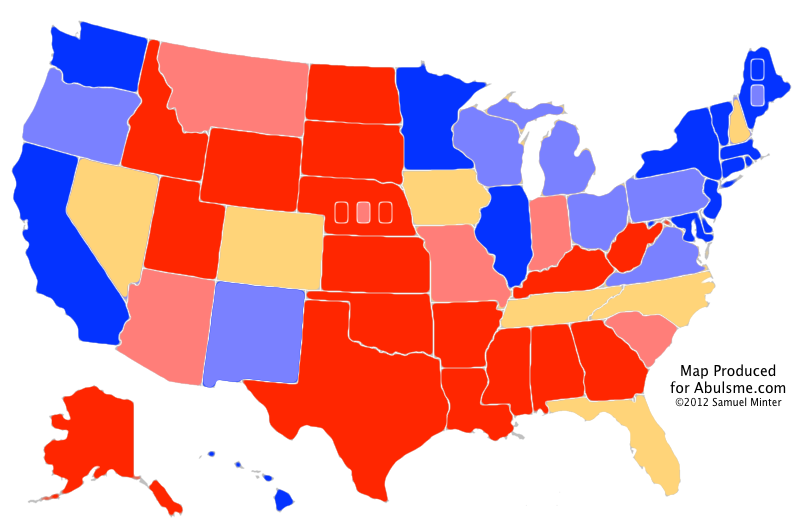
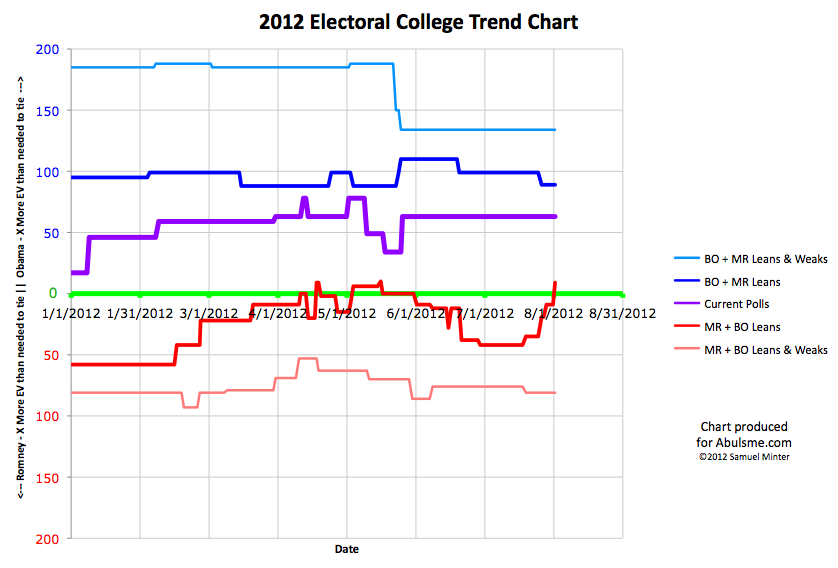
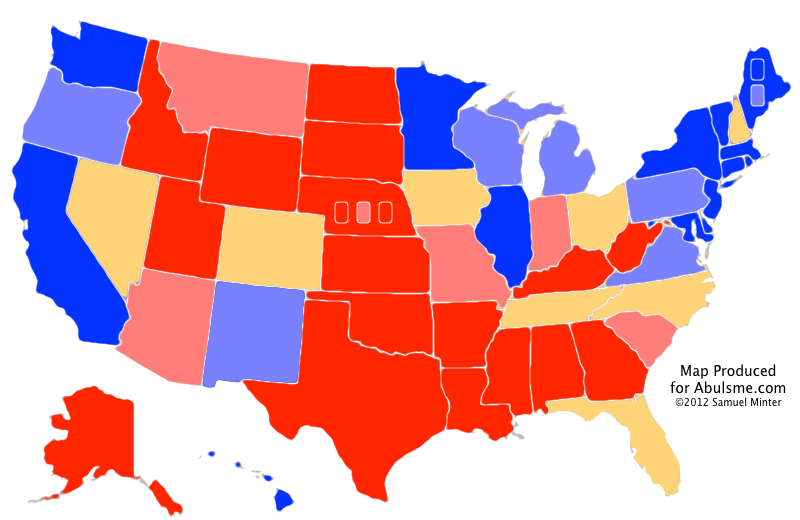
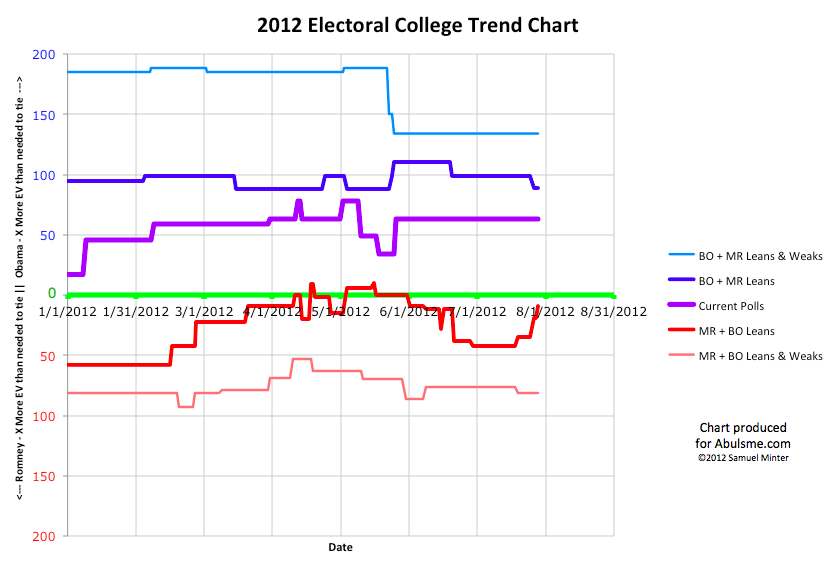
Chart and map from the Abulsme.com 2012 Electoral College Prediction page. Both assume Obama vs Romney with no strong third party candidate and show polling as it currently exists. Things will change before election day. On the map red is Romney, blue is Obama, gold states are too close to call. Lines on the chart represent how many more electoral votes a candidate would have than is needed to tie under several different scenarios. Up is good for Obama, Down is good for Romney. One state moves today. A big state, an important state.
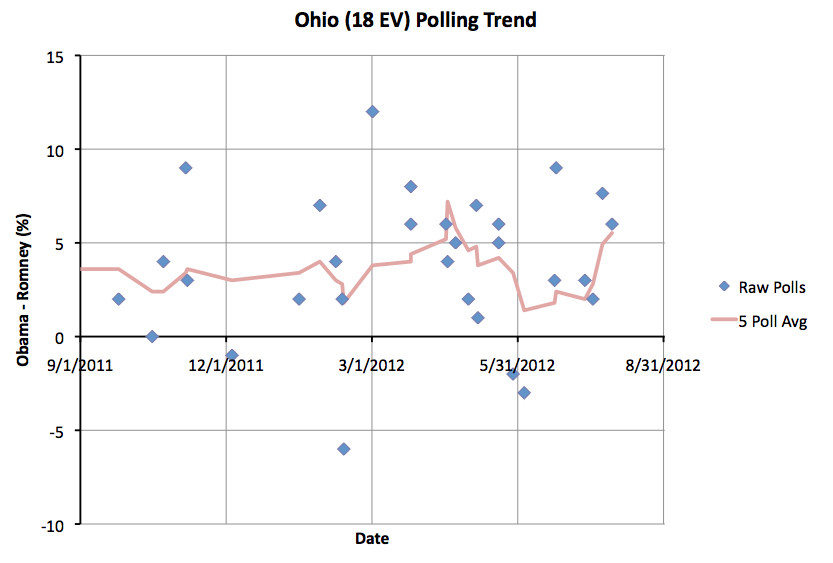
Ohio has 18 electoral votes. In the last year, Romney has never been ahead in the 5 poll average in Ohio, although there have been a smattering of individual polls showing him in the lead (the last one in June). But for most of the last year the polls have shown Ohio with only a narrow Obama lead… a less than 5% lead that put it within reach for Romney. The right things happen, good campaigning, bad news cycle for Obama, whatever, and you could see it pulling over the line to Romney. The last few polls have been quite favorable to Obama though, and Obama’s lead in Ohio now climbs to 5.5%. So I paint the state light blue, and remove it from the list of close states that I include in Romney’s “Best Case”. Ohio may not stay here. The next poll could pull this back in Romney’s direction. But for the moment, Ohio looks like a blue state. So where does this put us?
Yup, that is right. For the third time since I’ve been tracking*, if Romney wins all the states he is clearly ahead in, plus all the close states, including the ones Obama is ahead in… he still loses. Put another way, Obama can afford to lose every single state that is “close” in the polls, and he will still win 278 to 260. In a quick comparison to 2008, McCain didn’t get to this bad a position in the polls until October, Romney has been there three times so far in my model. Now… each time he has subsequently improved his position… he hasn’t stayed in this kind of dire strait for too long. But rather than those being permanent moves to make the race more competitive, both times the gains Romney made have eventually eroded away, and we end up back here with his best case being to lose. Yes, yes. We have three months to go. We have conventions coming up. Most “normal” people won’t start paying attention until the fall. Indeed. All this is true. It is not yet time to call a winner. Not by any means. But… Romney has a lot of work to do if he wants to win this. His current position just doesn’t look good at all. (Or, as we’ve said on the podcast, Obama has to screw up badly, that will also do the trick.) * The second time did not appear on my charts when it happened. My charts back then showed Romney with a slight lead in his best case, but this lead disappeared when I later added a Virginia poll I’d missed originally. Edit 2012 Aug 1 15:40 to add the last parenthetical and the note about the second time Romney’s best case was to lose.
Chart and map from the Abulsme.com 2012 Electoral College Prediction page. Both assume Obama vs Romney with no strong third party candidate and show polling as it currently exists. Things will change before election day. On the map red is Romney, blue is Obama, gold states are too close to call. Lines on the chart represent how many more electoral votes a candidate would have than is needed to tie under several different scenarios. Up is good for Obama, Down is good for Romney. One state moves today:
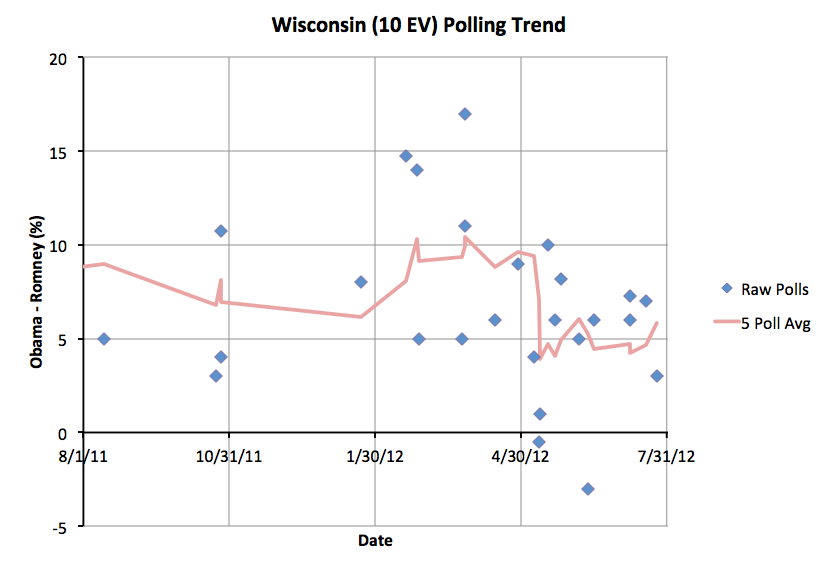
In March Obama had a lead of over 10% in Wisconsin, but by May that was less than 5%, putting Wisconsin on our swing state list. It has bounced around the 5% line since then. Now Obama’s lead in the five poll average once again tops 5%, so Wisconsin moves to “Weak Obama” and takes the possibility of Romney winning it off the table for the moment.
Before the last couple of weeks, Romney had been steadily eroding Obama’s lead in a bunch of blue states. He kept pulling states out of the “Weak Obama” category into “Lean Obama” putting them into contention as swing states, with margins close enough that Obama’s lead could conceivably evaporate overnight if the news cycles were favorable to Romney. Romney’s best case in my model went from losing 259-279 on May 16th* to winning 311-227 from Jun 29th to July 18th. Although none of them had yet gone over the line to his side, that was a move of 52 electoral votes into the zone where they were within reach. The last two weeks has undone much of that… Michigan (16), Virginia (13) and Wisconsin (10) moved out of reach. This was compensated by Nevada (6) swinging again, but in terms of the net total, 33 fewer electoral votes are in the pool for Romney. This is not a good trend for Romney. At his new best case of 278-260, Romney is only 9 electoral votes over the tie line. This means that of the close states, Florida (29), Ohio (18), North Carolina (15) and Tennessee (11) are now must win states. He could afford to lose one of Iowa (6), Nevada (6) and New Hampshire (4) and still win, but he can’t lose two of those. If he wins every other close state, but loses Colorado (9) we would actually have 269-269, throwing things to the House. This is highly unlikely, but would be fun. (It would also likely lead to a Romney win in the House.) Romney has been behind in the “Current” model all year long. The progress he had made in June in the “Romney Best Case” model has been evaporating. It isn’t looking great for Romney right now. We still have over three months to go though. Maybe at some point Romney will start gaining some real traction? * At the time it looked like Romney’s best case was winning 272 to 266, but a later inclusion of a Virginia poll from April retroactively moved Virginia (13) out of swing state status and into “Weak Obama” for that date.
|
||||||||||||||||||||||||||