Another 6+ inches due in the next 48 hours or so.
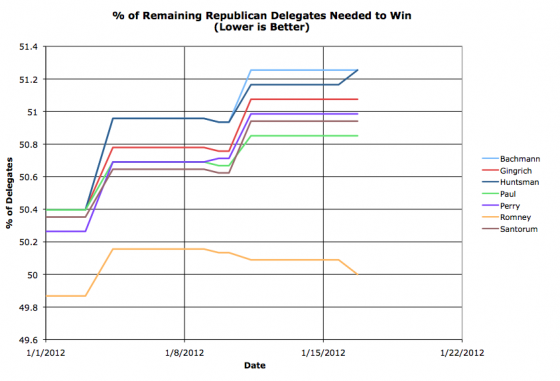
Nominally when a candidate drops out their delegates become free agents, but in practice if a candidate endorses another candidate, the delegates fall in line and vote for the person their candidate endorsed, at least for delegates from the primary and caucus process. My source for these delegates, The Green Papers, uses that presumption for their “soft count” (which is what I am using), so today we have Huntsman’s two delegates jumping over to Romney. This also puts Romney back in the best position he has been in before voting started. He now has more than 50% of the delegates so far, which means he needs less than 50% of the remaining delegates to win. Another way to put that is that he doesn’t even have to match his performance so far to win. For the rest of the race he can do WORSE than he has done so far (including superdelegates!) and he will still win. The other candidates have to IMPROVE their performance in order to catch up and win. The amount they have to improve by isn’t completely out of the realm of contemplation yet, but it is getting higher.
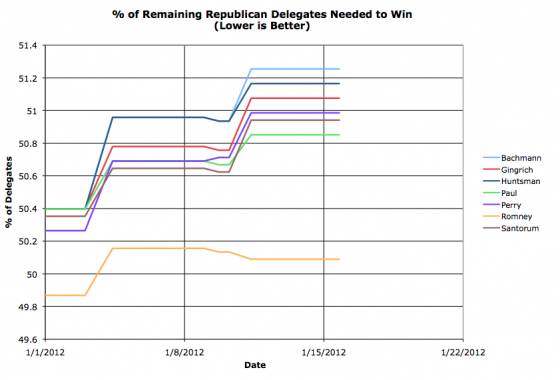
OK, so I don’t like to make retroactive changes to the graphs, and in most cases even if there is an after the fact correction I will make the correction on the day I find out about it, with the graphs representing the best data available at the dates listed. However, I will make an exception here because it is early, and I’m incorporating data I probably should have had from the beginning. Namely, the source I have been using, The Green Papers, gives a tally of the delegates determined by primaries and caucuses (including projected eventual results of long caucus processes like Iowa’s) but at least for the moment is NOT looking at the “Automatic Delegates”, what were commonly known in the 2008 cycle as “SuperDelegates”. These are party officials and the like who come to the convention by nature of their position and are not bound by any rules or commitments or promises or whatever and can vote for whoever they like. On the Republican side this time there are 132 of these sorts of delegates. Democratic Convention Watch is tracking these people closely for when they make a public statement indicating which candidate they support. Based on their information, we started the year with a superdelegate count of Romney 12, Perry 3, Santorum 1. On January 3rd Perry lost 1 . On January 9th, Perry gained 1 back. On January 10th, Romney gained 1. This leaves us at Romney 13, Perry 3, Santorum 1 today. I am now folding this information in on top of the delegates from Iowa and New Hampshire as reported by The Green Papers. Going forward, I will include both sources of information as I update these charts. For the record, I am assuming the changes I just listed happened at 12 UTC, since I didn’t actually check the page on those days. This does leave us with a picture that looks even more favorable toward Mitt Romney, as his lead in these superdelegates is even more substantial than his lead in the rest of the delegates. At this point Romney only has to get 50.1% of remaining delegates, as opposed to his closest competitor at this time (Ron Paul) who needs to get a full 50.9% to win. These are still close to 50%, as we have just started, but in this view Romney is much closer to dropping below 50% than his rivals, and with Superdelegates plus New Hampshire, he is the only candidate heading downward (toward the nomination) rather than upward (away from it). By the way, this makes the total projected delegate count so far based on these two sources:
|
||