This is the website of Abulsme Noibatno Itramne (also known as Sam Minter). Posts here are rare these days. For current stuff, follow me on Mastodon

Categories

Calendar

March 2026
S M T W T F S
1234567
891011121314
15161718192021
22232425262728
293031  

Electoral College: Utah a swing state? Trump bounce must be over…

Since the last update there have been polls in New Jersey, California and Utah. The results in Utah are the ones that made a difference:

chart-160

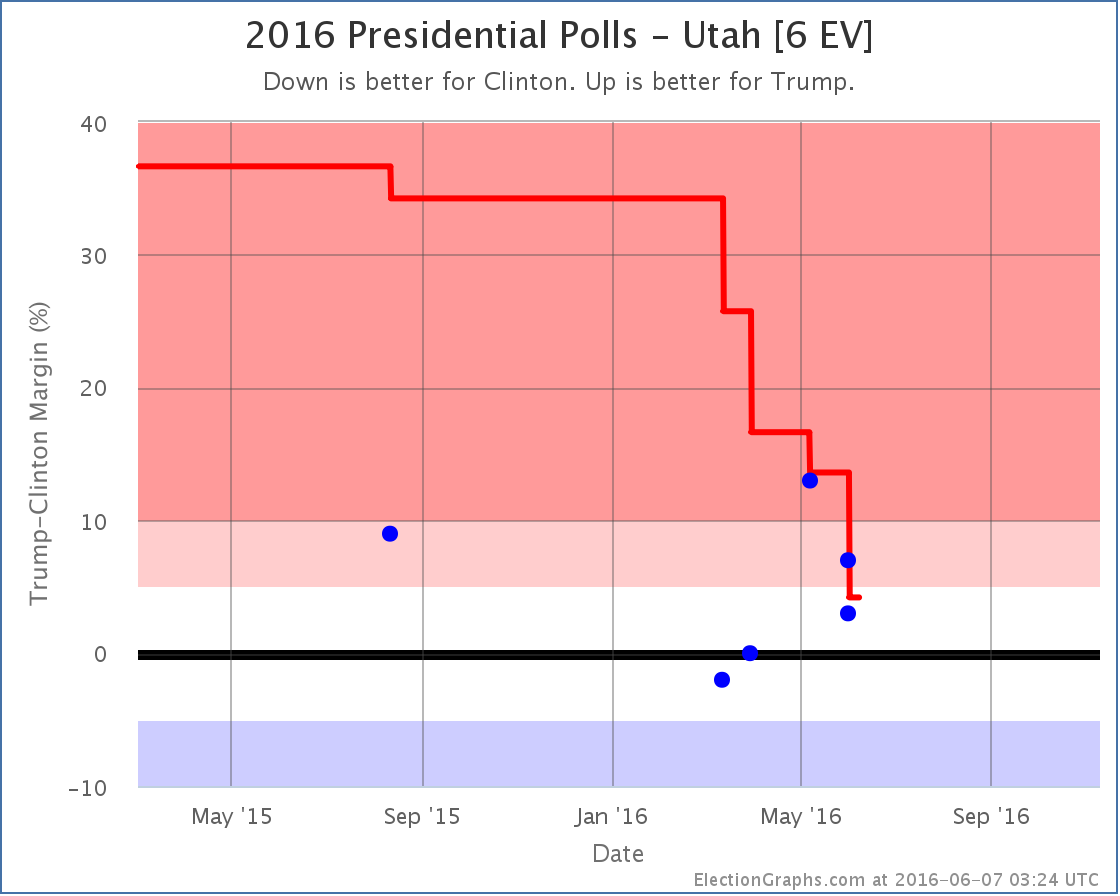
There are actually two new results logged in Utah, both from Gravis, covering the same time period. They asked the general election question twice. Once with just Clinton and Trump showing Trump leading by 7%, then again adding Johnson as a possibility, which reduces Trump’s lead to 3%. Rather than pick one or the other result, I include both.

It could be argued that this gives a single poll double weight in the average, but the way I think of it, this really is two separate results, measuring the election in different ways. So I chose to include both. This is arguable, and other people tracking poll averages may choose a different route. But this is the way I am doing it.*

In any case, these polls are within the range we have seen in all the polls this year. There is quite a bit of variability, but the one thing that is clear is that the Republican lead is much smaller than the 21% to 48% margins the Republicans saw in the 1996 to 2012 general elections. Since my poll averages are “primed” with the results of those five elections, it took awhile for the poll average to move from the huge Republican margin one would expect if Utah followed the pattern of the last few elections down to the 4.2% margin Trump now has. Put simply, this change was so large, a lot of evidence was needed before the average really believed it.

With Trump’s lead in Utah now less than 5%, it now goes into the Election Graphs “Weak Trump” category, which means it is a possible Clinton pick up. So her best case scenario improves:

chart-161

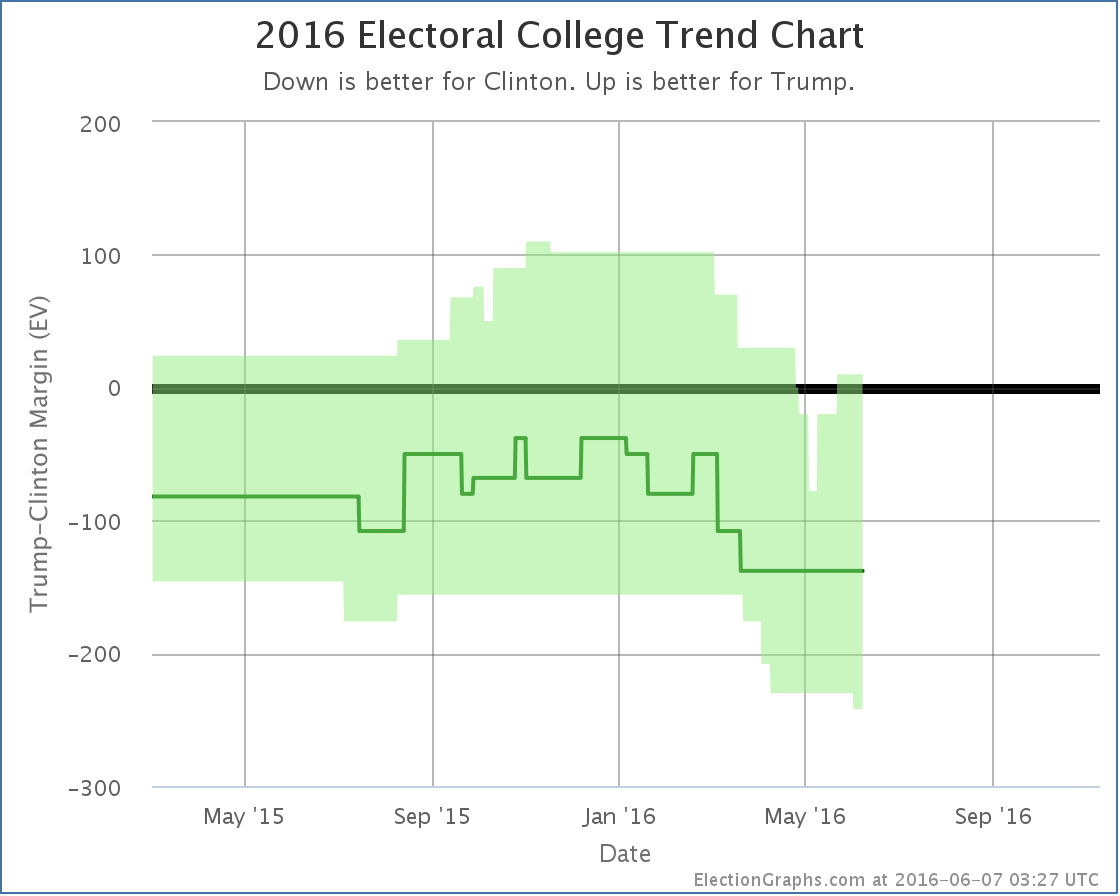
That little nub at the bottom right represents the possibility of Clinton winning Utah.

Leaving out the states where one of the candidates is ahead by more than 10%, the center of the spectrum now looks like this:

Screen Shot 2016-06-07 at 04.41.31756

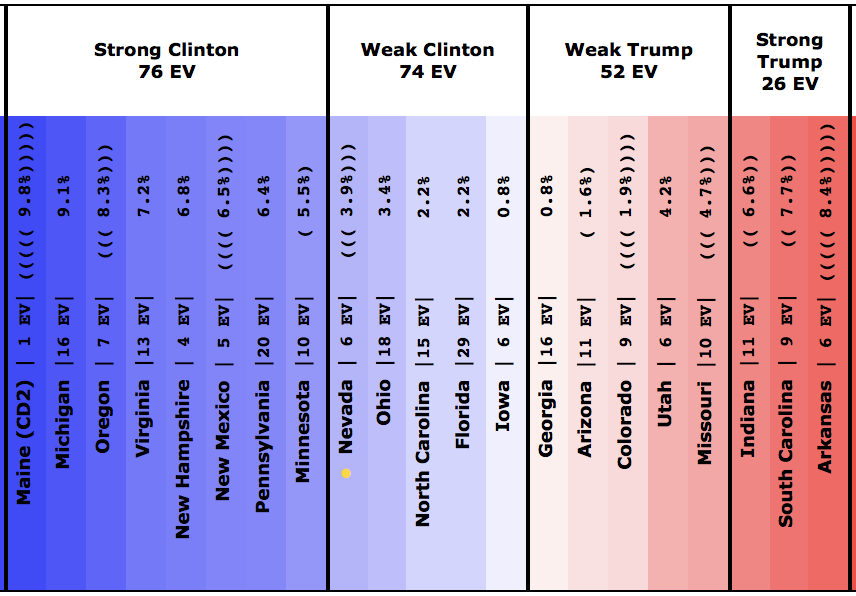
There are a lot of states here that haven’t yet had a full five polls for our average (indicated by the parentheses). But the fact that Georgia, Arizona and Utah may be competitive for Clinton show that Trump may indeed be “redrawing the map”… just not in his favor.

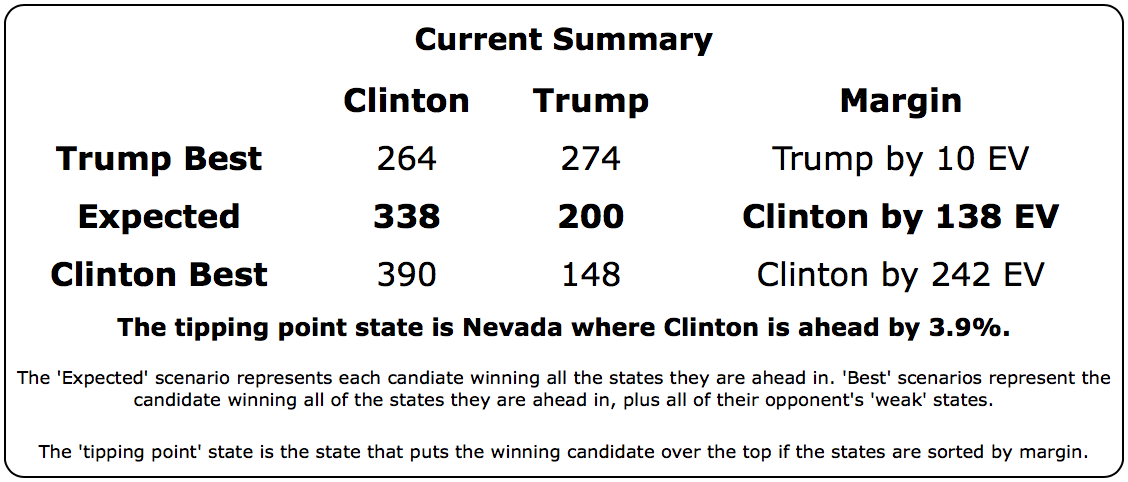
The tipping point is only a 3.9% Clinton lead on the other hand, so it isn’t an insurmountable lead by any means. Trump could still win this if campaign events go his way.

But Utah a possible Democratic stretch goal? Wow. Utah!

For reference, the last time Utah went Democratic was the Lyndon Johnson landslide over Barry Goldwater in 1964. Now, I still wouldn’t bet on Clinton winning Utah. But that it is even close is still stunning.

The overall situation summary now looks like this:

Screen Shot 2016-06-07 at 04.55.10046

So wait, is the Trump bounce over? Well, this is a move in Clinton’s direction, so it breaks the streak of movements in Trump’s direction that had lasted for about a month. So by that measure at least the “bump” may be over.

This is just one change though, it would be premature to say that the trend is now in Clinton’s direction. As usual, we need to wait for more polls…

154.8 days until the general election polls start to close. There will be plenty of movement between now and then. Stay tuned.

* For more notes on how polls including third and forth parties will be treated on Election Graphs, see the archive of @ElecCollPolls tweets from May 29th.

Note: This post is an update based on the data on ElectionGraphs.com. Election Graphs tracks both a poll based estimate of the Electoral College and a numbers based look at the Delegate Races. All of the charts and graphs seen in this post are from that site. Additional graphs, charts and raw data can be found there. Follow @ElectionGraphs on Twitter or like Election Graphs on Facebook to see announcements of updates or to join the conversation. For those interested in individual general election poll updates, follow @ElecCollPolls on Twitter for all the polls as they are added. If you find the information in these posts interesting or useful, please consider visiting the tip jar.

Edit 14:20 UTC – Fixed typo.

@ElectionGraphs tweets from 2016-06-06 (UTC)

@abulsme tweets from 2016-06-06 (UTC)

Democrats: With win in Puerto Rico, Clinton on the edge of clinching

After the Virgin Islands, Clinton only needed 9.26% of the remaining delegates to win. Sanders needed 90.96% of the remaining delegates.

In Puerto Rico, Clinton got 36 delegates, Sanders got 24.

Since the Virgin Islands, 6 more superdelegates were added to Clinton’s count as well.

So total change since the Virgin Islands: Clinton +42, Sanders +24.

That is Clinton 63.64%, Sanders 36.26%.

So Clinton met her target, Sanders did not.

Updated graphs:

chart (115)

New delegate totals: Clinton 2340, Sanders 1572, O’Malley 1.

There are 852 delegates left. Clinton needs 43 of them. Sanders needs 811 of them.

chart (116)

Clinton now needs 5.05% of the remaining delegates to win. Sanders needs 95.19%.

This of course includes superdelegates. Please see any number of previous posts here on Election Graphs as to why it is appropriate to include them, even though they can change their minds until they vote at the convention. If any superdelegates change their minds publicly before then, it will be tracked here.

Right now Clinton only needs 43 more delegates to clinch the nomination. There are still about 139 who have not stated a preference. There have been media reports that Clinton has 40+ superdelegates who have privately committed to her that they are waiting to roll out after the New Jersey results almost certainly push her over 2383 anyway. NBC, AP and some others also have a higher current delegate count than I do for Clinton by about 20 delegates due to information they have collected privately from superdelegates.

Put all of that together, and it is actually very possible, indeed probably very likely, that Clinton ALREADY has more than 2383 delegates that she is sure of. In terms of public confirmation, she is just a few handfuls of delegates away, the number of handfuls depending on whose delegate count you go by.

Superdelegates could give Clinton the nomination at any moment now. But since Clinton would prefer to win after the votes of regular citizens are counted, her campaign is almost certainly asking any currently uncommitted superdelegates leaning toward her to wait. So with as much certainty as you can ever get in these sorts of things, expect Clinton to be declared the presumptive nominee by everybody who does such things shortly after the polls start closing on June 7th.

For this site, the blog post about the June 7th results probably won’t go out until the next morning, but watch @ElectionGraphs on Twitter for hourly updates of the delegate totals, including of course noting when she wins the nomination by our own count.

Update 2016-06-07 00:52 UTC: I almost put “…at the latest.” on the end of the paragraph about the networks calling the result soon after polls start closing on the 7th. But alas, I didn’t. A few minutes ago AP reported that by their count Clinton is over 2383 and is therefore the presumptive nominee. They are including superdelegates who have not yet publicly expressed a preference, but have done so when asked privately. The count here will take a little bit to catch up, since it is dependent on public statements by superdelegates and/or actual election results. But the result will be the same…

Update 2016-06-07 22:31 UTC: My source trying to catch up with superdelegate info resulting from AP’s updated counts. Net Change: Clinton +15, Sanders +1, O’Malley -1. Yes, that one O’Malley superdelegate finally flipped… to Clinton.

Update 2016-06-07 23:55 UTC: Updated the number of superdelegates in a bunch of states as per Green Papers. Most changes were uncommitted slots anyway, but there was a net change of Clinton -1. There was no net change to the total number of delegates.

Note: This post is an update based on the data on ElectionGraphs.com. Election Graphs tracks both a poll based estimate of the Electoral College and a numbers based look at the Delegate Races. All of the charts and graphs seen in this post are from that site. Additional graphs, charts and raw data can be found there. Follow @ElectionGraphs on Twitter or like Election Graphs on Facebook to see announcements of updates or to join the conversation. For those interested in individual general election poll updates, follow @ElecCollPolls on Twitter for all the polls as they are added. If you find the information in these posts interesting or useful, please consider visiting the tip jar.

Edit 17:40 to fix a typo where I said Clinton needed 42 delegates instead of 43 in one of the places it is mentioned.

@ElectionGraphs tweets from 2016-06-05 (UTC)

@ElecCollPolls tweets from 2016-06-05 (UTC)

@abulsme tweets from 2016-06-05 (UTC)

Democrats: Clinton wins the Virgin Islands, getting close now

With the final results all but inevitable, these updates will be somewhat mechanical absent something unexpected happening.

After Oregon and Kentucky, Clinton only needed 11.37% of the remaining delegates to win. Sanders needed 88.84% of the remaining delegates.

In the Virgin Islands, Clinton got 6 delegates, Sanders got 1.

In other changes since Oregon and Kentucky due to superdelegate updates and adjustments in Maryland, Oregon and Michigan there was a net change of Clinton +17, Sanders +8.

So total change since Oregon and Kentucky: Clinton +23, Sanders +9.

That is Clinton 71.88%, Sanders 28.13%.

So Clinton met her target, Sanders did not.

Updated graphs:

chart-158

New delegate totals: Clinton 2298, Sanders 1548, O’Malley 1.

There are 918 delegates left. Clinton needs 85 of them. Sanders needs 835 of them.

chart-159

Clinton now needs 9.26% of the remaining delegates to win. Sanders needs 90.96%.

This of course includes superdelegates. The Sanders camp continues to insist that you shouldn’t count superdelegates until the convention because until then they can change their minds. It is true they can change their minds, but we have been logging whenever that happens, and it has been rare. The best we can tell about how superdelegates will vote is to take their public preferences at face value. If they change their minds and they say so, we will know and the counts will change. In the mean time, to ignore their preferences in the count would be to intentionally ignore data about the current situation.

Right now Clinton only needs 85 more delegates to clinch the nomination. There are still 145 superdelegates who have not stated a preference. They could put Clinton over the top at any time. The Clinton folks undoubtedly do not want superdelegates to put them over the top though, so they may actually be asking the remaining superdelegates NOT to make any endorsements in the next few days.

Some media agencies actually have Clinton’s delegate count a bit higher than our count, which matches The Green Papers exactly at this point. This is because those media organizations have been able to privately confirm the preferences of some superdelegates who have not made public commitments. Both this site and the Green papers use the Wikipedia superdelegate tally as our source, and this only includes publicly confirmed preferences.

In any case, we are very close. Between the Puerto Rican primary and superdelegates, it is possible Clinton will hit the magic number before the big contests on June 7th. Most likely though, she’ll get there as soon as the polls close in New Jersey on the 7th. The rest of the June 7th states will just be icing on the cake.

Update 21:45 – Superdelegate scan +6.

Note: This post is an update based on the data on ElectionGraphs.com. Election Graphs tracks both a poll based estimate of the Electoral College and a numbers based look at the Delegate Races. All of the charts and graphs seen in this post are from that site. Additional graphs, charts and raw data can be found there. All charts above are clickable to go to the current version of the detail page the chart is from, which may contain more up to date information than the snapshots on this page, which were current as of the time of this post. Follow @ElectionGraphs on Twitter or like Election Graphs on Facebook to see announcements of updates or to join the conversation. For those interested in individual general election poll updates, follow @ElecCollPolls on Twitter for all the polls as they are added.

Edit 2016-06-06 16:55 UTC to add yesterday’s superdelegate scan, which I had neglected to add at the time.

@ElectionGraphs tweets from 2016-06-04 (UTC)

@ElecCollPolls tweets from 2016-06-04 (UTC)