The national polls at this point show that Trump’s “bump” from clinching the nomination is most likely already over, and Clinton has started to gain ground again. You can see this in both the Pollster and RCP charts. Here at Election Graphs though we track the state level polls and model the electoral college.
Since in any given state there are fewer polls than are done at the national level, the state poll averages move more slowly, and therefore the national picture also reacts more slowly to changes in the state of the race. So while the national polls have seen the bounce come or go, we are still seeing improvement in Trump’s situation.
Since the last update about 9 days ago there have been polls added in New Mexico, Virginia, North Carolina, Oregon, Michigan, New York, New Jersey, New Hampshire, Georgia, California (x4), and Florida. The Florida one is the one that resulted in an overall change.
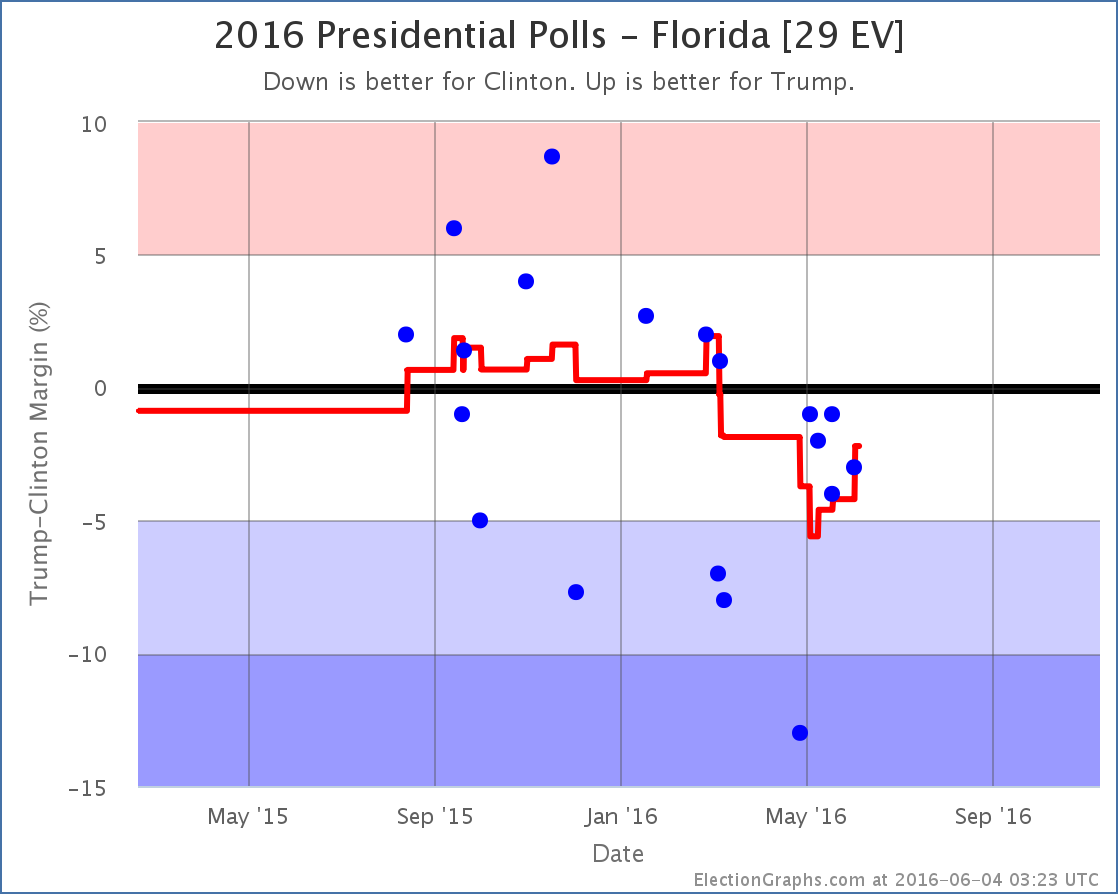
Basically, what now looks like an outlier poll from April showing Clinton with a huge 13% lead rolls off the average and so we have a pop in the Trump direction. Florida doesn’t change categories though. I had it classified as “Weak Clinton” before, and it is still “Weak Clinton” now.
But Florida was the tipping point state, the state that would have put Clinton over the top if you rank the states by how strongly they support one candidate over the other. So when Florida moves, so does the tipping point:
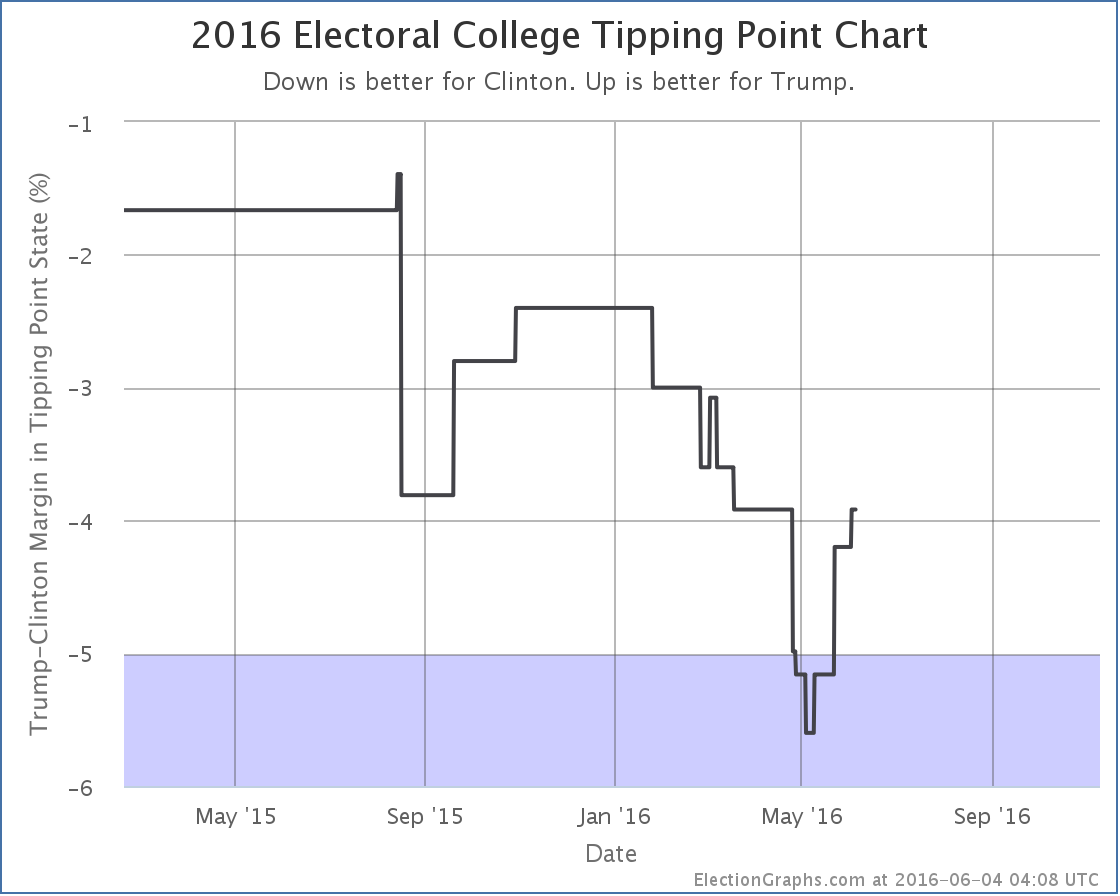
The tipping point moves from a 4.2% Clinton lead in Florida to a 3.9% Clinton lead in Nevada.
This means that while Clinton is clearly ahead, it would only take about 2% of people changing their minds (if those 2% were evenly distributed across the country) to flip the lead to Trump. You could get a similar result from the undecideds breaking disproportionately to Trump.
The national polls indicate Clinton is pulling further ahead again. We will quite possibly see that soon at the state by state level tracked here. But not yet. For now, the analysis here is still showing Trump gaining ground.
157.3 days until polls start to close on election night 2016.
Note: This post is an update based on the data on ElectionGraphs.com. Election Graphs tracks both a poll based estimate of the Electoral College and a numbers based look at the Delegate Races. All of the charts and graphs seen in this post are from that site. Additional graphs, charts and raw data can be found there. All charts above are clickable to go to the current version of the detail page the chart is from, which may contain more up to date information than the snapshots on this page, which were current as of the time of this post. Follow @ElectionGraphs on Twitter or like Election Graphs on Facebook to see announcements of updates or to join the conversation. For those interested in individual general election poll updates, follow @ElecCollPolls on Twitter for all the polls as they are added.
Leave a Reply
You must be logged in to post a comment.