This is the website of Abulsme Noibatno Itramne (also known as Sam Minter). Posts here are rare these days. For current stuff, follow me on Mastodon

Categories

Calendar

July 2026
S M T W T F S
 1234
567891011
12131415161718
19202122232425
262728293031  

Democrats: Northern Marianas results, plus 2008 and 2012 comparison

On Saturday we got results from the Northern Mariana Islands. A whopping 6 delegates were at stake, so this almost wasn’t worth its own post, but here goes. Then we’ll follow it up with a quick comparison with 2008 and 2012.

Clinton won 4 delegates. Sanders won 2.

Since the post on the Michigan results between Michigan finalizing results and superdelegate preferences we have an additional net change of Clinton +2, Sanders -1.

So since the Michigan post, a total of Clinton +6, Sanders +1. So 85.71% of delegates to Clinton, way more than the 38.96% she needed to be on the glide path to the nomination.
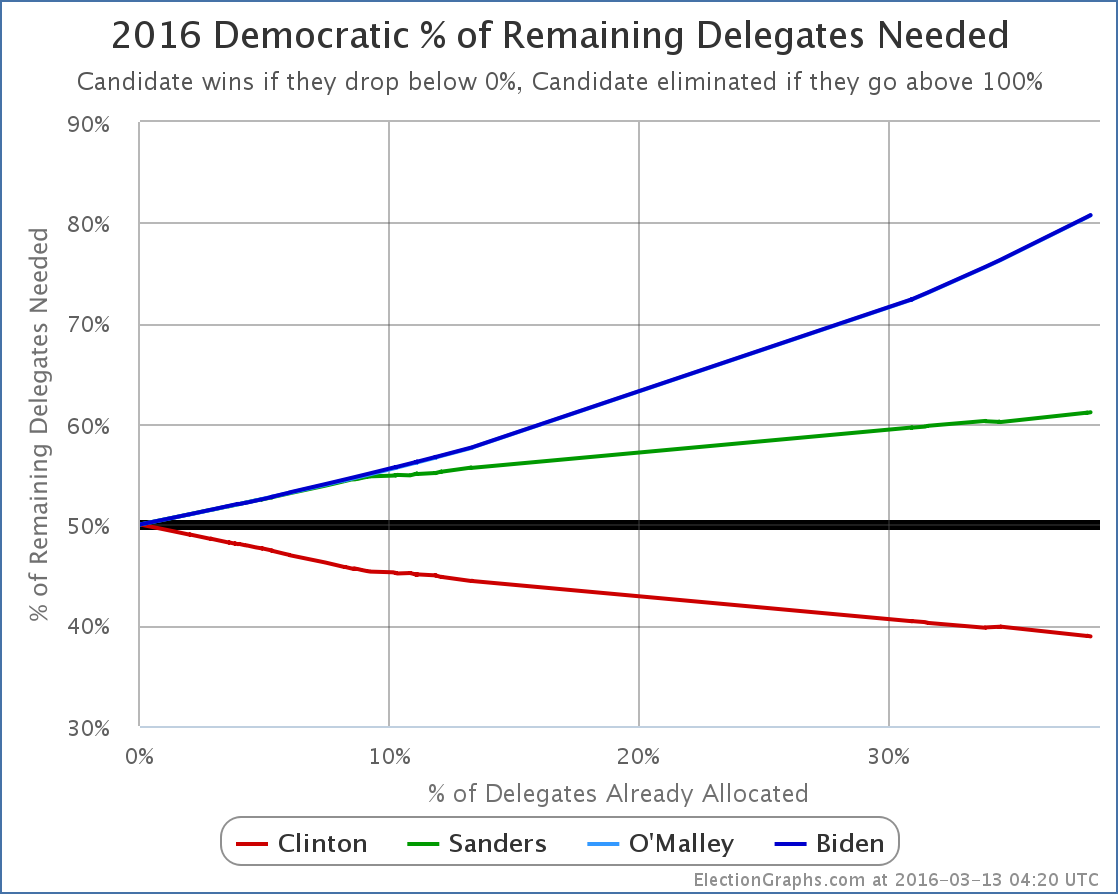
chart-75

Clinton now needs 38.90% of the remaining delegates to win. Or more if a large number of superdelegates start to defect. But that hasn’t happened yet.

Yawn.

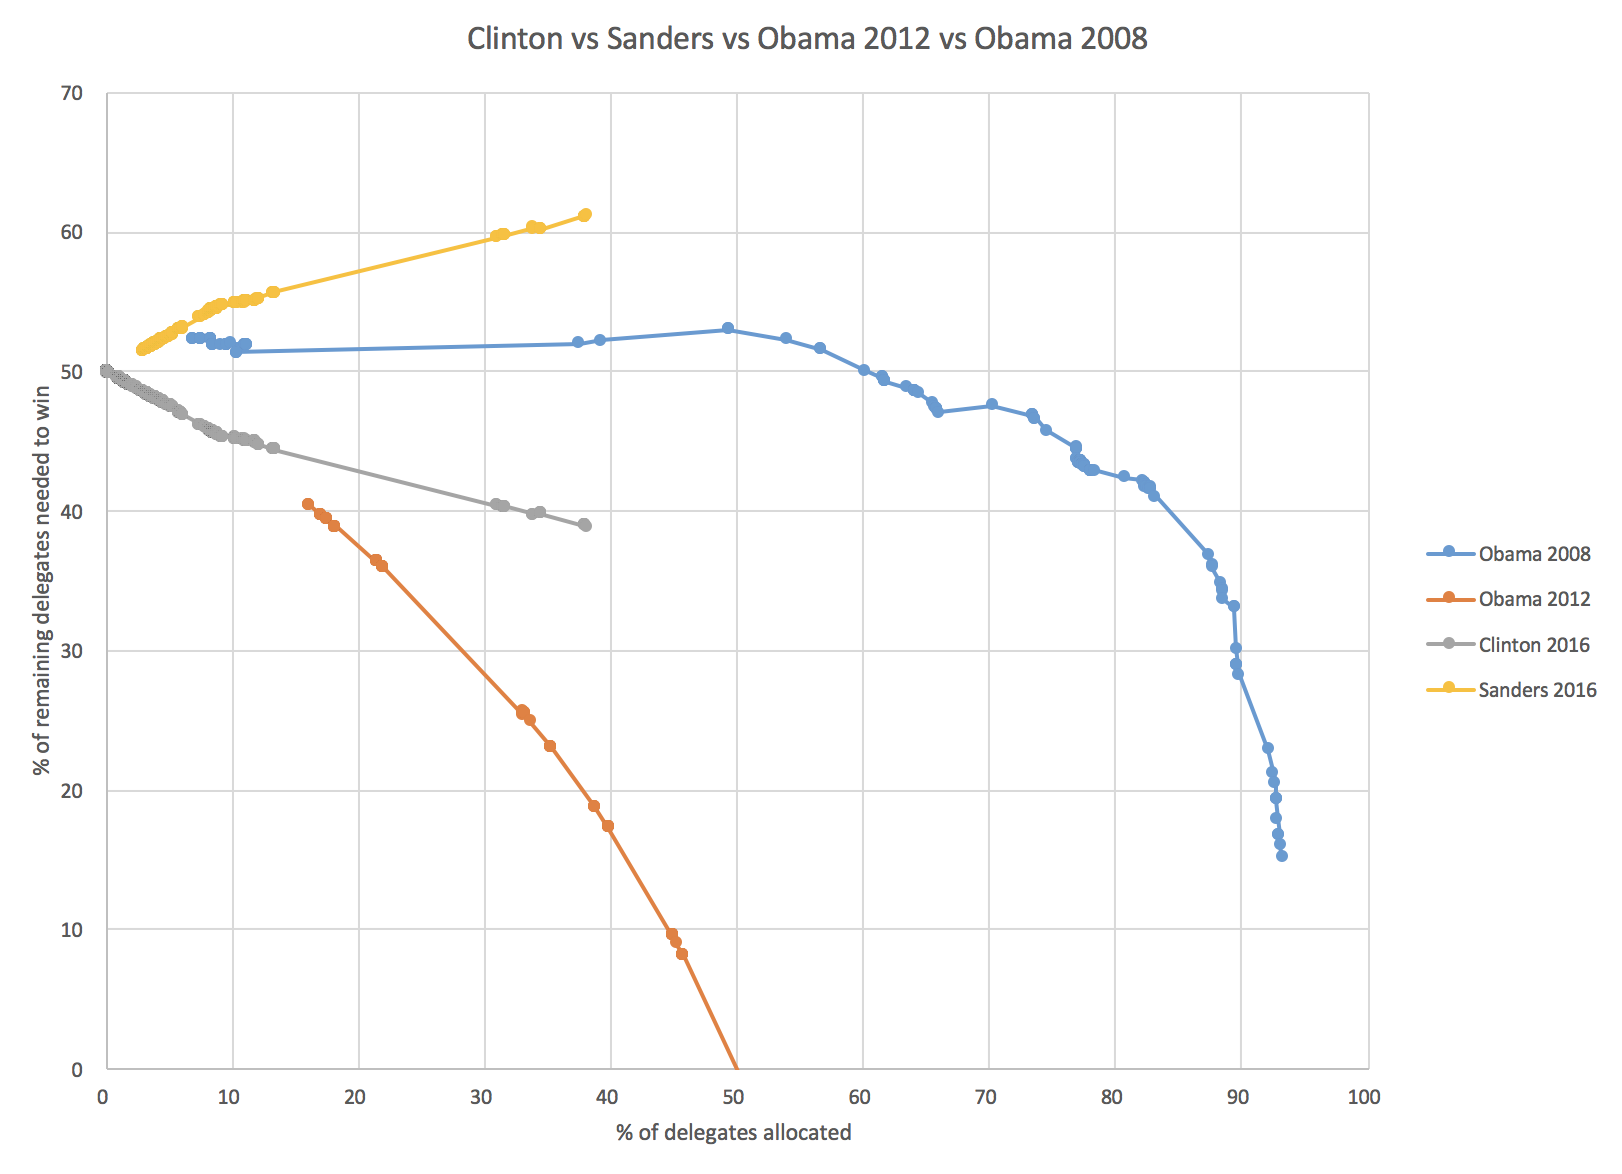
OK, since not much happening there, just a quick comparison of where Clinton and Sanders’ “% of remaining needed to win” is compared to Obama’s at similar points in 2008 and 2012. (For clarity, I’ve eliminated some oddness in the chart at the very end of the 2008 line when delegates were restored to states that had been stripped of them for rules violations and such.)
Screen Shot 2016-03-13 at 18.52.13422

The blue line is Obama in 2008. At this point he was still behind! He needed about 52% of the remaining delegates to win. He managed that of course, and ended up winning. Because of the competition from Clinton, Obama did not clinch the nomination until about 96% of the delegates had been determined.

The orange line was Obama in 2012 when he was unopposed. Aside from a few random protest delegates here and there he essentially collected 100% of delegates as soon as they became available, and clinched at the 50% mark.

Clinton 2016 so far is neatly splitting the difference. She is far far ahead of where Obama was in 2008, but of course not doing as well as she would if she was unopposed.

And then Sanders 2016. Notice that while Obama was behind at this stage, he was basically holding steady. He was not getting further and further behind with each new primary or caucus. Then right around when he hit the 50% mark, he started winning decisively, and caught up and won. Sanders is not holding the line. He is not keeping up. He keeps falling further and further behind the pace he would need to catch up and win. This is not what a come from behind victory looks like. This is what a stay behind loss looks like.

Of course if Sanders started winning every contest from here on out by large margins, then Clinton superdelegates might start abandoning her in droves and this graph COULD still change rapidly. If and when that happens, we’ll see it. But it hasn’t happened yet, and the longer this goes on, the less likely that becomes. It would require a DRAMATIC change in the the race. As I’ve said before, we’re talking something on the order of a new Clinton scandal that even Clinton die-hards think is disqualifying, or a major Clinton health issue, not just Sanders doing well and winning a few states.

[Update 2016-03-15 05:07 UTC – Revision to Kansas delegate results, plus superdelegate changes. Net: Clinton +4, Sanders +1]

[Update 2016-03-16 00:31 UTC – Superdelegate changes. Net: Clinton -1]

Note: This post is an update based on the data on ElectionGraphs.com. Election Graphs tracks both a poll based estimate of the Electoral College and a numbers based look at the Delegate Races. All of the charts and graphs seen in this post are from that site. Additional graphs, charts and raw data can be found there. All charts above are clickable to go to the current version of the detail page the chart is from, which may contain more up to date information than the snapshots on this page, which were current as of the time of this post. Follow @ElectionGraphs on Twitter or like Election Graphs on Facebook to see announcements of updates or to join the conversation. For those interested in individual general election poll updates, follow @ElecCollPolls on Twitter for all the polls as they are added.

@ElectionGraphs tweets from 2016-03-12 (UTC)

@abulsme tweets from 2016-03-12 (UTC)

Curmudgeon’s Corner: One Thousand Likes

This week on Curmudgeon’s Corner, Sam and Ivan talk about Sam’s son’s trip to the doctor, they respond to a bunch of listener feedback, talk a bit about Apple and Nancy Reagan, and then finally jump into Election 2016. Within that topic they cover the charges of Trump inciting violence, the delegate math, what might happen at a contested convention, explanations for the Sanders win in Michigan… and more!

Click below to listen or subscribe… then let us know your own thoughts!

CCCover20151125bw
Recorded 2016-03-12

Length this week – 1:38:06

1-Click Subscribe in iTunes
View Podcast in iTunes
View Raw Podcast Feed
Download MP3 File
Follow the podcast on Facebook

Show Details:

  • (0:00:10-0:16:37) But First
    • Delayed Show
    • Agenda
    • Alex Doctor Visit
    • Alex Test Results
  • (0:17:25-0:43:53) Feedback!
    • Feedback Format
    • Jenn on which nomination process Sam should do
    • Bruce on which nomination process Sam should do
    • Richard on a show format suggestion
    • Jon on Gary Johnson
    • Matt on Kanye
    • Edward on Trump
  • (0:44:32-0:57:47) Mini Lightning Round
    • Alex’s iPad
    • Alex’s YouTube Channel
    • Upcoming Apple Event
    • Snowden on Apple vs FBI
    • Nancy Reagan
  • (0:58:28- 1:36:24) Election 2016
    • Trump inciting violence?
    • Trump salutes?
    • Delegate Math
    • Contested Convention
    • Sanders Michigan Win
    • Ivan’s Vote

Electoral College: Mixed movement for both Trump and Cruz

Since my last Electoral College blog post there have been new polls in New York, Florida, New Jersey, Ohio and Pennsylvania. There were notable changes for two candidate pairs. But for both of them, the news was mixed. Lets take a look:

Clinton vs Trump

chart-69

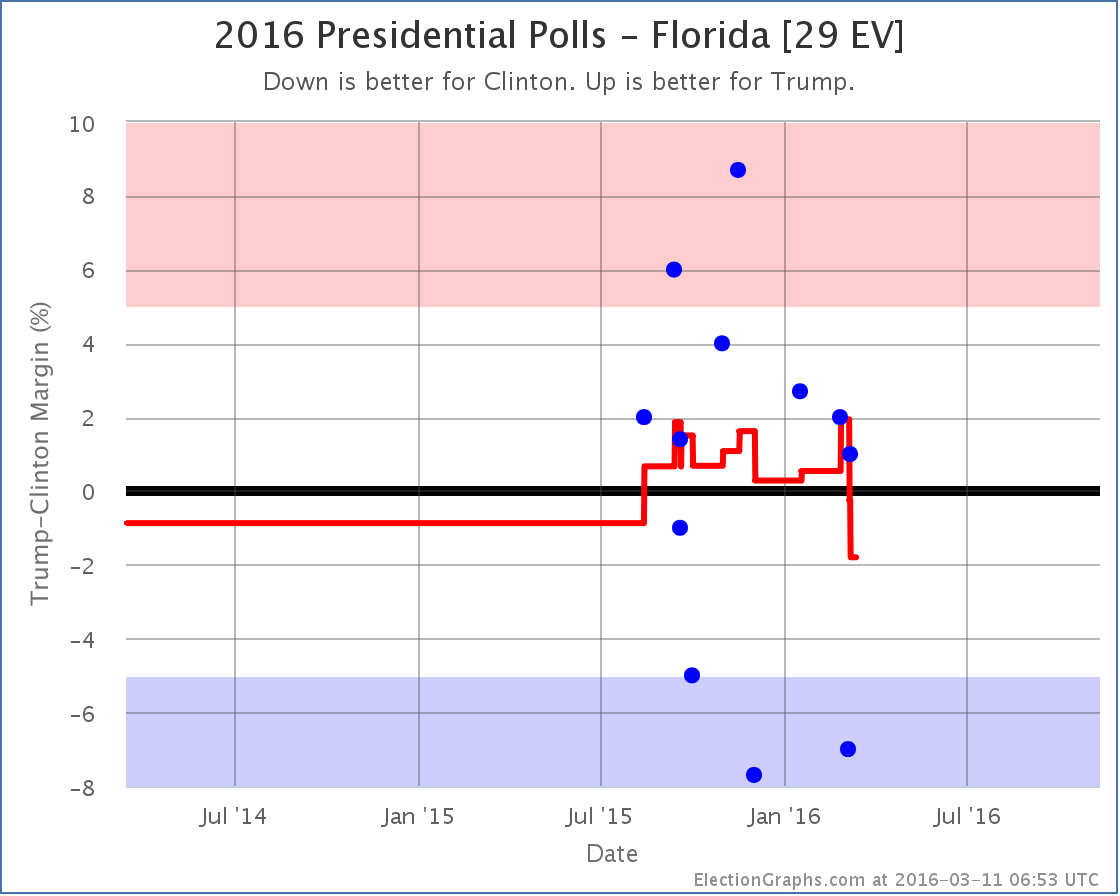
With some strong polls from last fall rolling off the average, Florida flips from “Weak Trump” to “Weak Clinton” with the state now sitting at a 1.8% Clinton lead. This is still a very “close could go either way” result, but it puts Florida on Clinton’s side of the fence so she gets Florida’s 29 electoral votes in her “Expected” case:

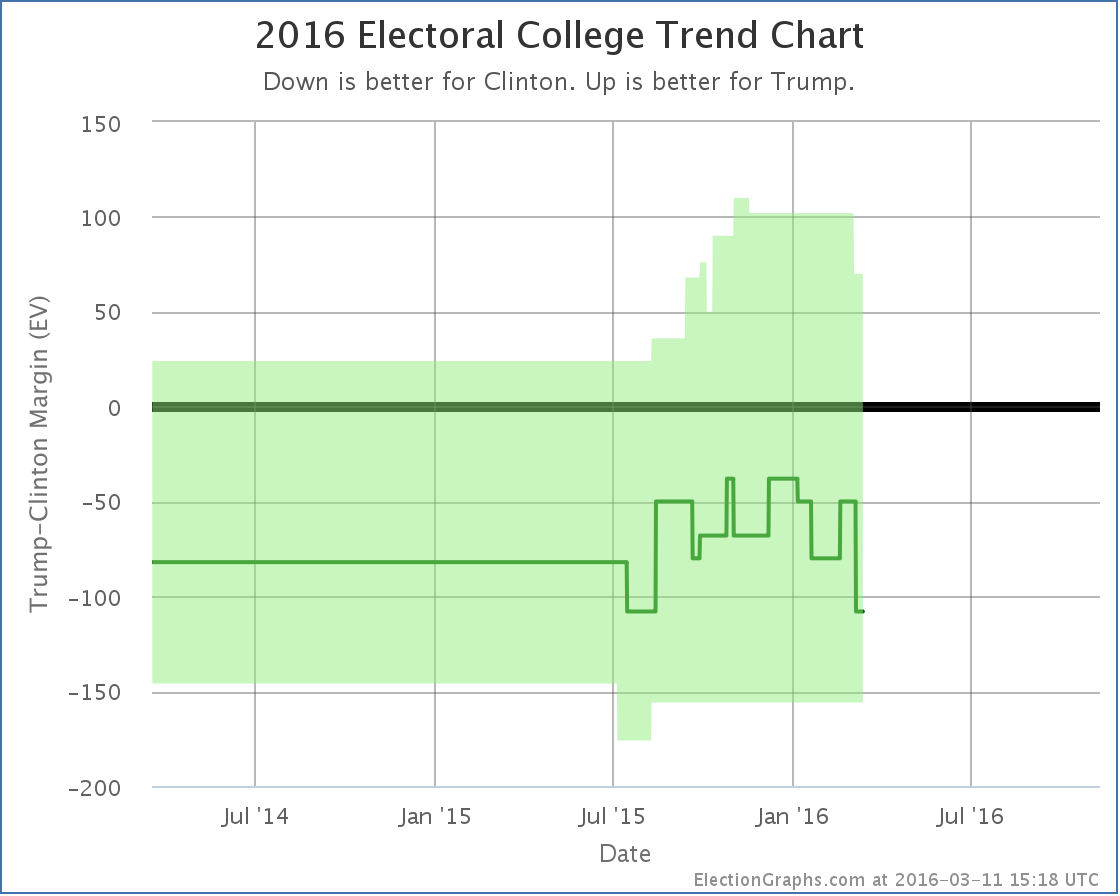
chart-70

Florida is a big state and makes a big difference. The expected result is now a 108 electoral vote win by Clinton. But it is important to remember that given all the close states that could easily move, anything from Clinton by 156 to Trump by 70 is very easy to imagine given the current polling.

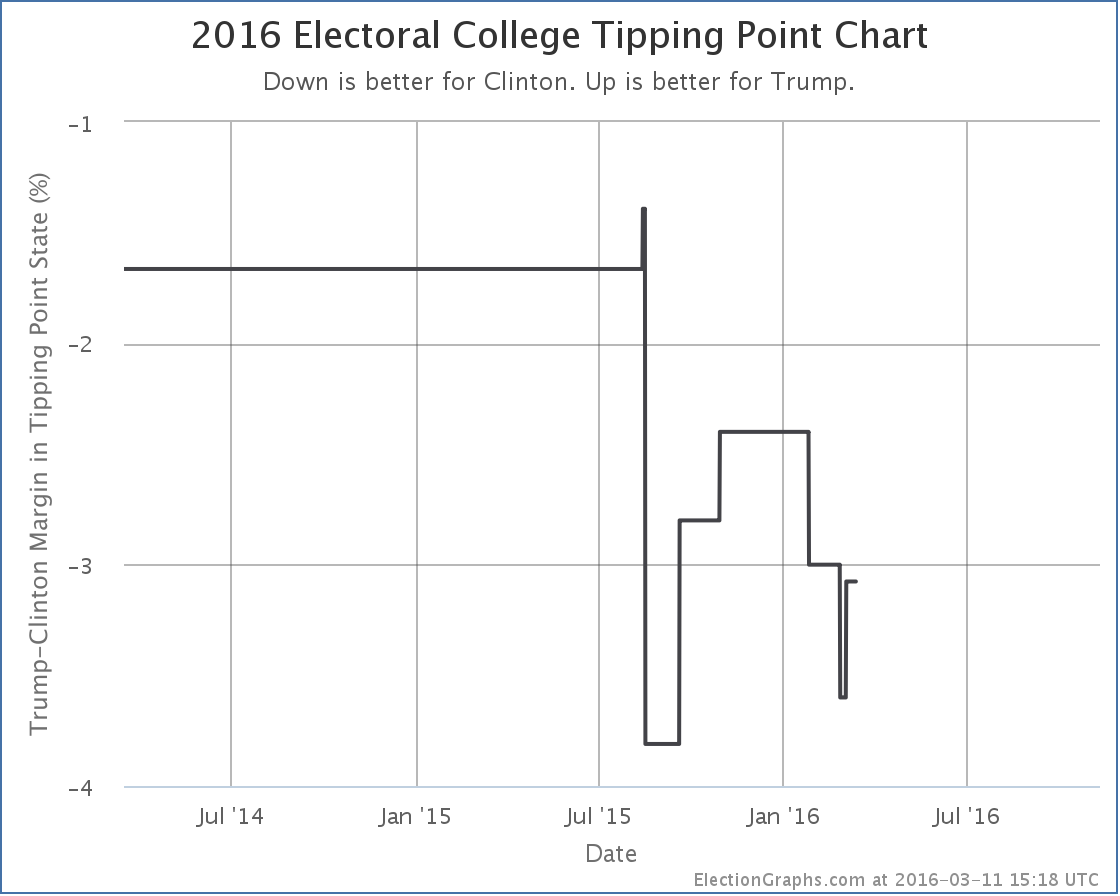
But there was movement for Trump in the other direction too. He improved in Pennsylvania, and while it didn’t change the status of Pennsylvania (Weak Clinton) it did move Trump’s tipping point:

chart-71

After a very brief dip lower, Trump’s tipping point pops back up to being behind Clinton by only 3.1%. Remember, the tipping point essentially represents how far ahead or behind a candidate is nationally, but adjusted for the effects of the electoral college.

So Trump’s “expected” result gets a little bit worse, but the amount he has to move polls to flip that result to a win gets a little smaller.

Clinton vs Cruz

chart-72

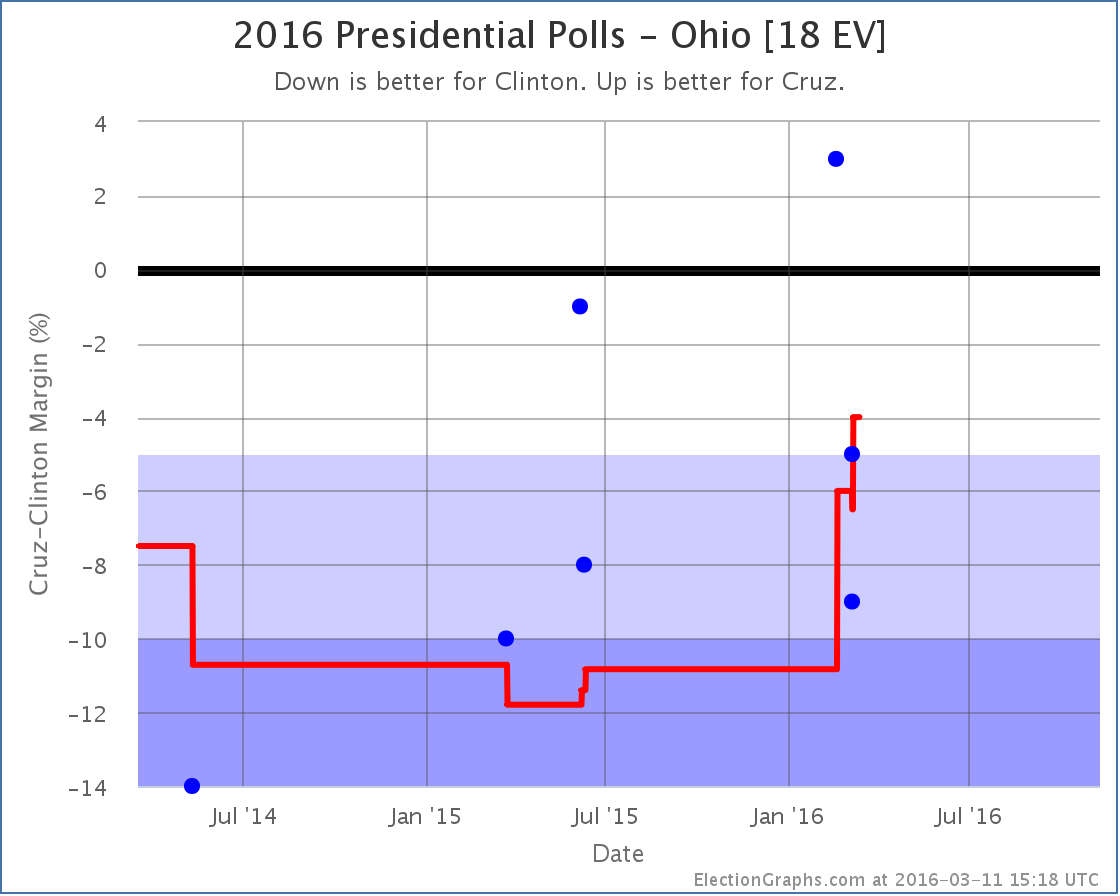
While Trump was weakening in Florida, Cruz’s poll average was improving in Ohio. He is now behind Clinton by only 4.0%. She still leads, but this is close enough for me to consider Ohio a swing state and a possible pick up for Cruz, which improves his “best case”…

chart-73

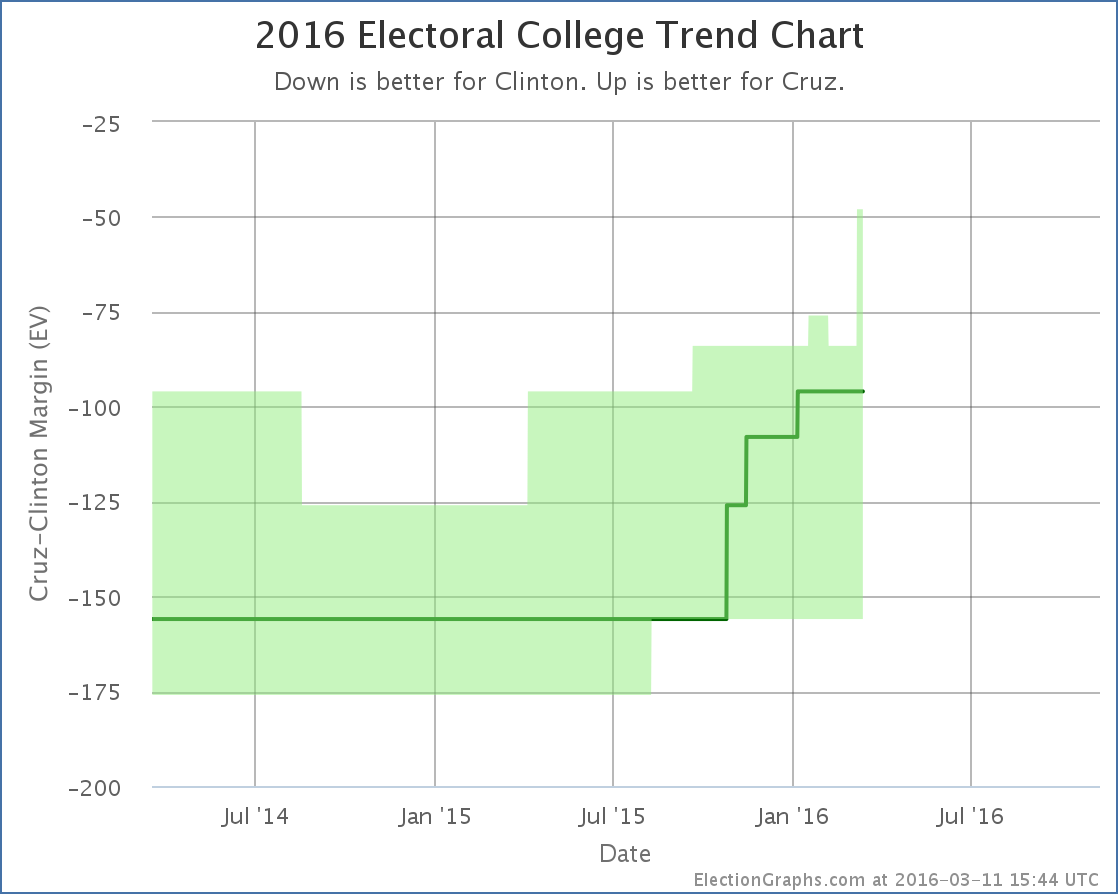
Now if Cruz wins all the states he is ahead in, plus flips Nevada and Ohio where he is close… he loses by only 48 electoral votes.

But still, it is an improvement. And Cruz has been on an improving trend for about a year now. If it continues, he might eventually be competitive.

On this metric anyway. As with Trump above, his tipping point also moves, but in the opposite direction:

chart-74

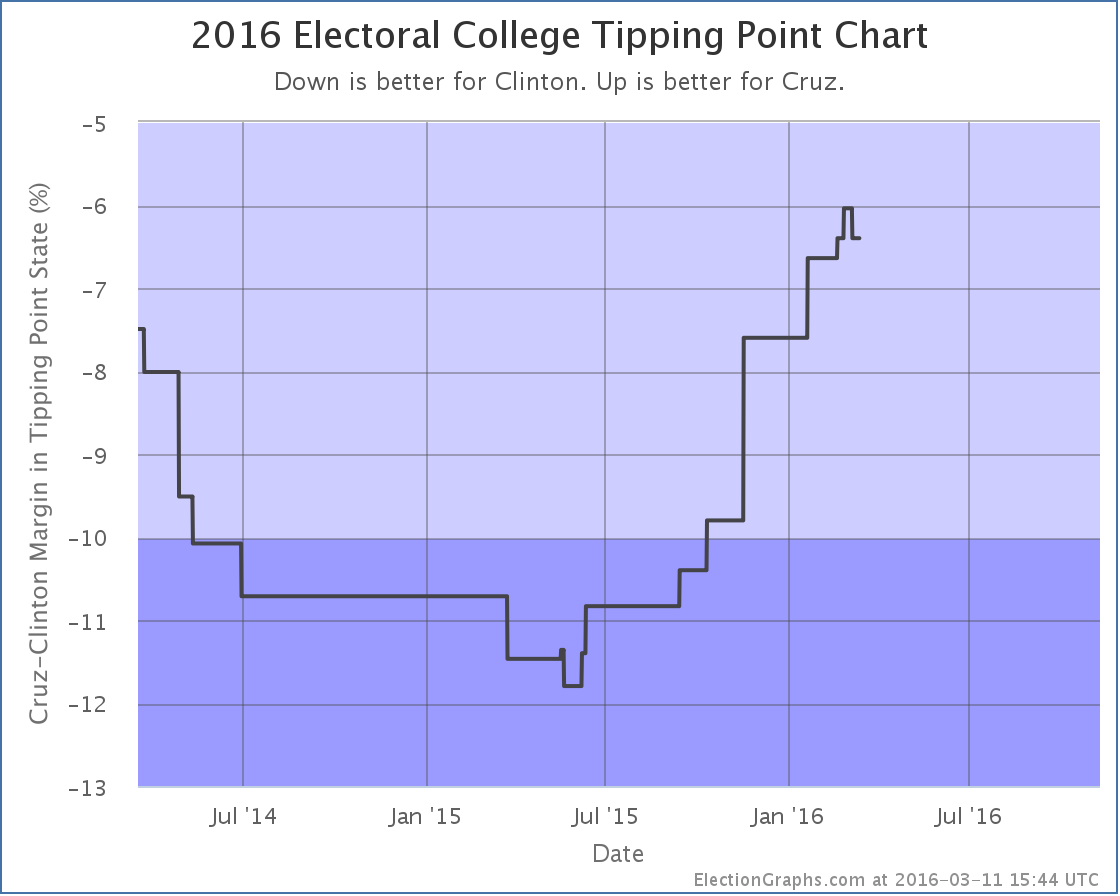
Cruz’s poll average in Florida dropped a bit. The category didn’t change (Strong Clinton) but the movement did cause Cruz’s tipping point to go from 6.0% behind Clinton to being 6.4% behind Clinton.

Either way, Cruz continues to be far behind Clinton when you look at things based on state level polls. As I have discussed here before, looking at national polls makes this matchup look much closer. It is unclear at this point if this is exposing an actual divergence between the popular vote and electoral college due to the regional distribution of candidate support, or if it is simply that there haven’t been enough state level polls of this matchup to catch up with recent changes to support levels. If Cruz becomes the Republican nominee, this would eventually become clear.

Of course, looking at the delegate race that doesn’t look too likely right now, so we may never know.

241.8 days until polls start to close.

Note: This post is an update based on the data on ElectionGraphs.com. Election Graphs tracks both a poll based estimate of the Electoral College and a numbers based look at the Delegate Races. All of the charts and graphs seen in this post are from that site. Additional graphs, charts and raw data can be found there. All charts above are clickable to go to the current version of the detail page the chart is from, which may contain more up to date information than the snapshots on this page, which were current as of the time of this post. Follow @ElectionGraphs on Twitter or like Election Graphs on Facebook to see announcements of updates or to join the conversation. For those interested in individual general election poll updates, follow @ElecCollPolls on Twitter for all the polls as they are added.

@ElectionGraphs tweets from 2016-03-11 (UTC)

  • 05:32:56 Superdelegate update. One less for Clinton as a del says they will vote for whoever is the pledged del winner, so uncommitted for now.
  • 16:02:42 FYI, all dels selected for the Virgin Islands on the R side were officially uncommitted, so still TBD on my charts. https://t.co/VCq2EHJXd7

@ElecCollPolls tweets from 2016-03-11 (UTC)

@abulsme tweets from 2016-03-11 (UTC)

  • 03:00:05 Missed first half of debate cause Alex doctor appointment. Listening in car on way home now. So still no tweets.
  • 04:06:13 Missed most of debate. Not as sad about that as I thought I would be. Sounds like nobody seriously attacked Trump? They gave up? Trump wins.
  • 04:22:41 Sounds like Trump was calm and civil too. Full general election pivot in progress.
  • 05:23:09 . @TheGreenPapers When I add your state pages I get Clinton 1228, Sanders 575, O’Malley 1. But your soft totals have 1230-573-1. Math error?
  • 05:25:02 Retweeted @Marty2634 05:24:42 @abulsme What did you think of CNN's 2016 GOP Pre TV Debate in Miami? Will D. Trump have enough Delegates to be Nominee by Convention? in reply to abulsme
  • 05:26:51 .@Marty2634 I had 2 take my son to a doctor’s appt, so missed most of it this time. Just caught a little toward the end. What did you think? in reply to Marty2634
  • 05:28:16 .@Marty2634 At this point I think Trump’s odds of an outright delegate majority probably about 75%. All depends on FL and OH of course. in reply to Marty2634
  • 05:30:42 Retweeted @Marty2634 05:30:10 @abulsme I thought it was a Very "Substantive" GOP Pres TV Debate with Candidates on their Best Behavior-Not Insults, Put downs, etc in reply to abulsme
  • 07:37:27 Power back on. Yay!
  • 07:43:20 Listening to (2015/12/22) The future of work (Culture) (Repost) https://t.co/PhXNN9qPVa
  • 17:02:38 We’re at 999 likes for the Curmudgeon’s Corner podcast on Facebook. Does anybody here on Twitter want to be #1000? https://t.co/z6wErppGfc
  • 18:00:41 Retweeted @mattyglesias 17:28:23 GOP keeps coming up with anti-Trump strategies that would have worked had they been implemented a month earlier.

@ElectionGraphs tweets from 2016-03-10 (UTC)

@ElecCollPolls tweets from 2016-03-10 (UTC)

  • 01:02:54 Blog posts covering yesterday’s results for both parties are out. Look to @ElectionGraphs for the info.