This is the website of Abulsme Noibatno Itramne (also known as Sam Minter). Posts here are rare these days. For current stuff, follow me on Mastodon

Categories

Calendar

March 2026
S M T W T F S
1234567
891011121314
15161718192021
22232425262728
293031  

Democrats: Clinton wins South Carolina, plus a look at Super Tuesday

As expected, Clinton easily won South Carolina. Clinton won 39 delegates, Sanders got 14.

Since my last post on the Democrats the tally has also added a net 10 superdelegates for Clinton, 1 for Sanders, and 1 straggler for O’Malley.

As of that last post, Sanders needed to get more than 55.03% of delegates to be on track to catch up with Clinton and win. Obviously that hasn’t happened with these updates. He got 23.08% of the delegates since that post.

So the end result is that the percentage of the remaining delegates Sanders needs to win goes up, while that number for Clinton goes down:

chart (97)

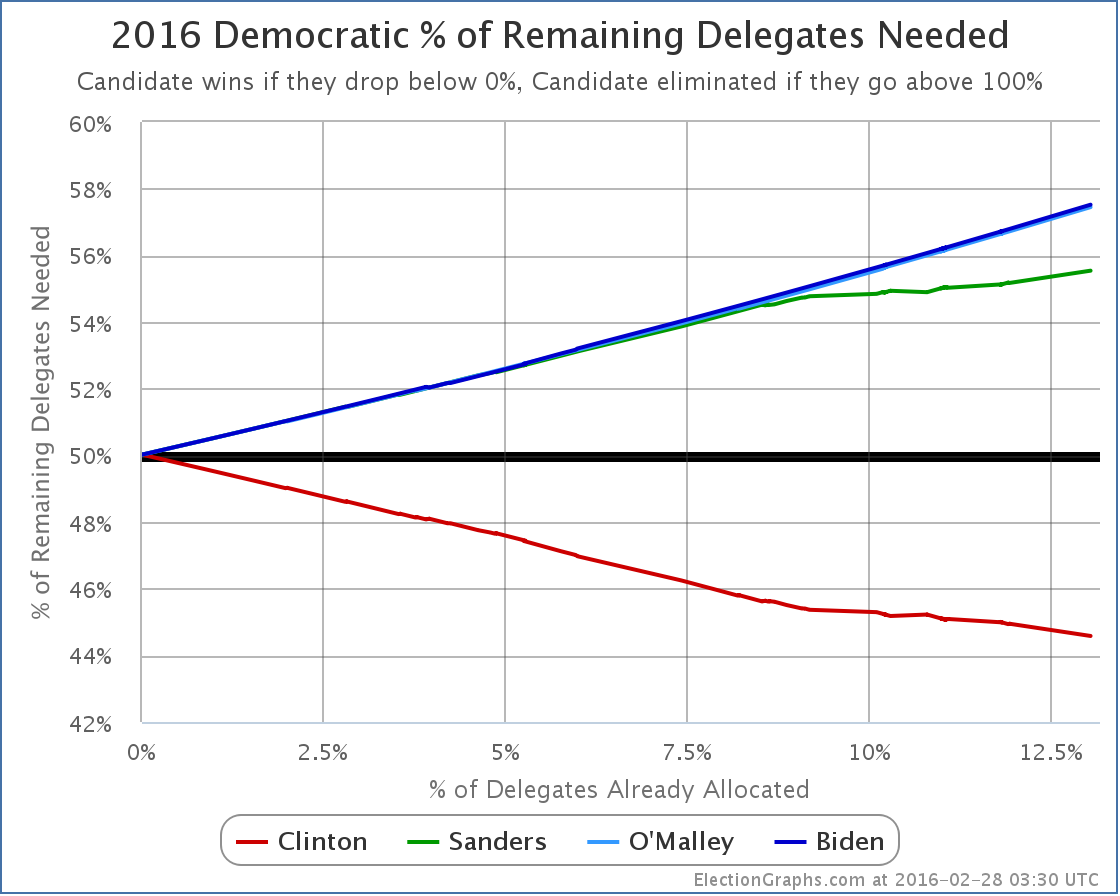
South Carolina is that slight acceleration of the curves starting at about 11.9%.

Sanders now needs 55.54% of the remaining delegates to catch up and win. (Or less if he starts flipping Clinton superdelegates to his side, but there has been no sign of that yet.)

Meanwhile, Clinton only needs 44.58% of the remaining delegates to win.

Frankly, in the 2008 and 2012 cycles once the frontrunner needed less than 45% of the delegates to win, it was time to start calling the race over. Yes, something happening that would allow a challenger to catch up and win is still possible. But it is unlikely. And with each additional contest where the challenger fails to make their own “% needed to win” mark, it gets harder.

But lets not consider it done quite yet. Super Tuesday is coming up in a few days. Maybe there is something there to indicate this isn’t over quite yet. Just as I did for the Republicans, lets game out what Super Tuesday looks like based on current polling. I’ll use the RCP poll averages, then try to estimate delegates based on the rules in each state.

Texas (222 delegates)

  • Current poll averages: 59.9% Clinton, 33.6% Sanders
  • Delegate estimates: 142 Clinton, 80 Sanders

Georgia (102 delegates)

  • Current poll averages: 62.8% Clinton, 26.0% Sanders
  • Delegate estimates: 72 Clinton, 30 Sanders

Virginia (95 delegates)

  • Current poll averages: 54.5% Clinton, 35.0% Sanders
  • Delegate estimates: 58 Clinton, 37 Sanders

Massachusetts (91 delegates)

  • Current poll averages: 46.3% Sanders, 45.7% Clinton
  • Delegate estimates: 46 Sanders, 45 Clinton

Minnesota (77 delegates)

  • Current poll averages: 54.5% Clinton, 28.5% Sanders
  • Delegate estimates: 51 Clinton, 26 Sanders

Tennessee (67 delegates)

  • Current poll averages: 53.0% Clinton, 30.0% Sanders
  • Delegate estimates: 43 Clinton, 24 Sanders

Colorado (66 delegates)

  • Last poll from November so using national averages: 47.2% Clinton, 42.2% Sanders
  • Delegate estimates: 35 Clinton, 31 Sanders

Alabama (53 delegates)

  • Using only poll from February: 59% Clinton, 31% Sanders
  • Delegate estimates: 35 Clinton, 18 Sanders

Oklahoma (38 delegates)

  • Current poll averages: 45.0% Clinton, 36.0% Sanders
  • Delegate estimates: 21 Clinton, 17 Sanders

Arkansas (32 delegates)

  • Current poll averages: 57.0% Clinton, 28.5% Sanders
  • Delegate estimates: 21 Clinton, 11 Sanders

Vermont (16 delegates)

  • Current poll averages: 84.5% Sanders, 9.5% Clinton
  • Delegate estimates: 16 Sanders

Democrats Abroad (13 delegates)

  • No polls, using national averages: 47.2% Clinton, 42.2% Sanders
  • Delegate estimates: 7 Clinton, 6 Sanders

American Samoa (6 delegates)

  • No polls, using national averages: 47.2% Clinton, 42.2% Sanders
  • Delegate estimates: 3 Clinton, 3 Sanders

OK. Adding all those up…

533 Clinton, 345 Sanders

Now, these are estimates based on relatively sparse polling and the assumption that candidate support is uniformly distributed within each state. The results will not be exactly like this.

But unless something major happens to change the picture in the next couple of days, the results on Tuesday should look broadly similar to this. With the estimate above, Sanders gets about 39.3% of the delegates. A far cry from the 55.5% he would need in order to actually improve his position against Clinton.

Adding the current delegates to the estimated Super Tuesday delegates, the new totals would be:

1,069 Clinton, 427 Sanders, 3 O’Malley

31.5% of the delegates will have been allocated. But 68.5% would still be available.

What would Sanders’ new “% of remaining needed to win” be at that point?

It would be 59.9%.

Sanders would need nearly 60% of the remaining delegates to catch up and win, or a massive defection of Clinton superdelegates to lower that number.

To imagine Sanders performing like this, you either have to believe the remaining states are vastly different in their preferences to the states that will have gone before (there is no evidence for this so far), or some massive seismic event would have to happen in the campaign to dramatically change minds of large numbers of Democratic voters in a very short timeframe.

A good argument could be made that absent a shocking surprise, this race is already done. After Super Tuesday, if the results are anything like the estimates above, then those hoping for a Sanders win will be grasping at the thinnest of straws. By the time we get to the end of March, again, absent that huge surprise, there will be no serious question any more.

Now, surprises do sometimes happen. You never know. But you don’t get to a Sanders win from here with just “normal” campaigning. It would take something bigger… a major Clinton scandal bigger than anything seen so far… a serious issue with Clinton’s health… something along those lines.

This doesn’t preclude Sanders staying in the race all the way until the convention and battling in every primary and caucus. He could do that if his cash flow holds out. But it would be to champion his issues and to try to move the party further in his direction, it would not be a serious attempt to win the nomination.

Three days from the time I post this, we’ll have Super Tuesday results and we’ll see just how close my poll based guestimates were and if this analysis holds up. More then…

[Update 2016-03-02 00:47 UTC – As a result of a final scan for superdelegates prior to adding Super Tuesday results we have a net change of +7 Clinton superdelegates, +2 Sanders superdelegates, -2 O’Malley superdelegates (they flipped to Clinton). This does not substantively change any of the analysis above and does not get a separate blog post, but a note here was warranted.]

Note: This post is an update based on the data on ElectionGraphs.com. Election Graphs tracks both a poll based estimate of the Electoral College and a numbers based look at the Delegate Races. All of the charts and graphs seen in this post are from that site. Additional graphs, charts and raw data can be found there. All charts above are clickable to go to the current version of the detail page the chart is from, which may contain more up to date information than the snapshots on this page, which were current as of the time of this post. Follow @ElectionGraphs on Twitter or like Election Graphs on Facebook to see announcements of updates or to join the conversation. For those interested in individual general election poll updates, follow @ElecCollPolls on Twitter for all the polls as they are added.

Electoral College: Some good news for Cruz, Mixed news for Rubio

Yes, all the attention is on South Carolina and Super Tuesday, but time for a quick electoral college update from recent poll updates. In the last batch of polls were new matchup results in Florida, Georgia, Wisconsin and West Virginia. These resulted in a few notable changes.

Clinton vs Trump

chart (89)

Well, actually, once again there was no significant update in the Clinton vs Trump race, but in this transitional phase where we are still getting polling for folks other than the frontrunners, I’ll mention the frontrunner status when there is a post highlighting changes with other candidate pairs. Trump’s lead in the average in Georgia actually dropped from 10.1% to 9.5% changing Georgia from “Solid Trump” to “Strong Trump” in my categorization, but this really doesn’t make any difference. Georgia isn’t in play at the moment. The situation remains that anything from Clinton winning by 156 to Trump winning by 102 is within the realm of the possible, and Clinton winning by 50 is the “expected” result if all the states go where their averages are currently pointing.

Clinton vs Cruz

chart (90)

Cruz improves a bit in Florida against Clinton, but not enough to change categories. Florida was however the tipping point state, so this also moves:

chart (91)

Cruz’s upward tipping point trend continues. Just a little bit further, and the Clinton vs Cruz race might actually look competitive!

(Reminder, the tipping point represents the margin in the state that would put the winner “over the top” if you ranked the states by their candidate preference. It is a good measure of how much the candidate who is behind would have to change national public opinion to flip the result and win.)

Clinton vs Rubio

This matchup had notable changes caused by the polls in two different states. First up, Florida:

chart (92)

The state didn’t change status. It was “Weak Clinton” before, and remains “Weak Clinton”. But as with Cruz, Florida was the tipping point state, and so the tipping point changes as well.

chart (93)

By this metric Rubio peaked in November and has been declining ever since. A Clinton vs Rubio matchup still looks incredibly close though. Clinton is only ahead here by 0.8%.

So this was good for Clinton. But there was also a change in Wisconsin that was good for Rubio:

chart (94)

All the recent polls have shown Wisconsin as a close state, whereas older polls had it Strong or Solid Clinton, and therefore the average has been moving up toward Rubio. With today’s update, it moves from “Strong Clinton” to “Weak Clinton”. This puts it in play for Rubio and improves his best case:

chart (95)

There are now ELEVEN close states in the Clinton vs Rubio contest, accounting for 141 electoral votes, which is quite a swing! Everything from Clinton by 126 to Rubio by 156 is now “in the bubble”. Clinton remains a slight favorite, winning by 12 electoral votes if all the states ended up following current poll results. But this is a tiny margin. Clinton vs Rubio remains essentially a tied race, with Florida’s 29 electoral votes at the tipping point.

And that is where things stand at the end of February.

254.9 days left until general election polls start to close.

Note: This post is an update based on the data on ElectionGraphs.com. Election Graphs tracks both a poll based estimate of the Electoral College and a numbers based look at the Delegate Races. All of the charts and graphs seen in this post are from that site. Additional graphs, charts and raw data can be found there. All charts above are clickable to go to the current version of the detail page the chart is from, which may contain more up to date information than the snapshots on this page, which were current as of the time of this post. Follow @ElectionGraphs on Twitter or like Election Graphs on Facebook to see announcements of updates or to join the conversation. For those interested in individual general election poll updates, follow @ElecCollPolls on Twitter for all the polls as they are added.

@ElectionGraphs tweets from 2016-02-27 (UTC)

@ElecCollPolls tweets from 2016-02-27 (UTC)

@abulsme tweets from 2016-02-27 (UTC)

Curmudgeon’s Corner: The Poorly Educated

This week on Curmudgeon’s Corner Sam and Ivan of course talk about Election 2016, covering both the Democratic and Republican nomination races, then some speculation about what a Clinton vs Trump race may look like. Before that though, they spend some time following up on both the Apple vs FBI case and the SCOTUS vacancy. And there is some feedback to discuss!

Click below to listen or subscribe… then let us know your own thoughts!

CCCover20151125bw
Recorded 2016-02-25

Length this week – 1:32:14

1-Click Subscribe in iTunes
View Podcast in iTunes
View Raw Podcast Feed
Download MP3 File
Follow the podcast on Facebook

Show Details:

  • (0:00:10-0:11:03) But First
    • Water Heater Fire
    • Commutes
    • Agenda
    • Feedback
  • (0:12:07-0:28:20) Apple vs FBI
    • PR Battle
    • Cracking Safes
    • Other ways to get info
    • Test Case
    • Slippery Slopes
    • Lavabit comparison
  • (0:29:06-0:42:09) SCOTUS and Congress
    • Doing Nothing
    • Republican Strategies
    • Options in January
    • Senate Implications
    • Republican Factions
    • Ivan for SCOTUS
  • (0:42:48-1:01:36) Election 2016 – Primaries
    • Ivan for SCOTUS continued
    • Clinton Still Winning
    • Judicial Murders
    • Trump SC/NV Wins
    • Dissipating Trump Denial
    • Gaming out Super Tuesday
  • (1:02:16-1:31:53) Election 2016 – Clinton vs Trump
    • Trump as third party after contested convention?
    • Are there really that many asshole racists?
    • The whiteness of the GOP
    • Clinton vs Trump personal attacks
    • Trump attacking from both Right and Left
    • Trump Reinvention
    • President Trump

@ElectionGraphs tweets from 2016-02-26 (UTC)

@ElecCollPolls tweets from 2016-02-26 (UTC)

@abulsme tweets from 2016-02-26 (UTC)

Electoral College: With new Ohio polls, Rubio and Cruz improve vs Clinton

We’re still in the phase where the pollsters ask about many candidate combinations. With the most recent polling in Ohio, there is no change in the Clinton vs Trump status, but there were changes to Clinton vs Rubio and Clinton vs Cruz. In both cases, the Republican position improves, and Clinton gets a little weaker.

Clinton vs Trump

No, this didn’t change, but since these are the two frontrunners, just a quick reminder of where that race stands:

chart-50

Anything from Clinton winning by 156 electoral votes to Trump winning by 102 electoral votes is plausible given the state polls. Clinton winning by 50 electoral votes is the “expected” result if each candidate wins all the states they are ahead in right now.

Clinton vs Rubio

chart-51

Ohio has been polled less often than one might expect for a state that is traditionally in the “swing state” category, and which looks like it might be again. But the polls for the last year or so have been trending in Rubio’s direction. With this poll, the average pops into the plus side for Rubio. He now leads in Ohio by 1.6% in the average. To be clear, that is still a very close race. But he now has the advantage, so we put Ohio on his side of the ledger.

chart-52

With Ohio back in his column again, if Rubio won every state he is ahead in, and Clinton won every state she is ahead in, Rubio would fall just 12 electoral votes short. He’s not back to leading the race yet, but it is very close. Flipping any one of Florida (0.2% Clinton lead), Virginia (1.2% Clinton lead), Minnesota (1.5% Clinton lead), Michigan (2.9% Clinton lead), or Nevada (4.5% Clinton lead) would do it.

With the large number of close states, anything from Clinton winning by 126 to Rubio winning by 136 would not be surprising though.

Clinton vs Cruz

chart-53

Cruz hasn’t managed to make Ohio competitive against Clinton yet, she still leads him by 6.0% in the poll average, but because with this update Ohio moved past the previous “tipping point state”, the tipping point here moves a bit toward Cruz.

As a reminder, the tipping point is the margin in the state that would put the winning candidate “over the edge” in the electoral college if you order the states by how strongly they support the candidates. Like this:

Screen Shot 2016-02-26 at 05.15.41651

Prior to this update, the tipping point in Clinton vs Cruz had been Florida, where Clinton led by 6.6%. Now the tipping point is Virginia, where Clinton leads by 6.4%.

The tipping point is essentially like looking at the national popular vote, except it takes into account the structure of the electoral college. It tells you how far the polls would have to move across the board in all states to flip the winner.

chart-54

Cruz trails Clinton by 6.4% in this metric… but he has slowly but surely been improving his position since last May. It would take a bit more movement before he actually looked competitive with Clinton though.

And that is where things are today.

256.7 days until polls start to close on election night.

Note: This post is an update based on the data on ElectionGraphs.com. Election Graphs tracks both a poll based estimate of the Electoral College and a numbers based look at the Delegate Races. All of the charts and graphs seen in this post are from that site. Additional graphs, charts and raw data can be found there. All charts above are clickable to go to the current version of the detail page the chart is from, which may contain more up to date information than the snapshots on this page, which were current as of the time of this post. Follow @ElectionGraphs on Twitter or like Election Graphs on Facebook to see announcements of updates or to join the conversation. For those interested in individual general election poll updates, follow @ElecCollPolls on Twitter for all the polls as they are added.