In the latest Curmudgeon’s Corner Sam, Ivan and Bruce talk about:
Recorded on 28 Oct 2012 Length this week – 1:28:25 |
 |
|||||
|
||||||
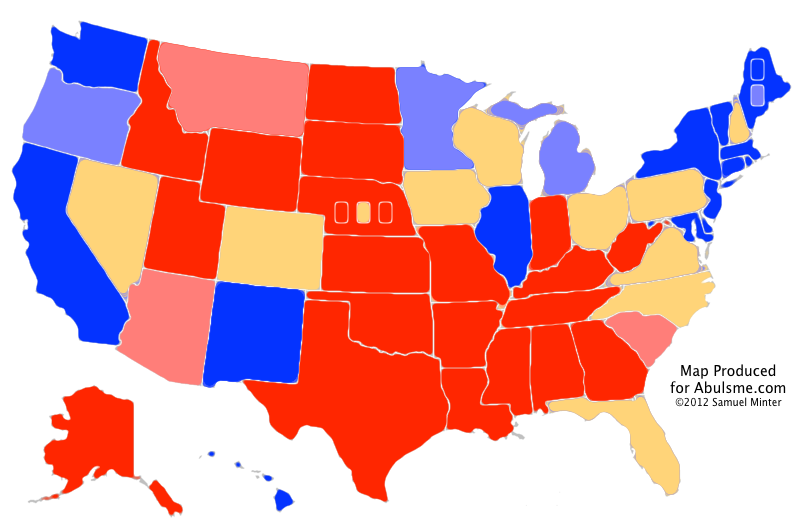
One change today, and as the headline implied, it is Nebraska’s 2nd congressional district. Nebraska is one of two states (the other is Maine) that does not award electoral votes with a winner take all formula. Instead, you get two electoral votes for winning the state as a whole, and then one electoral vote for winning each congressional district. In 2008, McCain won the state, but Obama got one electoral vote for winning Nebraska’s 2nd district, which is the district containing the city of Omaha. Nebraska as a whole, and Nebraska’s 1st and 3rd congressional districts are all very safely Romney. But the 2nd? Polling in Nebraska’s 2nd has been extremely sparse. I have only five data points in my spreadsheet since the 2008 election… and that is only because I include both values when a poll includes results for both registered and likely voters. (Yeah, yeah, that is probably methodologically unsound, I’ll reconsider in 2016.) So really, only 4 polls since 2008. And only three of them were in the last 12 months. So we don’t have a great picture. But lets look at what we do have:
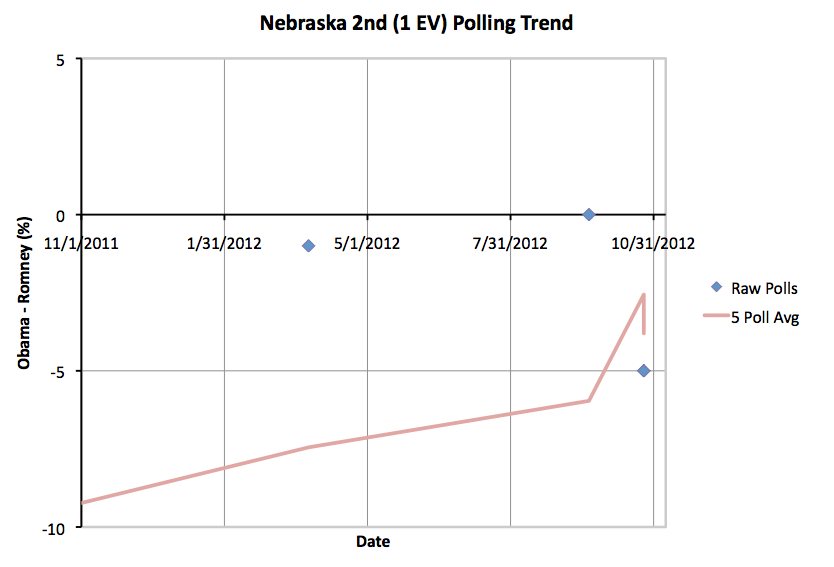
I’m showing the whole last year rather than just the last three months due to the paucity of polling. Until today, the five poll average still included the “seeds” from the 2004 and 2008 elections. In 2004 Kerry lost Nebraska to Bush by a full 22%, so that significantly depressed the average. If you did my five poll average only counting the results of the new poll for likely voters, the average would now be a Romney lead of 2.6%. Using my normal rules for the five poll average, you get a 3.8% Romney lead. There are other ways you could compute an average for NE-2 depending on how you want to weight current polls vs older polls, etc. But given that the polls we have seen this year show a 1% Romney lead (in March), a tie (in September), and a 5% lead (now, looking at either Registered or Likely voters) it seems fair to lump NE-2 in with the states where Romney is ahead, but by less than 5%. So Romney is ahead in NE-2, but it is close. With my five poll average officially at a 3.8% Romney lead, that does mean though that while close, Florida and North Carolina are both considerably closer. Any situation that includes NE-2 going for Obama is likely to actually be an Obama blowout. Well, with how sparse the polling is, maybe it really isn’t fair to say that. There just isn’t enough data to really place NE-2 well on the spectrum. We have only the vaguest idea what is really going on there. So absent more polls here in the final days, we’ll list NE-2 as the “most likely surprise” in this election. It represents the “closest” electoral vote that hasn’t been polled heavily this year. Anyway, this gives us a slightly different map and summary:
So Obama’s best case improves by 1 electoral vote to a 348 to 190 win. That is a nice win, although still substantially short of his 365 to 173 in 2008. Obama’s best case IS possible, just like Romney’s best case is. It seems like either of those though would require something actually happening in the remaining days of the campaign to move things in that direction, rather than just a continuation of normal campaigning. Maybe Hurricane Sandy? Dunno. We’ll see. Anyway, looking at the close areas again, just to see where we are:
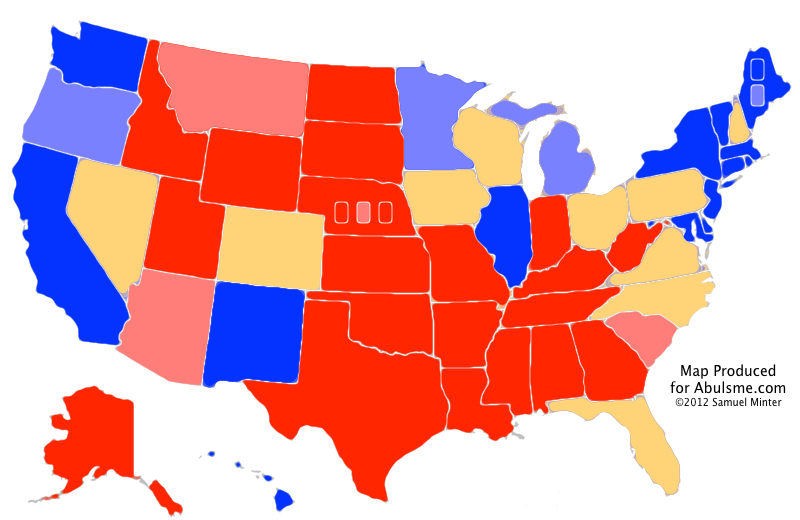
Romney gains a little bit in Ohio, so that state once again is the “tipping point state”. So the percentage Romney has to move every state in order to win is down to 2.0% (from 2.8% yesterday). I mentioned yesterday that I might produce a “spiffy graph” showing the trend in this number… specifically the margin in the tipping point state over time… which can otherwise be thought of as the amount of “uniform movement” across all the close states that would have to happen to flip the winner. Well… I’ve been working on it… it requires pulling some historical data I didn’t explicitly keep track of at the time… but it isn’t quite done yet, and I am rapidly approaching the 00:00 UTC deadline I give myself for the daily updates. So maybe I’ll have that in the NEXT update. Sorry about that kids. In the mean time, suffice it to say that the state of the race remains that Obama has a small but consistent lead in the critical states. If nothing changes, he will most likely win. But Romney remains within striking distance if something happens to move things his direction, or to a degree just if he has a really lucky day with turnout factors on election day. But it is still looking like an Obama win in the electoral college. (With the possibility of a split between that and the popular vote seemingly growing daily.) Note: Chart and map from the Abulsme.com 2012 Electoral College Prediction page. Both assume Obama vs Romney with no strong third party candidate and show polling as it currently exists. Things will change before election day. On the map red is Romney, blue is Obama, gold states are too close to call. Lines on the chart represent how many more electoral votes a candidate would have than is needed to tie under several different scenarios. Up is good for Obama, Down is good for Romney.
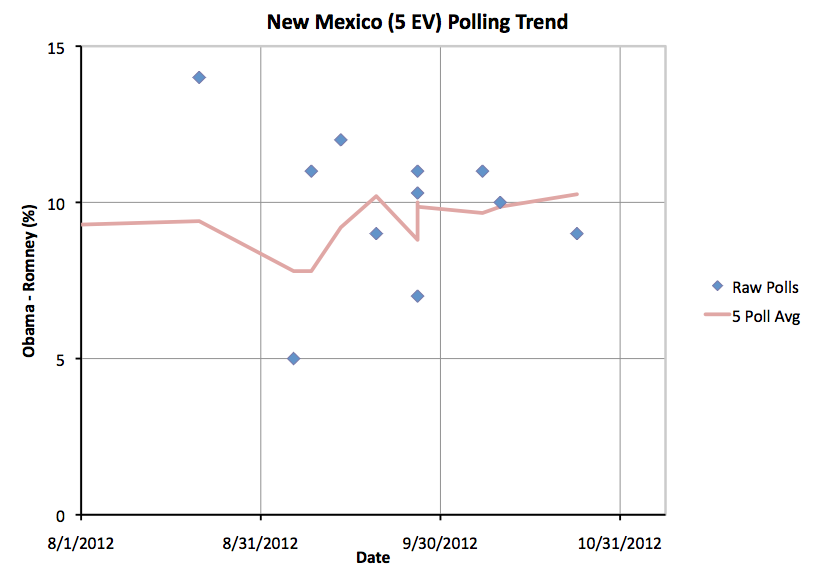
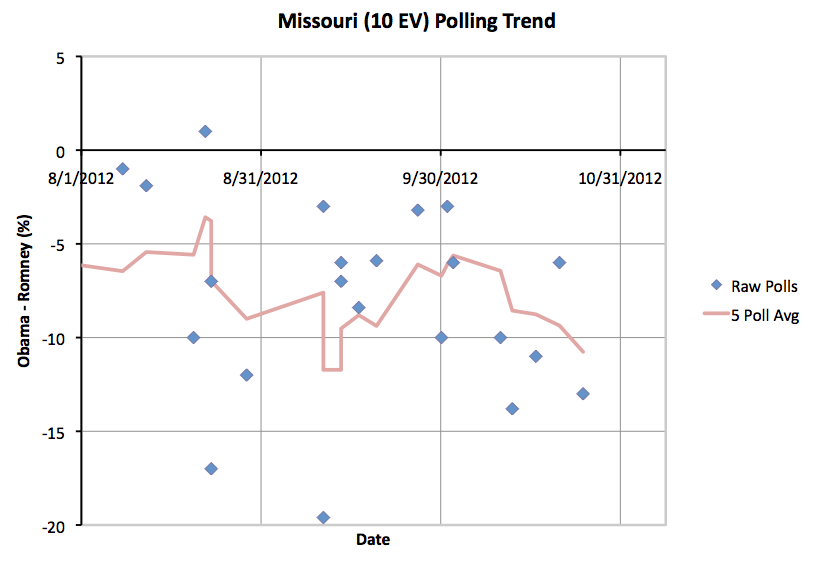
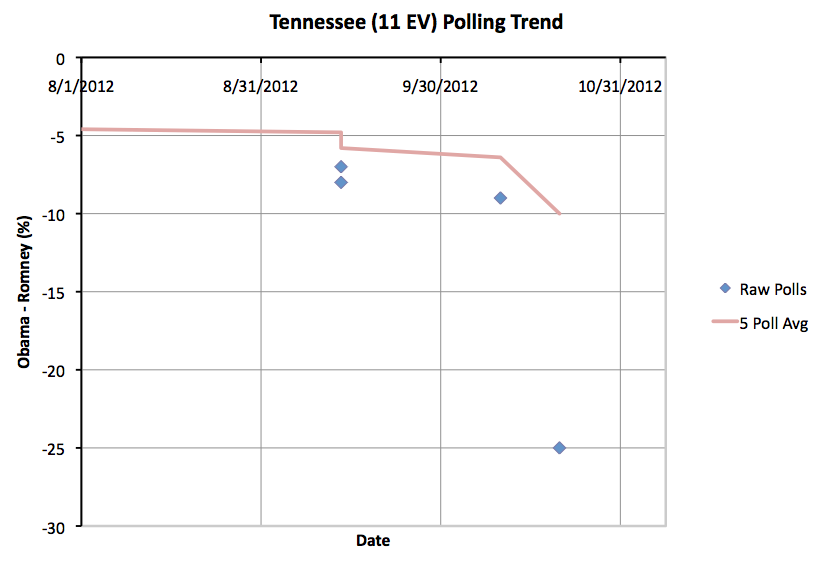
Four states change status today, three moving toward Romney, one moving toward Obama. On the surface this looks very good for Romney. We’ll look into why that might not be the case in a bit, but first lets look at the four states that move today:
Very little to say about New Mexico. Obama’s lead increases slightly and is now over 10%. Obama will win New Mexico.
Not much to see in Missouri either. Romney’s lead increases slightly and is now over 10%. Romney will win Missouri.
Tennessee is a bit odder. The new poll showing a 25% Romney lead in Tennessee looks like an outlier. No other poll in the state from the last year shows a Romney lead greater than 9%. Without this poll the five poll average has a Romney lead of 6.4%. With this, the Romney lead jumps to 10.0%, which moves Tennessee to the “Strong Romney” category. This may not be deserved, but I don’t make judgements about outliers, I just let the average sort it out. Either way, Tennessee’s not in contention this year. Romney will win Tennessee.
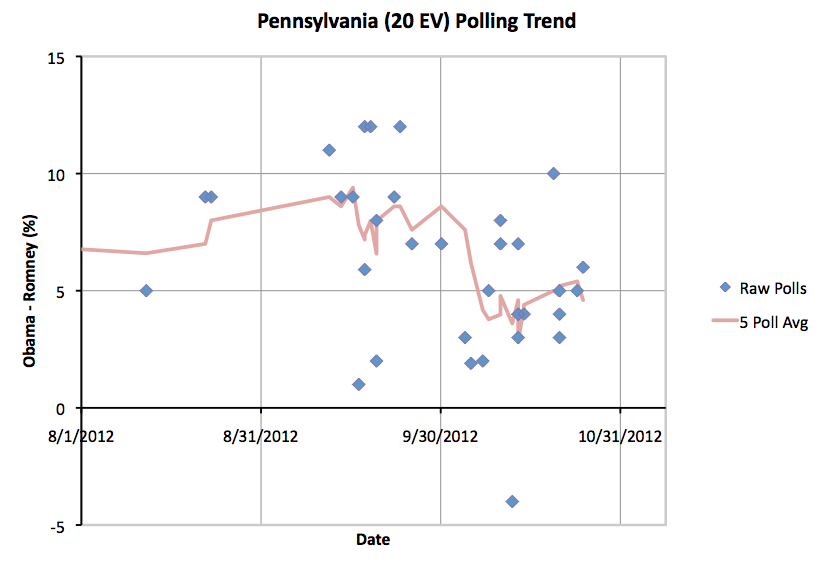
Pennsylvania shows Obama’s lead dropping under 5% again as an outlier showing Obama leading by 10% drops off. Again, we just let the average deal with outliers here, and that is what has happened. Pennsylvania returns to “Lean Obama” which probably better represents the true state of the race in Pennsylvania at the moment. Having said that, it is at the high end, Obama’s lead in the five poll average is now 4.6%. This is a pretty substantial lead. Any scenario that has Romney winning Pennsylvania would already have him wining the presidency handily. OK, so this gives us this new map and summary:
As before though, since depending which way the close states go you could have either candidate winning, we need to look at the individual states:
Something interesting here, but I am running out of time to go into detail. Ohio is no longer the tipping point state! If you start adding these states up in order of how far away they are from Romney, you see that Romney’s clearest path to victory is now holding North Carolina and Florida, then pulling ahead and winning Virginia, Iowa, New Hampshire, Colorado and Nevada. If he does that, he wins 273 to 265. So as of today, if he moves every state more than 2.8% toward him, Romney wins. But yesterday that percentage was 2.5%. Wednesday it was 1.6%. Tuesday it was 1.2% I may make a spiffy graph of this with the next update, but for now just looking at those numbers, you can see that despite moving some states closer to him, Romney’s path to victory is slipping away. The states he needs to pull ahead in are instead slowly pulling away. Note: Chart and map from the Abulsme.com 2012 Electoral College Prediction page. Both assume Obama vs Romney with no strong third party candidate and show polling as it currently exists. Things will change before election day. On the map red is Romney, blue is Obama, gold states are too close to call. Lines on the chart represent how many more electoral votes a candidate would have than is needed to tie under several different scenarios. Up is good for Obama, Down is good for Romney.
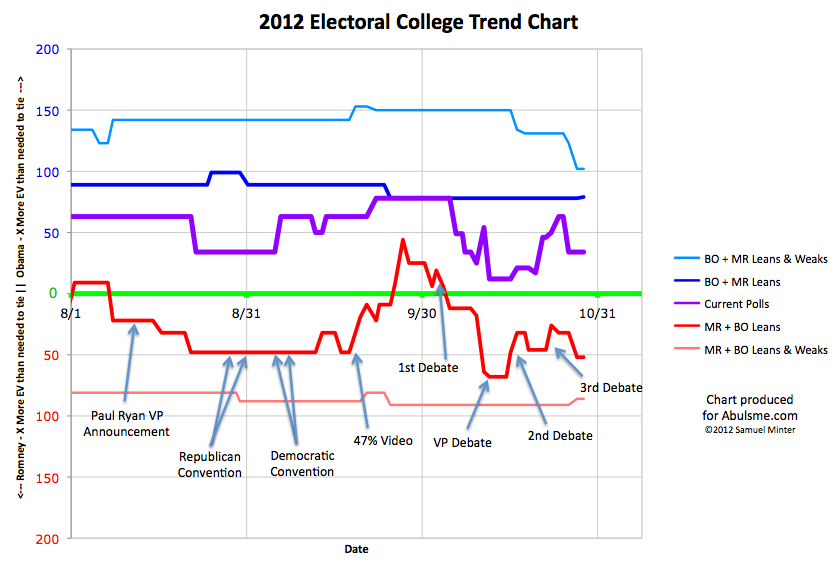
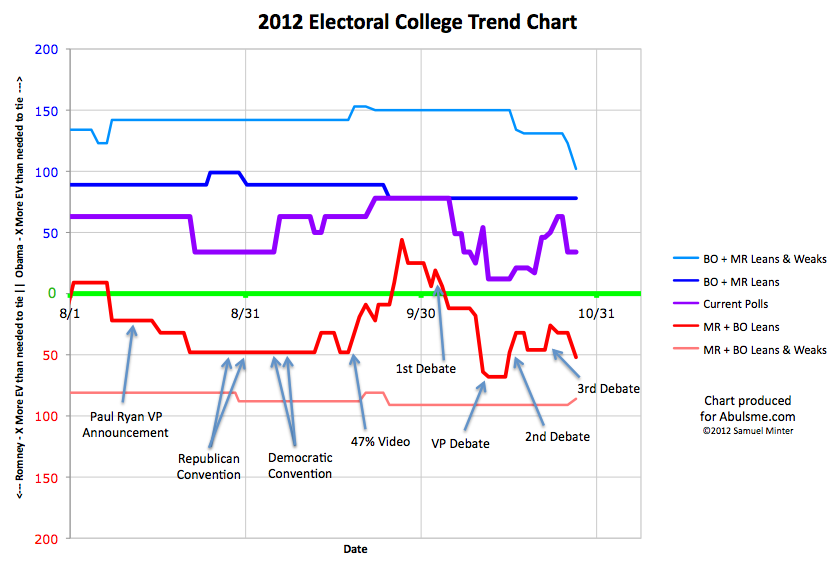
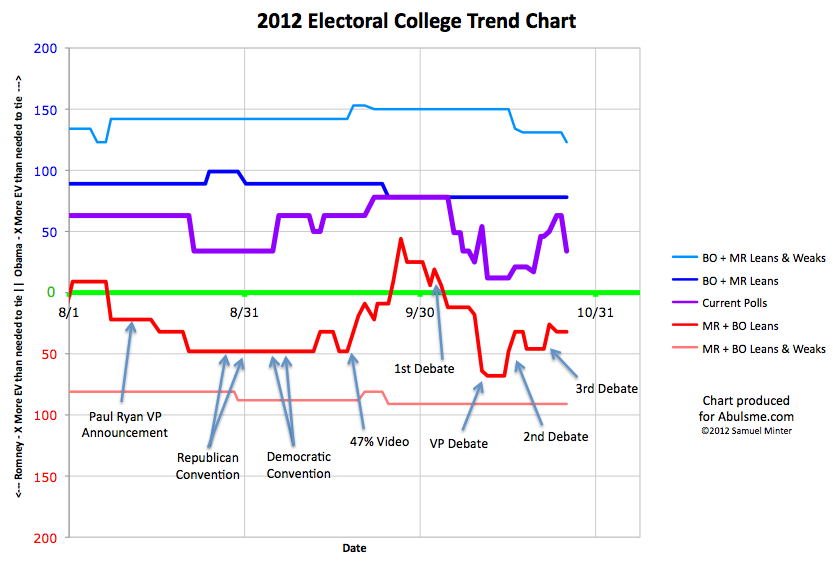
Three states change category today, but before I get to those, let me highlight changes to the chart showing the trend over time. I’ve zoomed in to show only the time period since August and have annotated some of the notable events of the campaign in these last few months. So a few thoughts on what you can see here… First of all, you can easily see that the two events that seem to have the most visible impact are the 47% video and the 1st debate. But it is also clear that Obama’s peak was quite a bit before the first debate. I searched for specific news events around the date of that peak, but I didn’t find anything particularly memorable. So one interpretation is simply that folks who had moved based on the 47% video started to bake that in and think maybe the whole thing was overblown, so movement back toward Romney began. Second, it is pretty clear that Romney peaked between the VP debate and the 2nd presidential debate. Obama began to recover slightly before the 2nd debate. The overall trend has been toward Obama since then. (Even with today’s movement toward Romney on the “Current” line.) Romney’s October peak was beyond his beginning of September high, and therefore higher than I thought it would be. But at this point Romney has still NEVER taken the lead in my analysis. The “Current Poll” line has always shown an Obama lead. Romney has never been ahead in this race. Never. Third, for all but a few short periods of time, Romney’s best case, if he were to win all the swing states, includes winning. Romney can indeed win. It is not out of the realm of reasonable possibility. It is close enough that either campaign events that move things in the last week and a half or just Romney over-performing the polls by a few percent on election day could result in a Romney win. But Obama’s lead is real and persistent, and has been in place all year. If we just have a ho hum continuation of the campaign as it has been straight through election day, then Obama wins. Something has to happen to push Romney into the lead. Obama has to make a big mistake, or Romney has to do something outstanding that is unexpected, or some news event has to make Obama look bad on the eve of the election. Something. With the status quo, Obama wins the electoral college. (As we mentioned Wednesday, the popular vote is another story.) OK, now lets review the states changing categories today:
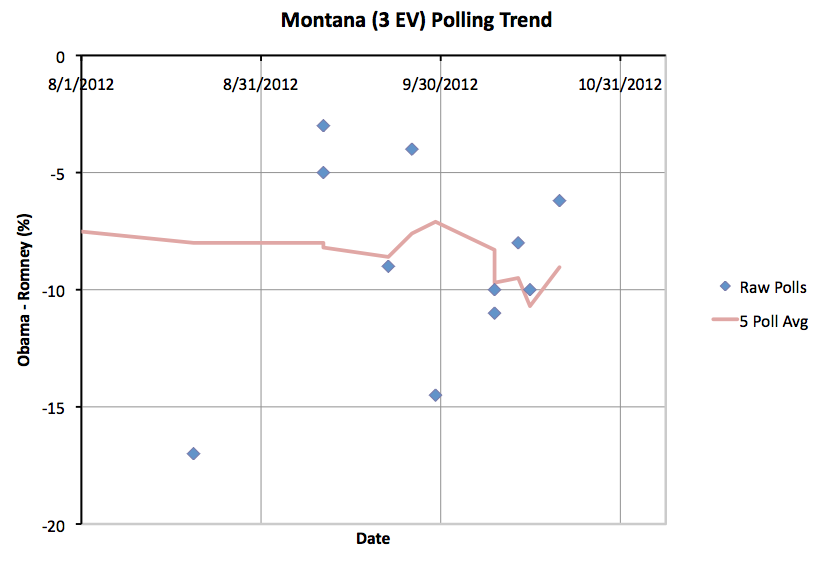
Not much to say here. The five poll average had briefly topped 10% in Montana. Now it drops below that line again. This puts Montana back into the category it has “normally” been in. Romney has a 9.0% lead in Montana. Romney will win Montana. This state is not in contention.
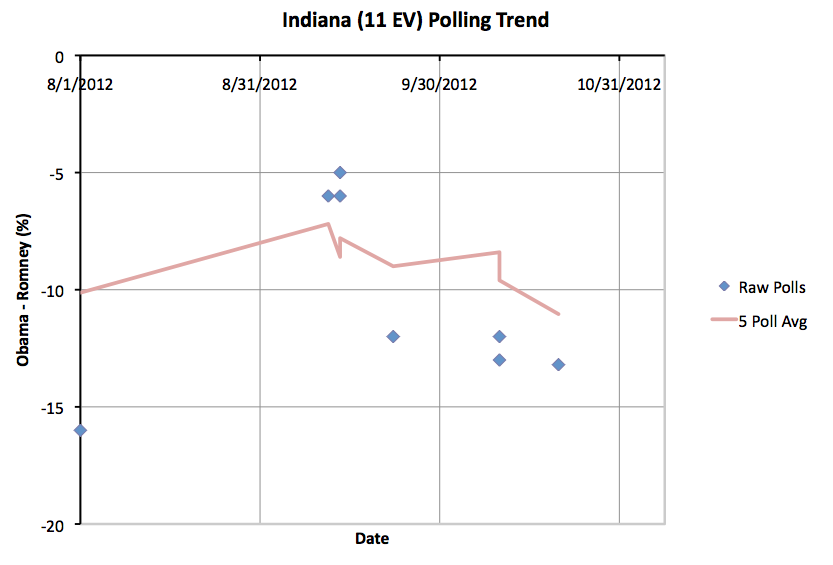
Same kind of thing here. Romney’s lead in the five poll average goes over 10% in Indiana. This is a big move compared to 2008, when Obama won the state by 1.0%, but Indiana has never been close in 2012. It is just an even bigger lead for Romney now. Romney is ahead by 11.0% in Indiana. Romney will win Indiana. Indiana is not in contention.
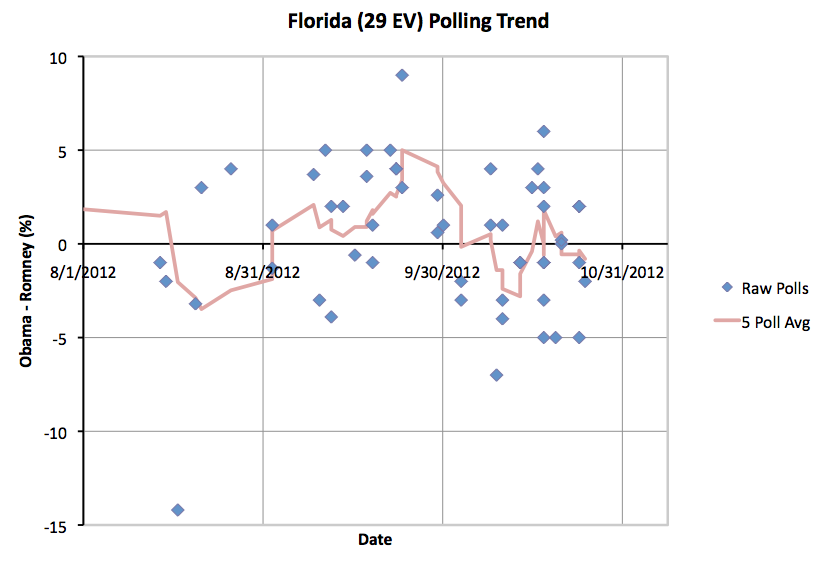
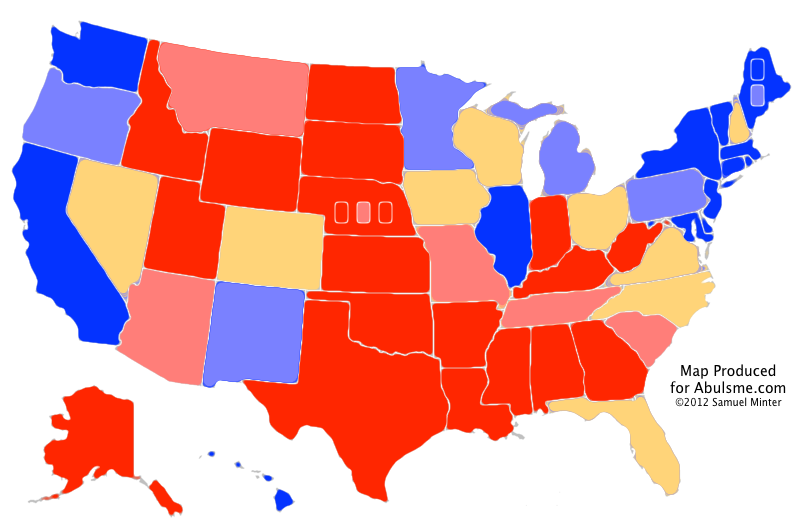
Unlike the others, Florida actually is moving from one candidate’s column to the others. And it is a big state. So this is significant, right? No. Prior to today’s update the five poll average had Obama up by 0.6%. With today’s new data, the five poll average has Romney up by 0.8%. These numbers both reflect the same thing… Florida is too close to call. Florida has moved back and forth across the line many times this year. There has been no significant movement in either direction to indicate that Florida is moving definitively toward one candidate or another. It is close. We’ll know which way Florida goes on election day. So, this gives us a new map and summary:
Once again, since the best cases include both candidates winning, we need to look at the specifics of the close states:
Once again Romney starts at 191 electoral votes with no close states. Add in North Carolina and Florida where he is ahead and he is up to 235. That leaves him 34 electoral votes short. Going in order by how easy it should be for Romney to pull ahead, add in Virginia, Iowa, New Hampshire and Nevada… all of which Romney is behind in at the moment… and you get to 264. Still five electoral votes short. And that brings us once again to Ohio. To win Romney has to get most of the states mentioned previously, but then also win Ohio. (If he wins Ohio, he could afford to lose some combinations of Virginia, Iowa and New Hampshire, but generally speaking if Romney wins Ohio, he will probably win those other states too.) Obama’s lead in Ohio has been increasing. On Tuesday Obama’s lead in Ohio was 1.2%. It is now up to 2.5%. Will that hold? Who knows. But as we get closer to the election, 2.5% starts to morph from looking like a small number, to looking like a large number. In the last year Romney has NEVER been ahead in the five poll average in Ohio. It has usually been close. But Romney has never been ahead. Never. Ohio is indeed looking like a firewall. A uniform move in the polls of any more than 2.5% toward Romney across the close states would give Romney the election. But Romney is running out of time, and most people have made up their minds. This is once again looking like a steep uphill climb for Romney. Not impossible. It could happen. But it is not looking good for Romney. Note: Chart and map from the Abulsme.com 2012 Electoral College Prediction page. Both assume Obama vs Romney with no strong third party candidate and show polling as it currently exists. Things will change before election day. On the map red is Romney, blue is Obama, gold states are too close to call. Lines on the chart represent how many more electoral votes a candidate would have than is needed to tie under several different scenarios. Up is good for Obama, Down is good for Romney. [Edited 2012 Oct 26 23:58 to correct chart of Florida polls over time. While my text was correct, I inadvertently included a chart missing some recent polls. Fixed. I also slightly adjusted some of the arrows on the electoral college trend chart.]
|
||||||||||||||||||||||||||||||||||||||