This is the website of Abulsme Noibatno Itramne (also known as Sam Minter). Posts here are rare these days. For current stuff, follow me on Mastodon

Categories

Calendar

July 2026
S M T W T F S
 1234
567891011
12131415161718
19202122232425
262728293031  

Electoral College: Reversion to the Mean

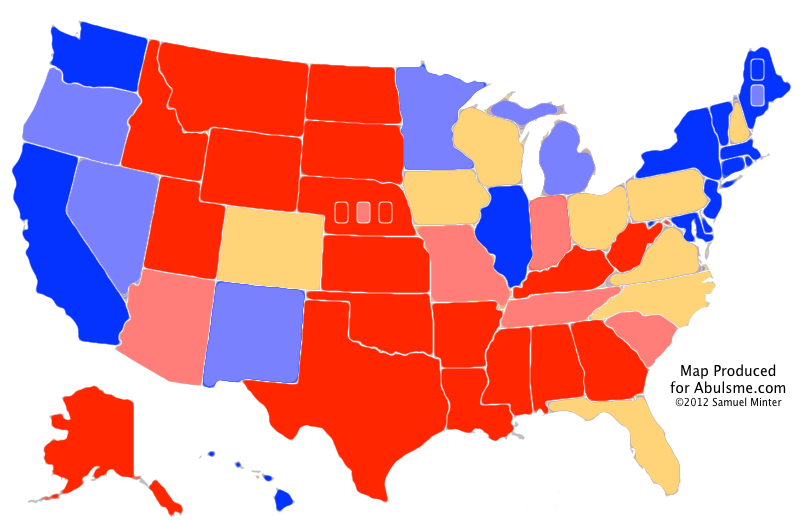
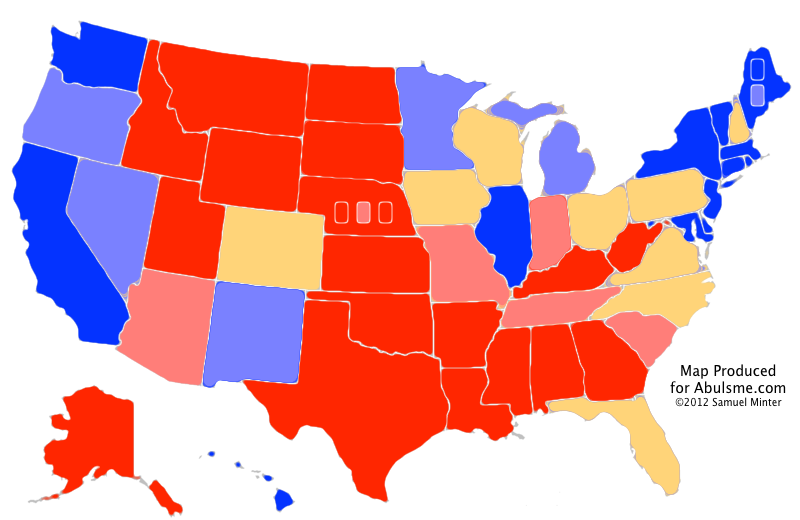
Two states change categories today. One moves toward Obama, the other moves toward Romney. Lets take a look:
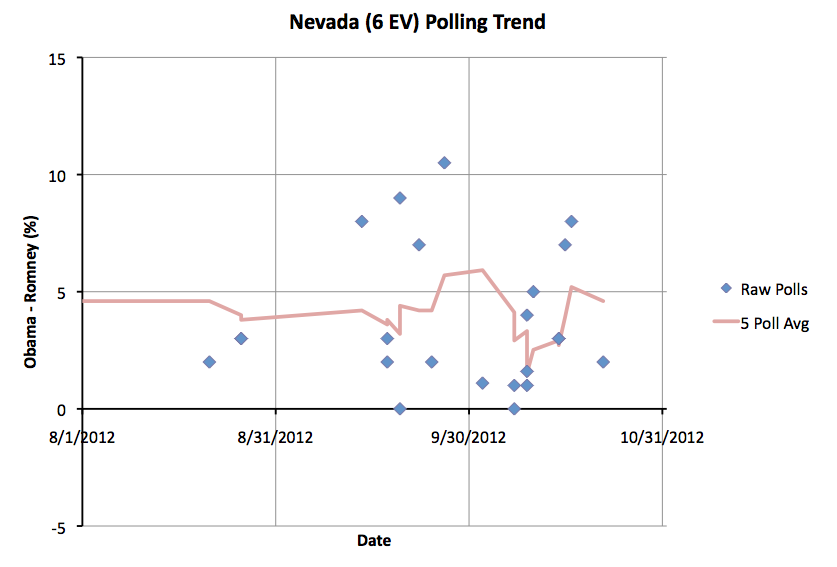
Last Friday the five poll average moved to a 5.2% Obama lead in Nevada. With today’s update, it drops back down to 4.6%. With that I put Nevada back in the list of “Lean Obama” close states. In the last year, Romney has NEVER held a lead in Nevada in the five poll average. Winning Nevada would be a stretch for him. But it is once again somewhat close. There ARE situations you could imagine, even with less than two weeks to go, that would erase Obama’s advantage in Nevada. As we get closer though, a 4.6% lead looks a lot bigger than it might have a month ago.
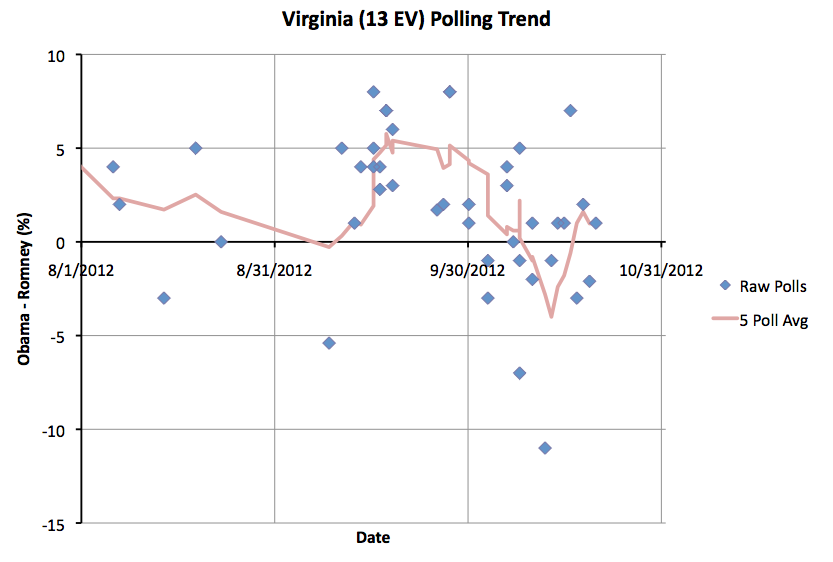
After a brief dip into Romney territory in the middle of October, Virginia returns to where it has been for most of the last year… a small Obama lead. As of now, the five poll average has Obama with a 1.0% lead in Virginia. This moves Virginia back to Obama’s column. The lead is narrow, this could change, but the movement lately has been toward Obama.

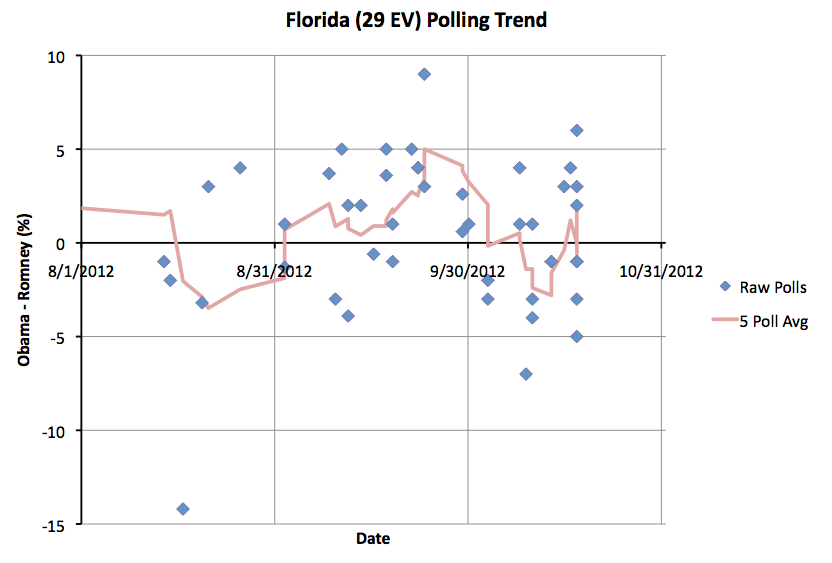
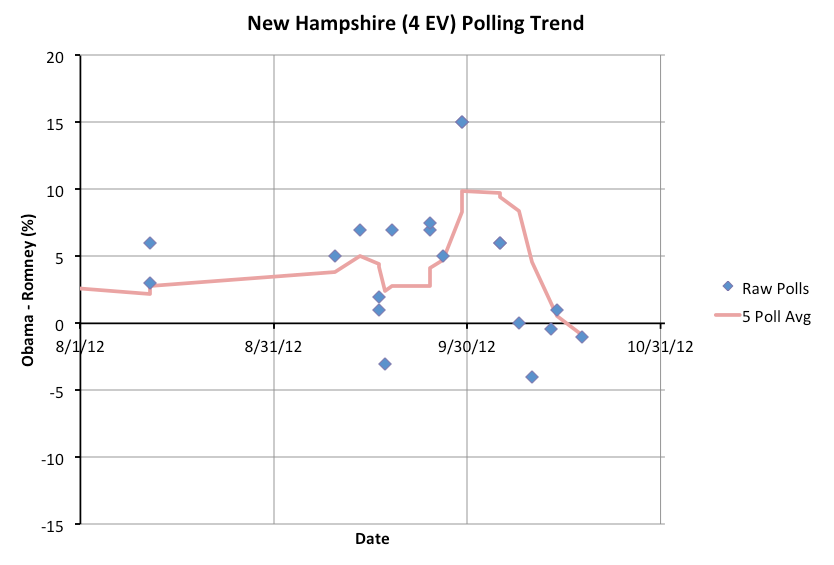
If you look specifically at the state charts such as the two above, this is actually the picture in most of the states that are in contention. You see an Obama decline starting about a week before the first debate, which accelerates into more of an implosion after the first debate. That decline hits bottom sometime between the VP debate and the second presidential debate, and then Obama has been trending upward ever since, but is still quite a long way from his highs at the end of September.

Now where does this put our summary?

Romney Obama
Romney Best Case 301 237
Current Status 206 332
Obama Best Case 191 347

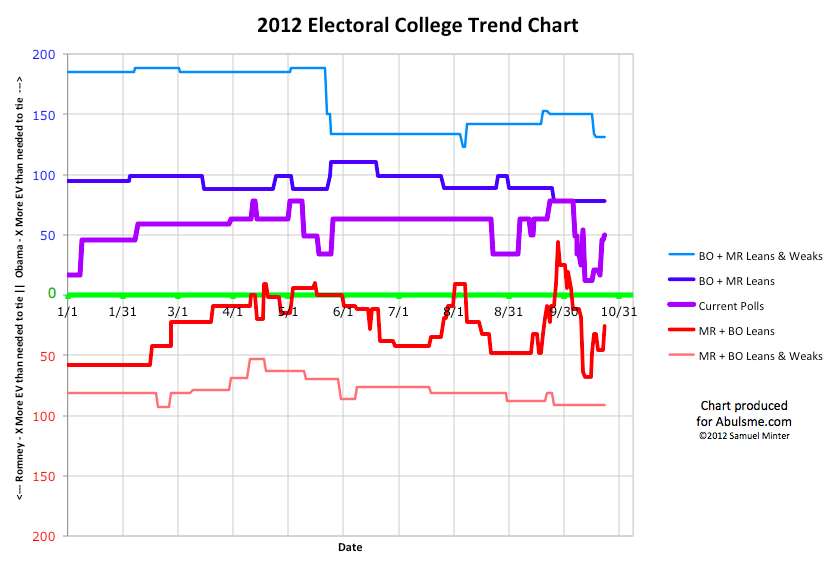
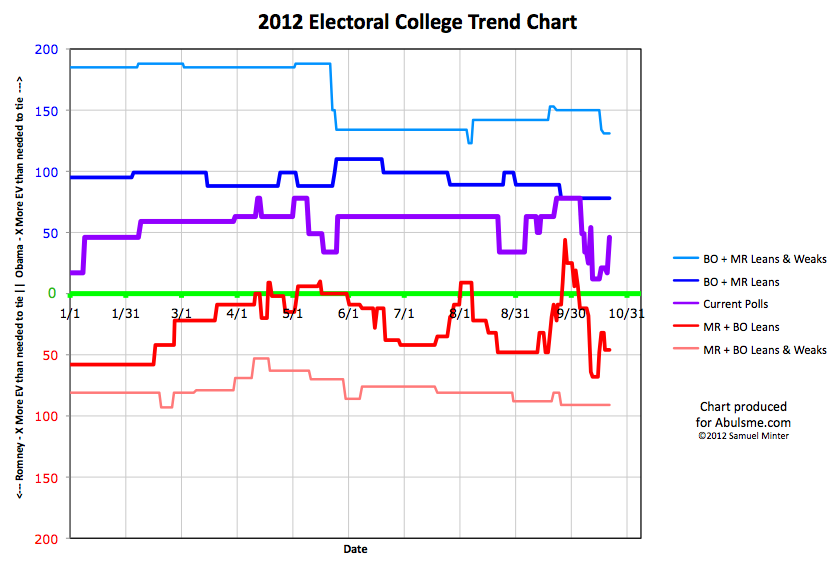
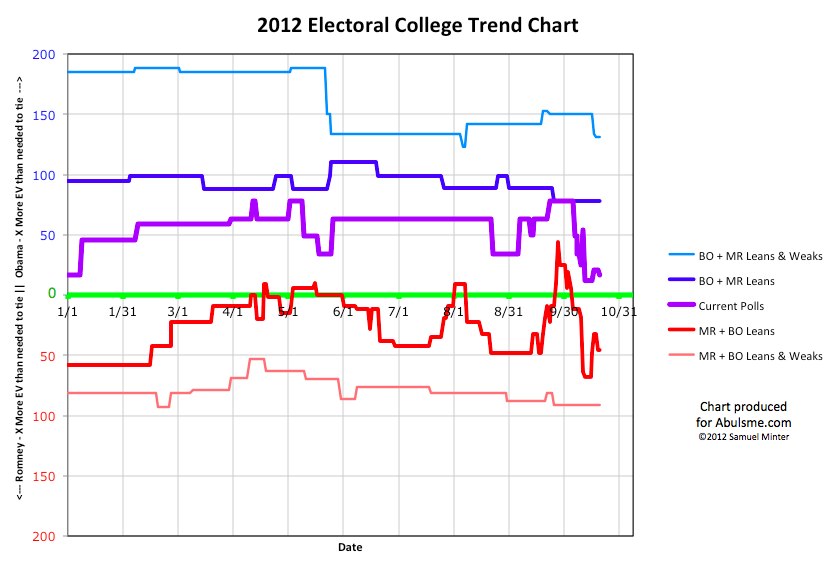
That is right. Our old friend is back. Obama winning by 332 to 206. This is where the “Current” line has been more often than any other position. If you look at the chart showing the history of the race for the entire year you can see that the most time has been spent here, and while there have been occasional movements in both directions away, time after time things have just reverted to 332 to 206. This just seems to be where this race “wants” to be. This seems to be the “mean” that the race always reverts back to after one event or another moves it away.

This looks like a pretty strong position for Obama, right? Romney is only ahead in ONE of the close states at the moment. He has to move several back over to his side to win. This does not look great for Romney.

Well, no, this isn’t great for Romney. His situation is considerably worse than it was right before the second debate. He clearly peaked and is now declining again… at least in terms of the electoral college. There have been some people saying that they are seeing Romney momentum right now. Uh, no.

But… it is still close. Time to look again at the individual close states:

  • North Carolina (15 ev) – 2.0% Romney lead – 0/5 polls after last debate
  • Florida (29 ev) – 0.6% Obama lead – 0/5 polls after last debate
  • Virginia (13 ev) – 1.0% Obama lead – 0/5 polls after last debate
  • New Hampshire (4 ev) – 1.0% Obama lead – 1/5 polls after last debate
  • Colorado (9 ev) – 1.2% Obama lead – 0/5 polls after last debate
  • Ohio (18 ev) – 1.6% Obama lead – 1/5 polls after last debate
  • Iowa (6 ev) – 2.2% Obama lead – 0/5 polls after last debate
  • Wisconsin (10 ev) – 3.5% Obama lead – 0/5 polls after last debate
  • Nevada (6 ev) – 4.6% Obama lead – 0/5 polls after last debate

We still have Romney with 191 electoral votes without any close states. Add in the one close state he is ahead in, North Carolina, and you get to 206 electoral votes. That is 63 electoral votes short. In yesterday’s update if you moved all states toward Romney by more than 1.2%, you would have a Romney win. The tipping point was Ohio. The tipping point is still Ohio.

The easiest way for Romney to win is to hold North Carolina, then pull Florida, Virginia, New Hampshire, Colorado… and Ohio… to his side of the fence. This is looking like a much harder job than it was before. More states are slipping away from Romney… but they are still close… they are not out of reach.

Not as close as they were though. Obama’s lead in Ohio is increasing. It is now 1.6%. But 1.6% is still tiny. You can easily imagine events that would cause a 1.7% or 2.0% move in the polls across all the close states. If Obama pulls ahead by a bit more in Ohio, then maybe we can say he starts to look like a clear winner. But at the moment, it is still close.

Obama is ahead. If the election was held today, he would be the favorite by a decent margin. As of today, FiveThirtyEight has Obama at a 68.1% chance of winning. I’ve seen higher estimates elsewhere, up to 93.4%. My gut says it is somewhere in between. Maybe 80%.

But there is another interesting possibility percolating that I’ll mention before I close. For the last two weeks or so, most of the places doing poll averaging of national polls have shown Romney ahead. I don’t believe ANY of the sites that I track that are doing analysis of the electoral college have shown Romney ahead at any point. Obama has always been ahead.

If this situation persists through election day, we may have a repeat of 2000, but with the parties reversed and the key state being Ohio instead of Florida. Romney wins the popular vote, but Obama wins the electoral college and therefore the presidency.

This kind of situation happens when you have something like Romney building up increasingly large margins in states he was going to win anyway, like Texas. These additional gains make no difference to the electoral college, but they do matter to the electoral vote.

I would find this extremely entertaining for no reason more than being able to watch all kinds of people in both parties suddenly have a completely opposite opinion on the value of the electoral college than they espoused 12 years previously.

This is still not necessarily an expected outcome… FiveThirtyEight puts the odds of the scenario above at 6.5%. (For completeness, they give 1.8% odds to the reverse scenario where Romney wins the electoral college and Obama wins the popular vote.) 6.5% isn’t exactly super likely, but it is nothing to sneeze at. If there was a 6.5% chance of a hurricane hitting your city, you would be starting to make preparations.

Meanwhile though, other analysts put these odds much higher… specifically, Sam Wang puts the chances of this at 25%.

I normally say you can basically ignore the popular vote except as an early indicator to moves in the states… but this is a situation where watching the popular vote is worth it. If we continue to see a popular vote / electoral vote split it will make for a very interesting election night.

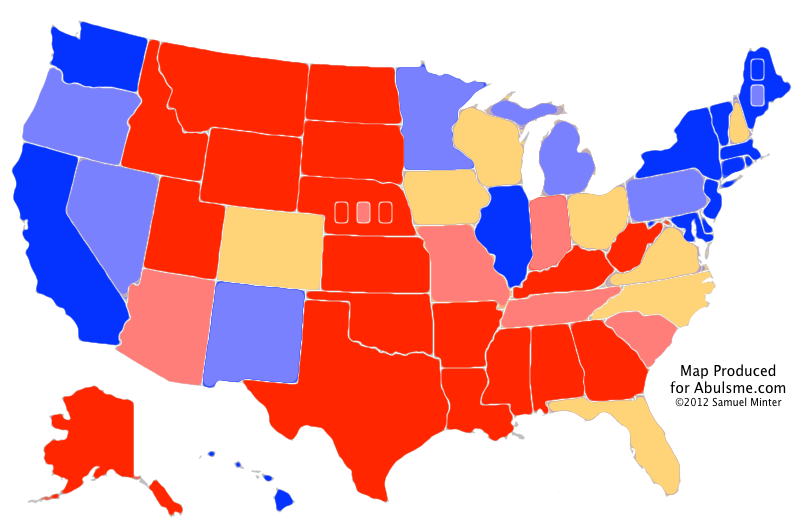
Note: Chart and map from the Abulsme.com 2012 Electoral College Prediction page. Both assume Obama vs Romney with no strong third party candidate and show polling as it currently exists. Things will change before election day. On the map red is Romney, blue is Obama, gold states are too close to call. Lines on the chart represent how many more electoral votes a candidate would have than is needed to tie under several different scenarios. Up is good for Obama, Down is good for Romney.

Edit 2012 Oct 24 18:53 UTC to fix a few wording issues.
@abulsme tweets from 2012-10-23 (UTC)

Electoral College: Obama Rebound Looking Bigger… But Still Tenuous

Two states changing categories today, both moving toward Obama. Both Romney’s “Best Case” line and the “Current” line reflecting the current lead in the polls, have now moved significantly back toward Obama since Romney’s peak around October 12th. These gains are still somewhat tenuous for Obama, which we’ll get into in a bit. For the moment though, lets look at the individual states:

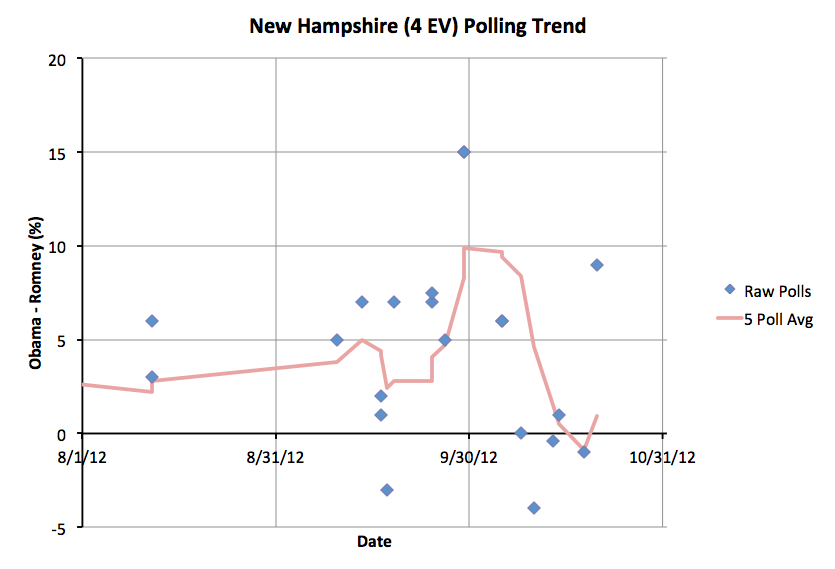
First up New Hampshire. Just three days ago Romney pulled into a slight lead in my five point average in New Hampshire. The very next poll pulls the average back over to Obama’s side of the fence. Having said that, the new poll, showing a 9% Obama lead, looks like it might end up as an outlier. We’ll need more polls to determine if there is real movement, or just noise. Even with that point Obama only has a 0.9% lead. So New Hampshire is still very close. A little on one side of the line versus a little on the other side of the line really doesn’t change all that much.

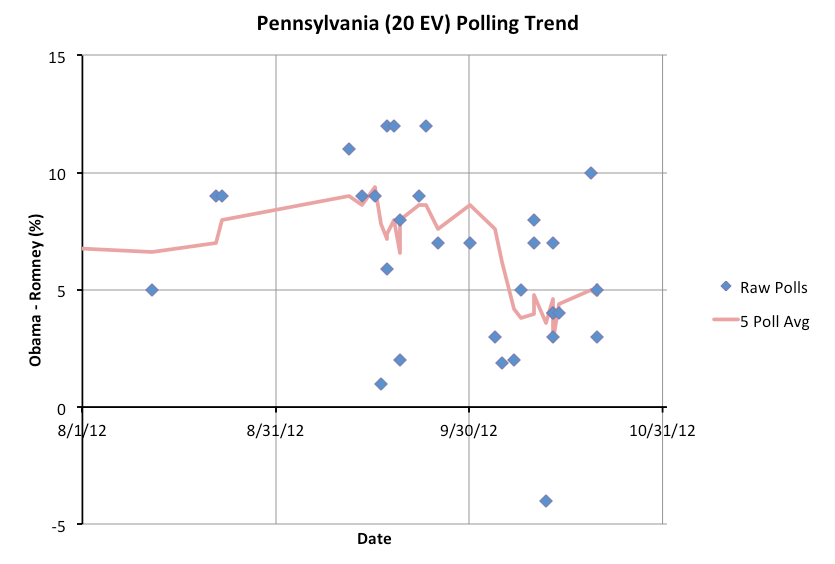
In Pennsylvania a couple of days ago what seemed like an outlier in Romney’s favor aged out of the five poll average. Today it was replaced by what looks like an outlier in Obama’s favor. This is enough to bring Obama’s lead to 5.2% in Pennsylvania. That is enough for me to move Pennsylvania to “Weak Obama” and take out of Romney’s best case scenario. As with New Hampshire’s move, this move is influenced by a poll that smells a little like an outlier. So don’t be surprised if Pennsylvania slips back under the 5% mark as more polls come in.

So where does this put the summary:

Romney Obama
Romney Best Case 295 243
Current Status 219 319
Obama Best Case 191 347

This looks pretty good for Obama, right? He’s building his lead back in, and slowly but surely undoing the damage from that first debate? Just looking at the charts, it looks like on the “current” line, Obama is about half way back to his peak at the end of September. On the “Romney’s best case” Obama’s gained back about a third of his losses. In terms of these numbers, Obama is better off than the spot at the end of August where I had once called a Romney peak.

At that point in time I mentioned that even at that Romney peak, Obama was in a very solid position. Romney would have to flip a whole bunch of states where Obama was ahead in order to win. It was a tall order. Since we’re right there again, so Obama is pretty solid, right?

Right? Well on the surface. But looking at that alone hides a bit. The key is that a lot of the states that are on Obama’s side of the winning line are just BARELY there. So lets look again at all of the close states:

  • North Carolina (15 ev): 2.0% Romney lead
  • Virginia (13 ev): 0.2% Romney lead
  • Florida (29 ev): 0.4% Obama lead
  • New Hampshire (4 ev): 0.9% Obama lead
  • Ohio (18 ev): 1.2% Obama lead
  • Colorado (9 ev): 1.2% Obama lead
  • Iowa (6 ev): 2.2% Obama lead
  • Wisconsin (10 ev): 3.8% Obama lead

My line is always that anything under a 5% lead can easily disappear with essentially no notice. Of the 8 states with margins under 5%, five are actually closer than 2%. Three are closer than 1%! These are a bunch of really close states that really could flip back and forth.

With all the states he is ahead in, Obama wins 319 to 219. That is 50 electoral votes more than he needs to win! But if you just get a 1.3% uniform move in the polls across the close states, then Florida (29 ev), New Hampshire (4 ev), Ohio (18 ev) and Colorado (9 ev) all flip to Romney. That is 60 electoral votes. With that 2% move, Romney wins 279 to 259.

1.3% is not a big move. Obama has the lead. But barely. A stupid statement at a critical time. A random mistake that comes off badly. Some national or international news that just doesn’t reflect well. Changes in enthusiasm that causes Democrats to turn out less than Republicans. Any of those could move things by 1.3%. 1.3% is nothing. 1.3% can evaporate almost instantly if the right things happen.

The movements since the second debate have been mainly in Obama’s direction. Consensus seems to be that Obama also “won” the third debate. After the disaster in the first debate the Obama campaign seems to have hit their stride again. Things seem to be moving in their direction. If that continues for the next two weeks through election day, Obama should end up with a pretty comfortable victory. If things hold steady, or if Romney has a few good news cycles, then we may indeed end up waiting up late on election night to resolve a tight election in Ohio that will determine the outcome of the election.

Note: I finished my daily scan of polls a little over 10 hours prior to making this post, so new polls announced since then will be reflected in tomorrow’s update rather than today’s. I normally try to make the blog post right after finishing the scan on days where states change categories, but this time I just needed to get a little sleep in between. Sorry about that. :-)

Note: Chart and map from the Abulsme.com 2012 Electoral College Prediction page. Both assume Obama vs Romney with no strong third party candidate and show polling as it currently exists. Things will change before election day. On the map red is Romney, blue is Obama, gold states are too close to call. Lines on the chart represent how many more electoral votes a candidate would have than is needed to tie under several different scenarios. Up is good for Obama, Down is good for Romney.

[Edited 2012 Oct 23 22:12 to add final note, fix a wording error, and correct a mistake where I had 2.0% in a place that should have said 1.3%.]

Third Debate

I got stuck in twitter jail about 20 minutes before the end of the debate, and was frustrated by being blocked from more live commentary. Sigh. Oh well.

So a quick bottom line here.

The first half was pretty even, but for the second half Obama won every exchange and got stronger and stronger as the night progressed. Meanwhile, Romney didn’t respond to attacks. He just let them stick and looked upset.

I think on balance Obama won, and by the end was winning pretty strongly, but it wasn’t a blowout like Romney had in the first debate.

In the end though, I’m not sure it will make a huge difference.

Thing is though, Romney needed it to make a difference. The race is very close right now, but Obama is still slightly ahead. Romney needed a big win tonight. Big enough to move polls in his direction. I don’t think he got it. This will either be neutral, or be a positive for Obama.

Perhaps I’m wrong. I was wrong when I said Romney had peaked at the beginning of September, what with not having anticipated a wholesale Obama melt down at the first debate. So we’ll just have to wait and see how things move as we start getting post-debate state polls.

The first general election polls close 14 days, 19 hours and 55 minutes from now.

That will go by really fast…

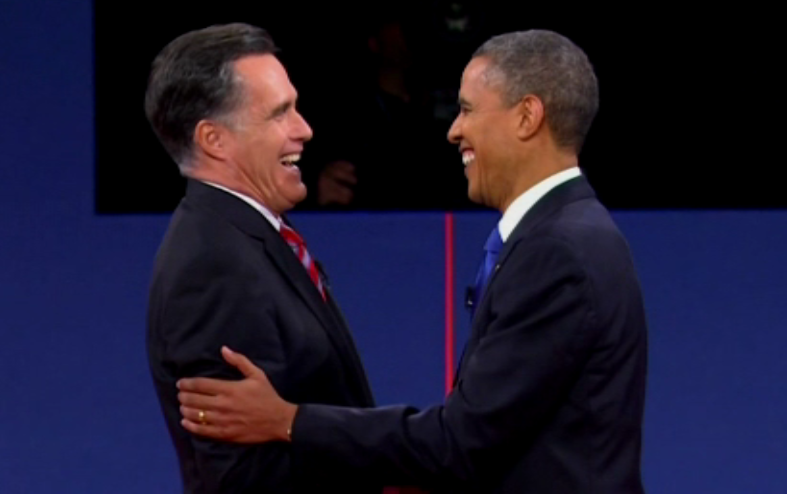
Oh, final note. I like how unlike the other two debates both candidates and their families hung out on the stage and mingled and talked to other for several minutes after the debate. Romney introducing Obama to his grandkids and such was just cute.

@abulsme tweets from 2012-10-22 (UTC)

Curmudgeon’s Corner: Rooting vs Voting

In the latest Curmudgeon’s Corner Sam, Ivan and Bruce talk about:

  • Polling Update / Second Debate
  • Who is Gary Johnson?
  • Third Party Strategy / Electoral College / Weighing Issues

Recorded on 21 Oct 2012

Length this week – 1:02:24

1-Click Subscribe in iTunes Download MP3 File
View Podcast in iTunes View Raw XML Feed

@abulsme tweets from 2012-10-21 (UTC)

Electoral College: Florida Flips to Obama… With Caveats

One change today. It is Florida. It is big. It moves from Leaning Romney to Leaning Obama… but… there are a lot of reasons this move doesn’t represent anything that is actually significant. At least not yet. So lets get into into it:

So, according to my five poll average, Florida moves from an 0.2% Romney lead where it was yesterday, to a 1.8% Obama lead today.

But… there is plenty of oddness here. First off, I do a “last five poll” average, with “last five” based on the end dates of the polls in question. Well, the most recent end date we have for polls is Thursday October 18th. But we are reaching the time in the race where some states get polled a lot… and so in Florida I now have SEVEN polls in my spreadsheet that ended on the 18th. So how do I pick which ones to include in the five poll average?

You could imagine all kinds of tiebreaker criteria, or you could imagine including more than five polls in situations like this. I essentially go with what is simplest for me to process, rather than something that I can justify from a “this is logically the right way to do this because X”, namely, I use the order I found them and added them to my spreadsheet. So the ones I found out about first in my normal daily sweep of sources age out first.

I admit that is kind of questionable and other approaches might be more valid from a theoretical point of view. Some are more complicated, like looking at both the start and end dates of the polls, or looking at the sample sizes of the polls, or things like that. I haven’t been keeping the data necessary to do that, so that would be a bit time intensive. So, what can we look at quickly.

First of all, if we looked at all seven of the polls that ended on the 18th instead of just five of them… We would have an Obama lead of 0.1%.

OK, what if we looked at all of the polls that ended after the second debate (8 polls)… We would have an 0.6% Obama lead.

What about the last 10 polls instead of the last five? Now we would have an 0.7% Obama lead.

What about if we just took any poll ending in the last week? Now we would have an 0.9% Obama lead.

Well, OK, that is interesting, look at that. In all of these cases, we now have Obama leads. So maybe my choice of “last 5” isn’t really that important after all. The trend is indeed moving back toward Obama, and the chart of Florida polls shows that nicely. But…

Another thing to look at… the spread… of the 7 polls that ended on the 18th, we have a range from a 5% Romney lead to a 6% Obama lead. That is quite a spread. The average is slightly on Obama’s side… slightly… but there is a large variance.

And even if there was no oddness with how I choose which polls to include in the average, what do we have here? My straight five poll average gives a 1.8% Obama lead… which is still very very close. That is a sliver of a lead that could disappear with the very next poll.

Bottom line, Florida is too close to call. All of the states in my “Lean” categories could easily go either way, but Florida remains one of the closest.

So, where does this put us:

Romney Obama
Romney Best Case 315 223
Current Status 223 315
Obama Best Case 191 347

I won’t delve into all the details because I’m slightly behind schedule today, but Romney’s easiest path to victory is pull Florida back into his column and then win Ohio. This has been the primary scenario for a little while now. We’re off a bit from Romney’s highs, but Obama hasn’t yet started pulling states firmly back into his column. So this could still go either way.

We’ll start seeing the final view of what this election will look like once the post 3rd debate polls start coming in. By the time we get a full picture on that though, election day will be upon us. And of course early voting has been going on for weeks now. We’re right up against the end now, with Obama remaining a favorite, but by a slim margin.

Note: Chart and map from the Abulsme.com 2012 Electoral College Prediction page. Both assume Obama vs Romney with no strong third party candidate and show polling as it currently exists. Things will change before election day. On the map red is Romney, blue is Obama, gold states are too close to call. Lines on the chart represent how many more electoral votes a candidate would have than is needed to tie under several different scenarios. Up is good for Obama, Down is good for Romney.

@abulsme tweets from 2012-10-20 (UTC)

Electoral College: Obama Rebound Stalled?

One state changes categories today, and it is a move toward Romney:

Romney had a lead in the five poll average in New Hampshire early in the year… back in January and February… but since then Obama has maintained a consistent lead in New Hampshire, sometimes close, sometimes considerable. Until now. After Obama peaked at a 9.9% lead at the end of September, Romney now takes a 0.9% lead in New Hampshire. And yes, for those asking, that does include one out of five polls with an end date after the second presidential debate.

So, new summary:

Romney Obama
Romney Best Case 315 223
Current Status 252 286
Obama Best Case 191 347

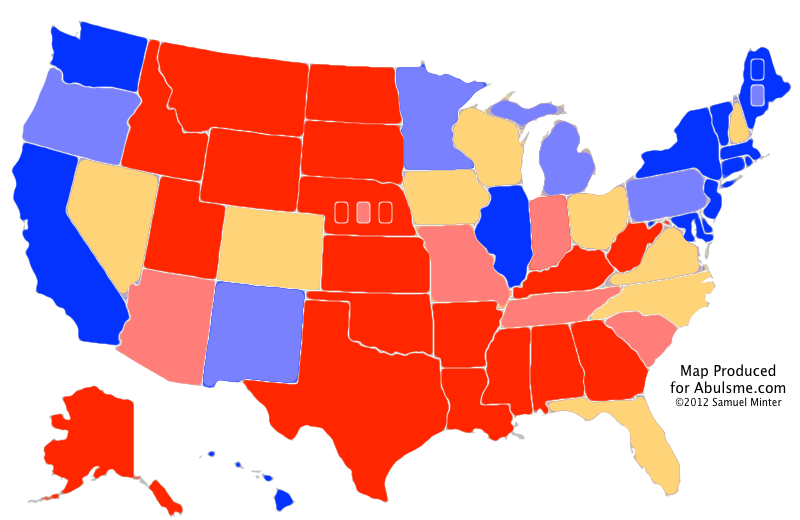
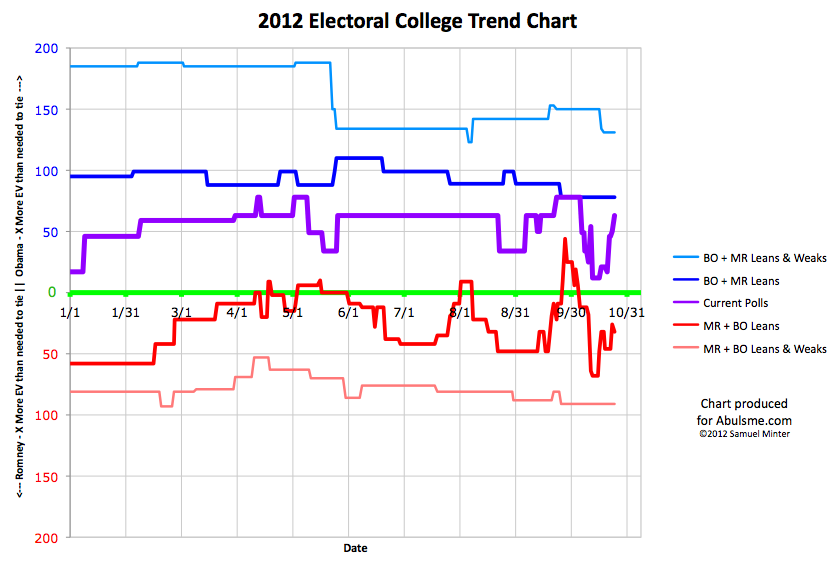
While still not as well off as his peak on October 12th, Romney has been moving some states in his direction the last couple of days. While Obama is still ahead, the race remains extremely close. Today let’s once again look at the state of the five poll average in all of the close states. In order by the strength of Romney’s position:

  • Virginia (13 ev): 2.4% Romney Lead – 2/5 polls after 2nd debate
  • North Carolina (15 ev): 2.0% Romney Lead – 2/5 polls after 2nd debate
  • New Hampshire (4 ev): 0.9% Romney Lead – 1/5 polls after 2nd debate
  • Florida (29 ev): 0.4% Romney Lead – 5/5 polls after 2nd debate
  • Ohio (18 ev): 1.6% Obama Lead – 4/5 polls after 2nd debate
  • Colorado (9 ev): 2.6% Obama Lead – 2/5 polls after 2nd debate
  • Iowa (6 ev): 2.8% Obama Lead – 2/5 polls after 2nd debate
  • Pennsylvania (20 ev): 2.8% Obama Lead – 0/5 polls after 2nd debate
  • Wisconsin (10 ev): 3.1% Obama Lead – 3/5 polls after 2nd debate

With just the states Romney is ahead in by more than 5%, he gets to 191 electoral votes.

Add the four states he is ahead in by margins less than 5%, and he gets up to 252 electoral votes. Those four states are all close. They could slip away. But if Romney holds them, that leaves him 17 electoral votes short of a tie, and 18 electoral votes away from an outright win.

What is the easiest way to get there? Yup… Ohio. Obama is still ahead in Ohio, but by a razor thin margin. And that margin has actually decreased from 2.8% before the 2nd debate to 1.6% now. If Romney pulls ahead in Ohio, that gets him to 270 electoral votes… the bare minimum needed to win outright without throwing it to the House.

I classify all nine of these states as states that could easily go either way. 5% is a margin that can disappear in a day or two with one candidate or another having a bad news cycle. Despite Obama’s razor thin lead at the moment, this really is anybody’s game right now. Obama is one bad day away from actually being behind for the first time.

Obama’s performance in the second debate may have stopped his slide and prevented Romney from taking a definitive lead, but so far at least, we don’t have evidence of Obama pulling ahead in a way that would return him to anything close to his late-September numbers. Instead, we have Obama with a small but real lead, and Romney within striking distance.

Just over 48 hours until the third debate, and then we’re in the final stretch…

Note: Chart and map from the Abulsme.com 2012 Electoral College Prediction page. Both assume Obama vs Romney with no strong third party candidate and show polling as it currently exists. Things will change before election day. On the map red is Romney, blue is Obama, gold states are too close to call. Lines on the chart represent how many more electoral votes a candidate would have than is needed to tie under several different scenarios. Up is good for Obama, Down is good for Romney.