In the latest Curmudgeon’s Corner Sam and Ivan talk about:
Just click to listen now: [wpaudio url=”http://www.abulsme.com/CurmudgeonsCorner/cc20120401.mp3″ text=”Recorded 1 Apr 2012″] or
|
 |
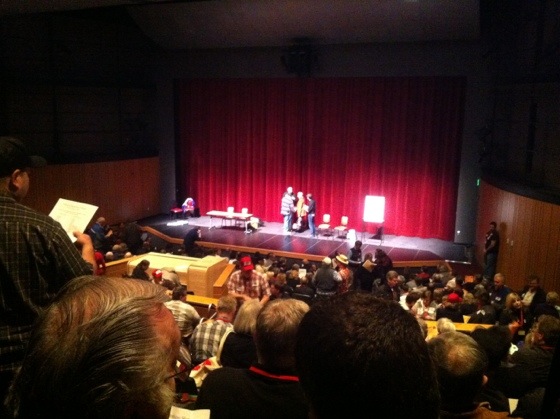
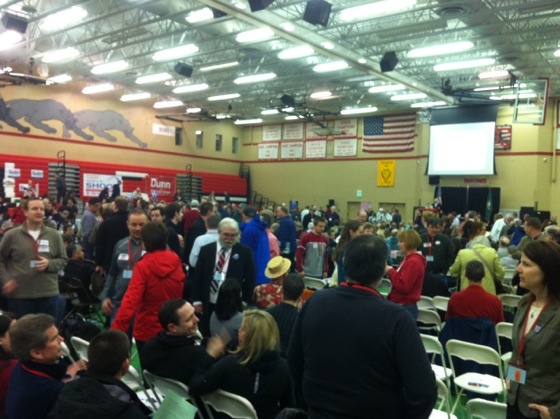
As I did with the Precinct Caucuses on March 3rd, I’ll be attempting to Live Tweet the Snohomish County Republican Convention today. Follow me @Abulsme. For those who remember my tweets on March 3rd only three people showed up for my precinct and given there were three delegate slots available to the county convention, all three of us became delegates to the next level. Although it is non-binding, I had expressed my preference for Ron Paul. (The other two supported Santorum.) Last weekend I attended an orientation meeting for the Ron Paul delegates. For those interested, I talked a little about that meeting on the last episode of Curmudgeon’s Corner. I should have left home already to get all settled at the convention before the crowds arrive. But a few notes before I go… According to the orientation I had last week, in my legislative district, the 44th, almost half of the delegates are Romney supporters, about 25% are Ron Paul Supporters, 15% or so did not have a stated preference, and Santorum and Paul split the rest. There are a little over 260 delegates expected for our LD (I forget the exact number). For anybody to get elected as a delegate to the next level they need more than 50% of the vote of all of the delegates in the LD. This means that if every body shows up and all the Romney folks just vote for each other (and are disciplined and vote for the SAME Romney people), and just a small number of the uncommitted delegates also vote for Romney’s folks, then Romney will end up with 100% of the delegates to the next level, even though he got just under 50% of the delegates from the first round. Meanwhile, if all the Ron Paul folks (for instance) just vote for each other, then none of them gets over 50% of the total vote, and they get no delegates to the next level despite the 25% showing in the first round. Interesting how these things work. For the non-Romney campaigns, the hope is that basically:
It will be fun. Oh, and we’ll get to hear speeches from a ton of local Republican politicians. Woo! Oh, and for the record once again, I am supporting Ron Paul in the Republican caucus process because I think he is the best of the four Republicans currently running. I completely reserve judgement on who I will support in the fall. I’ll think about that once it is completely clear who all the people are on the ballot (not just the Republican and Democrat, which is pretty clear at this point absent some sort of seismic event). OK. Off I go…
Map and chart from the Abulsme.com 2012 Electoral College Prediction page. Both assume Obama vs Romney with no third party strong enough to win states. Lines on the chart represent how many more electoral votes a candidate has than is needed to tie under several different scenarios. Up is good for Obama, Down is good for Romney. So my update today included a new PPP poll in Nebraska. This poll included a breakdown by congressional district, which is useful because Nebraska is one of two states (the other is Maine) which currently have the potential of splitting their electoral college vote. Both states do this with 2 electoral votes going to the statewide winner, then 1 electoral vote for the winner of each congressional district. Thanks PPP for actually doing the CD split!! Anyway, as I was adding the new data points for Nebraska at large and each of the three congressional districts, I noticed the previous data for the 1st and 2nd congressional districts included some errors. (Specifically the 2008 Republican and Democratic results were reversed… I use the 2004 and 2008 elections to seed the numbers for states that have had less than five actual Obama vs Romney polls.) The end result of this was that the 1st district had been classified as Weak Romney when it should have been Strong Romney, and the 2nd district was classified as Strong Romney when it should have been Weak Romney. I corrected this and the new poll results didn’t change the classifications again. The net result of this is just that on the map I had the wrong one of the three boxes in Nebraska light red. It should have been the 2nd box instead of the 1st. This has now been corrected. Since both districts are one electoral vote and the changes balanced each other, the lines on the graph do not change at all. The summary remains:
Note 2012 May 23 10:43 UTC: Due to an error in my spreadsheet, a change in status for Wisconsin from Weak Obama to Strong Obama that should have been noted on this update on March 30th, was prematurely made on March 2nd. The corrected time series chart can be seen starting with the May 23rd update. Thanks to Darryl at HorsesAss for finding the mistake. Note 2012 Jun 16 21:22 UTC: Actually, with more information, the Wisconsin transition should have happened on March 31st. See the correction on the June 19th update.
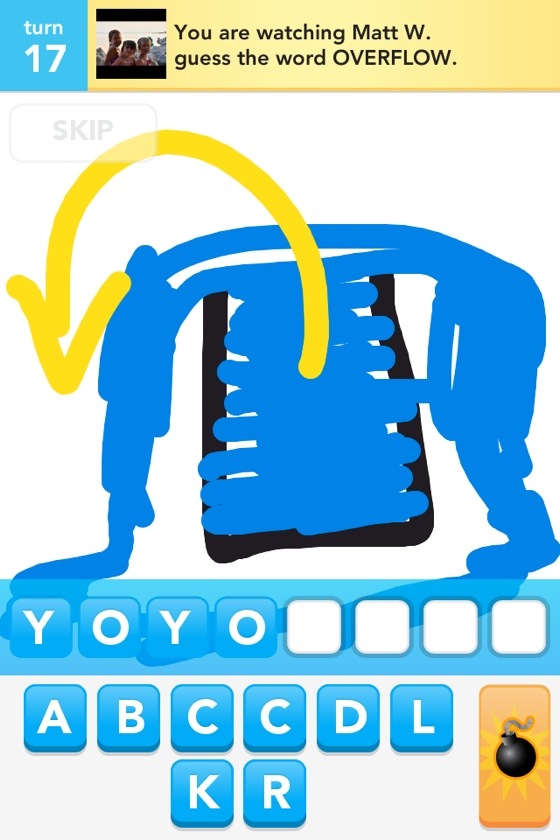
Something is a little off in the world of Draw Something this last round… |
||||||||||||||