This is the website of Abulsme Noibatno Itramne (also known as Sam Minter). Posts here are rare these days. For current stuff, follow me on Mastodon

Categories

Calendar

July 2026
S M T W T F S
 1234
567891011
12131415161718
19202122232425
262728293031  

Republicans: Trump Clinches the Republican Nomination

The Election Graphs delegate estimate now has Trump at 1238, one more than he needed to clinch the nomination.

AP announced that Trump had exceeded 1237 by their count on Thursday. They had canvassed the remaining uncommitted delegates who had not expressed a public preference, and found enough of them to put Trump over the top. When AP does this sort of thing, they don’t generally release their full list of delegates though, so it was hard to confirm this independently. But Election Graphs was able to spend a few hours Friday night digging through various sources to look for more specific information on specific uncommitted delegates, and we were also able to get Trump over the top.*

He will of course get even more delegates on June 7th, but he doesn’t need them. Absent a catastrophic unexpected event, Trump will be the Republican nominee for President in 2016.

The final “% of remaining delegates needed to win” chart looks like this:
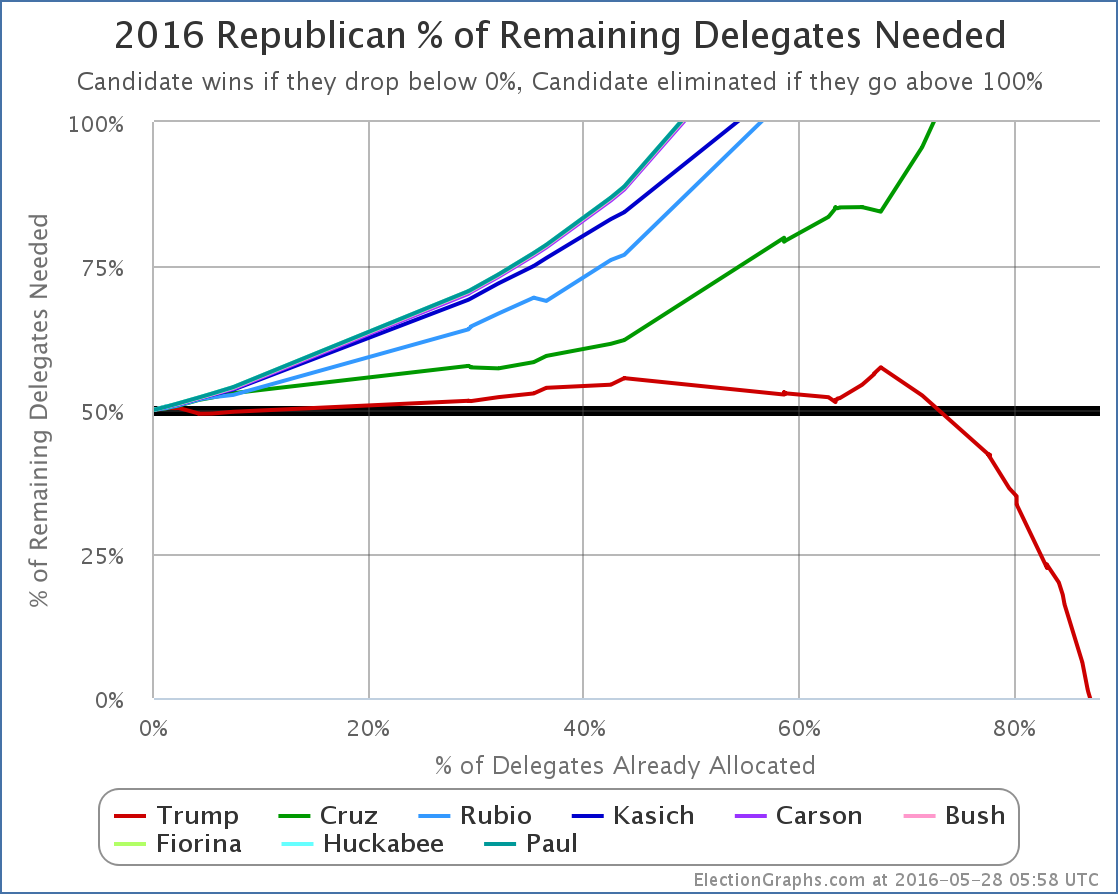
chart-153

Trump hovered just over 50% for most of the race, but essentially as soon as Cruz was mathematically eliminated, Trump dropped below 50% needed, and rapidly raced to the conclusion. This was of course aided by Cruz and Kasich dropping out, but even if they hadn’t, the writing was on the wall. It would have taken a huge effort with a groundswell of popular support for his opponents to prevent Trump from getting to 1237 at that point, and it was obvious that neither the political will, or the voters for Cruz or Kasich were there. And so it ended.
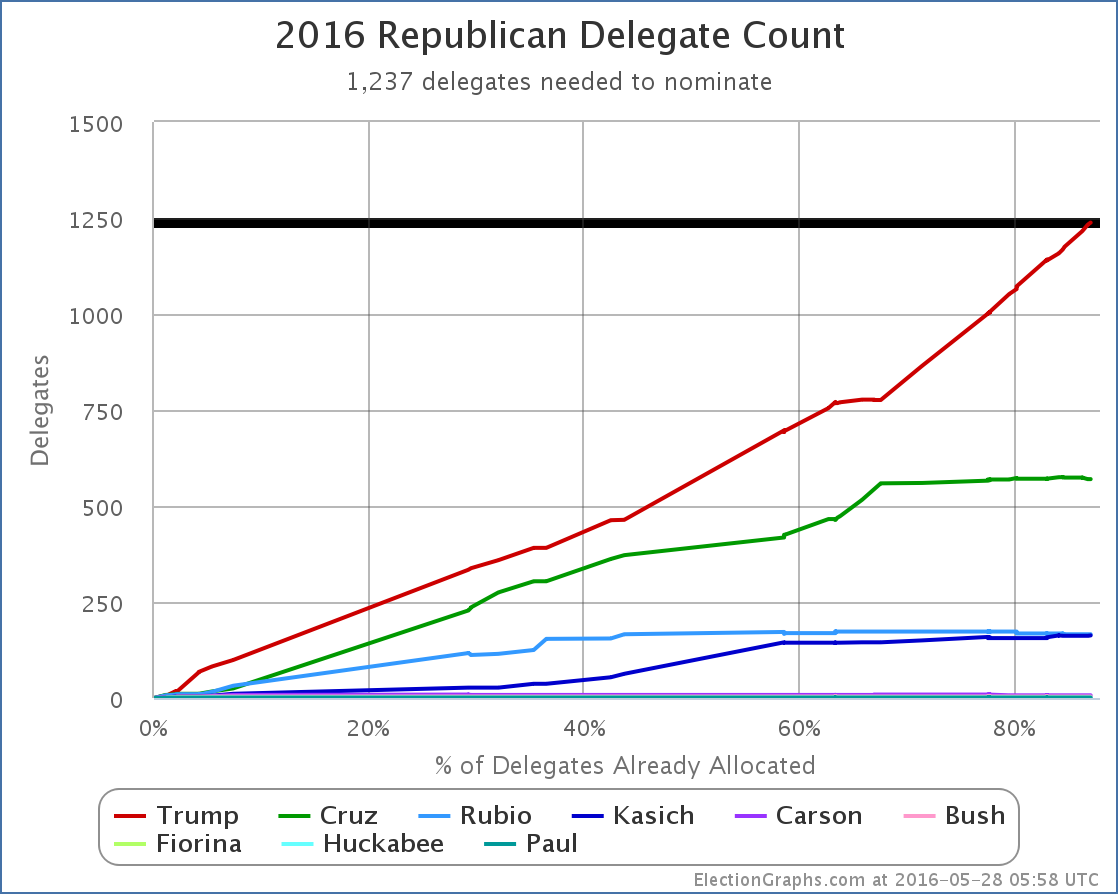
chart-154

At this point the delegate count is Trump 1238, Cruz 570, Rubio 166, Kasich 163, Carson 7, Bush 4, Fiorina 1, Huckabee 1, Paul 1.

Trump will of course collect more before things are done. There is a chance others may pick up a handful too, but if they do it will be insignificant, and it is quite possible Trump will sweep the remaining delegates.
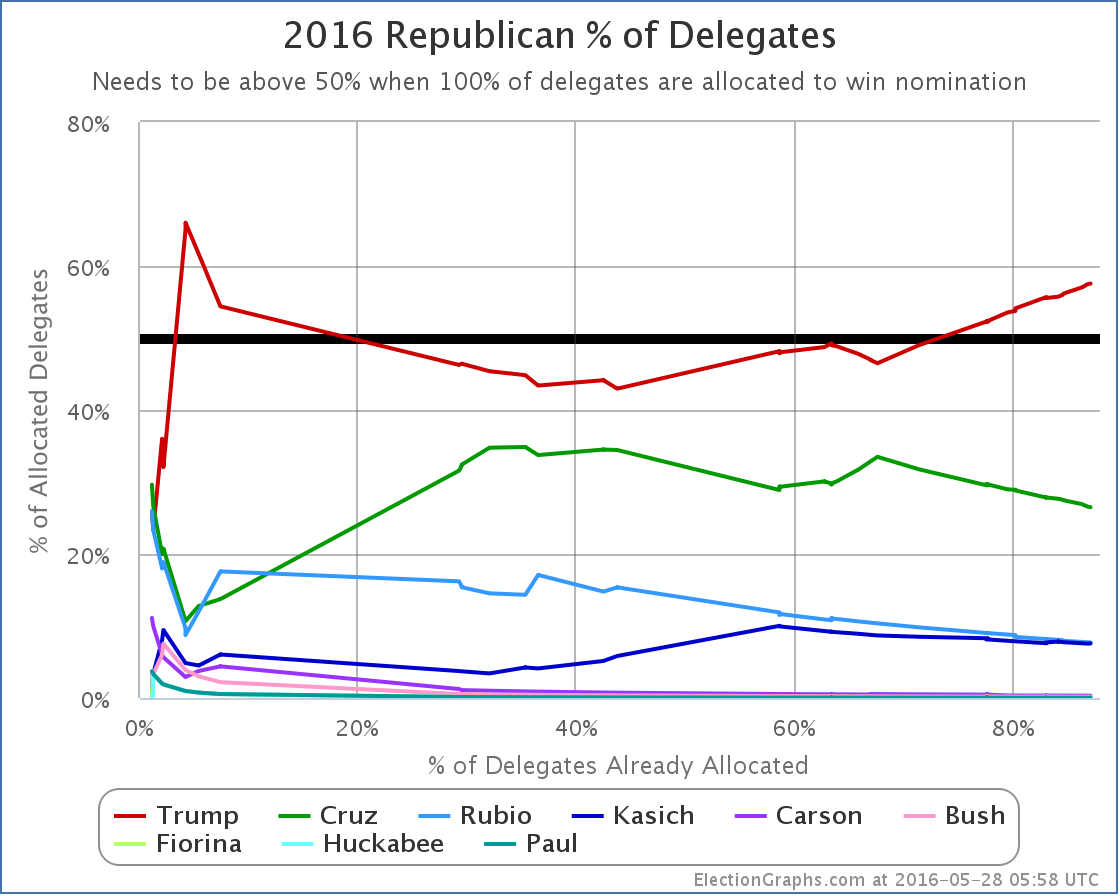
chart-155

At this point Trump has 57.55% of the delegates. Cruz was next at 26.50%. Trump’s percentage will increase before we are done with all the delegate allocation.

Election Graphs will continue to monitor the delegate totals from the last few races for completeness, but for all intents and purposes the Republican race is now done. This has been the craziest oddball primary race in many decades. It has been fascinating to watch it play out.

Trump led from New Hampshire onward. From that point forward nobody ever came close. Until we got to the Northeast states though, the others were getting a high enough percentage to keep the possibility of blocking him alive, with the odds of Trump not getting to 1237 as high as 36% as late as April 18th according to the best simulations. (My gut feel had it higher, at 60%, but the numeric simulations were a better guide.) Now, that still meant Trump was probably going to get to 1237, but there was a decent shot at stopping it.

But then the anti-Trump forces essentially collapsed and gave up. It is just too hard to make the case that people should vote for you in order to help stop someone else, even after it is very clear you can’t win yourself. In my Curmudgeon’s Corner 2016 predictions show I essentially predicted exactly that. But in the heated days of March and April, I allowed myself to get a little too excited about the news nerd’s dream of a contested convention, as did a lot of people looking at the race. In the end though, it is really hard to stop someone who has led from beginning to end.

And so we have Trump.

It has been a lot of fun watching this primary process play out. The Democratic side should be winding up very shortly as well.

And then it is full speed ahead to the general election. If you have enjoyed my coverage of the Republican delegate race, I hope you’ll stay around for the Electoral College analysis.

164.7 days until polls start to close on the general election. The next few months will be quite a ride. Stay tuned!

* For those who want the specifics, in the last few days there were updates to the preferences from uncommitted delegates in North Dakota, Oklahoma, Colorado, Pennsylvania, the Virgin Islands, and Louisiana. Added up, the net change was Trump +23, Kasich +1, Cruz -3.

Update 2016-05-30 16:44 UTC – Change from Colorado: Trump +1, Cruz -1.

Update 2016-06-03 14:40 UTC – Change from Oregon: Trump -1, Kasich +1.

Note: This post is an update based on the data on ElectionGraphs.com. Election Graphs tracks both a poll based estimate of the Electoral College and a numbers based look at the Delegate Races. All of the charts and graphs seen in this post are from that site. Additional graphs, charts and raw data can be found there. All charts above are clickable to go to the current version of the detail page the chart is from, which may contain more up to date information than the snapshots on this page, which were current as of the time of this post. Follow @ElectionGraphs on Twitter or like Election Graphs on Facebook to see announcements of updates or to join the conversation. For those interested in individual general election poll updates, follow @ElecCollPolls on Twitter for all the polls as they are added.

Edit 14:00 UTC to add the * with the delegate changes from the last few days.

Edit 2016-06-04 04:04 UTC to fix the title from Electoral College to Republicans. Sigh.

@ElectionGraphs tweets from 2016-05-27 (UTC)

Curmudgeon’s Corner: All Kinds of Blinking Stuff

This week on Curmudgeon’s Corner Sam and Ivan are back into the swing of things with most of the show covering Election 2016. What does Sanders want at this point? What about that Trump surge in the polls? How about all the other Trump stuff this week? But they cover a few other things too, from Sam’s latest travel adventures, to bathroom laws, to the EgyptAir crash, to Obama in Hiroshima, and more.

Click below to listen or subscribe… then let us know your own thoughts!

CCCover20151125bw
Recorded 2016-05-26

Length this week – 2:01:45

1-Click Subscribe in iTunes
View Podcast in iTunes
View Raw Podcast Feed
Download MP3 File
Follow the podcast on Facebook

Show Details:

  • (0:00:10-0:23:40) But First
    • Sam Travel
    • Agenda
    • Computer Upgrades
    • Changing Buildings
  • (0:24:25-0:45:17) Interview Show Followup
    • Missing Views
    • Ivan confused by Michael from Pennsylvania
    • Fiscally Conservative Republicans?
  • (0:46:26-1:02:49) Election 2016 – Democrats
    • What does Sanders want? – Platform
    • What does Sanders want? – Relevance
    • What does Sanders want? – DWS’s Head
    • What does Sanders want? – Rules changes
    • When does Sanders fold?
  • (1:03:53-1:31:24) Election 2016 – Republicans
    • Trump surge in national polls
    • Trump/Ryan dance
    • Trump Supreme Court List
    • Trump and 90’s Clinton Scandals
    • Anti-Trump Strategies
    • Trump’s Odds
  • (1:32:39-2:01:25) Lightning Round
    • Clinton’s Email
    • Election Graphs Commenters
    • Bathroom Laws
    • Violent Protestors
    • EgyptAir Plane
    • Obama Hiroshima Visit
    • Thiel vs Gawker
    • 1000 likes for Election Graphs

@abulsme tweets from 2016-05-27 (UTC)

Electoral College: Trump Rebound Continues

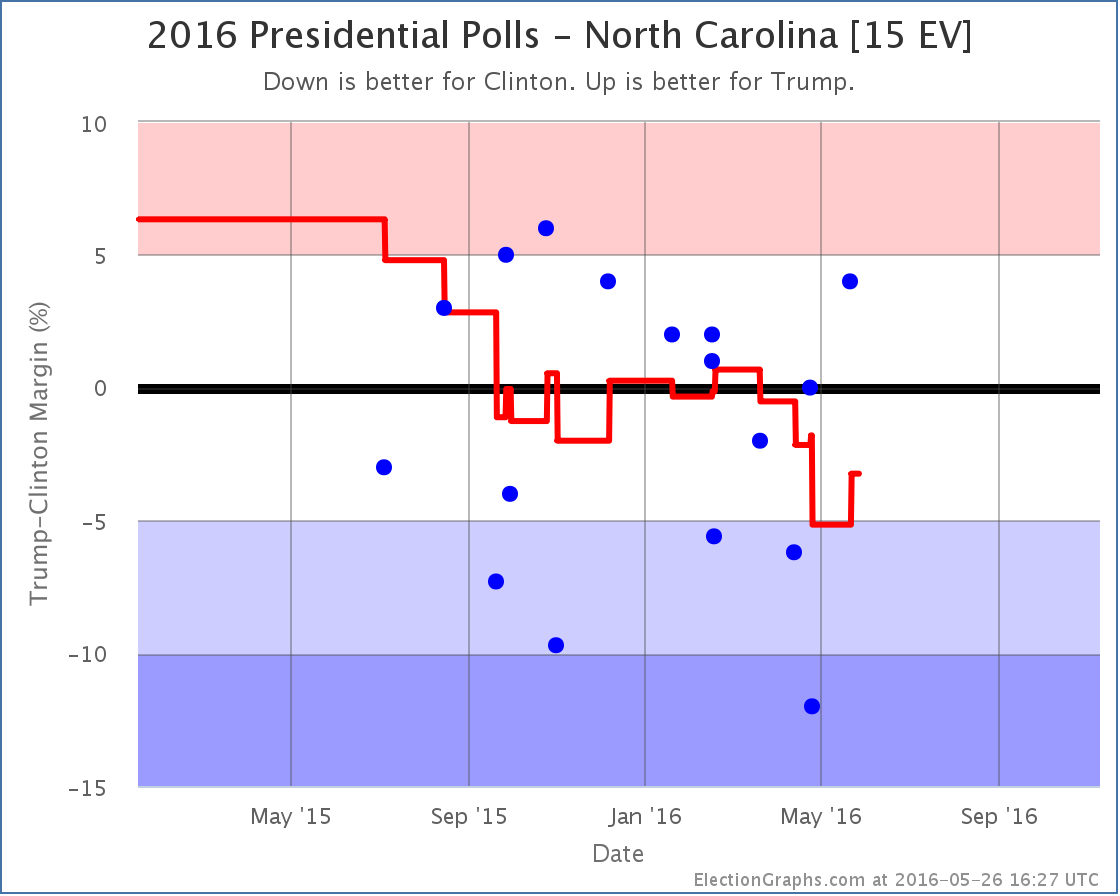
Now that the nominees are essentially certain, state level general election polling is ramping up quickly. It has only been a few days since the last update to my electoral college models, but there have already been polls in New Jersey, Virginia, North Carolina, California, Ohio, and Wisconsin. But of these, it was the new poll in North Carolina that made a difference.

chart-150

Trump gets his best individual poll result in North Carolina since last December, and the poll average moves from a Clinton lead of 5.2% to a Clinton lead of only 3.2%. With North Carolina once again within reach, Trump’s best case improves:

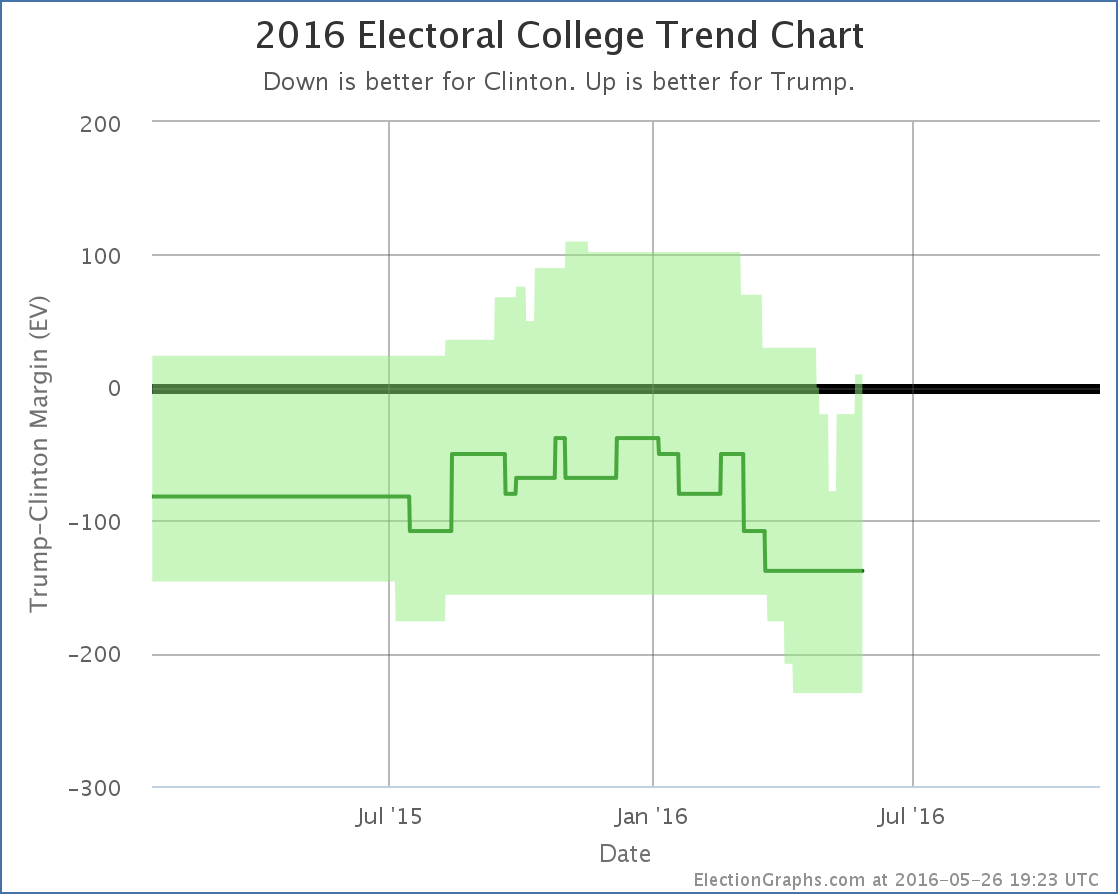
chart-151

Now if Trump wins all the states he leads, plus all the states where Clinton’s lead is less than 5%, he squeaks out a 10 electoral vote win. Between this and Florida, this puts him back on the plus side for his “best case” after just under a month where even this rosy scenario was underwater for him.

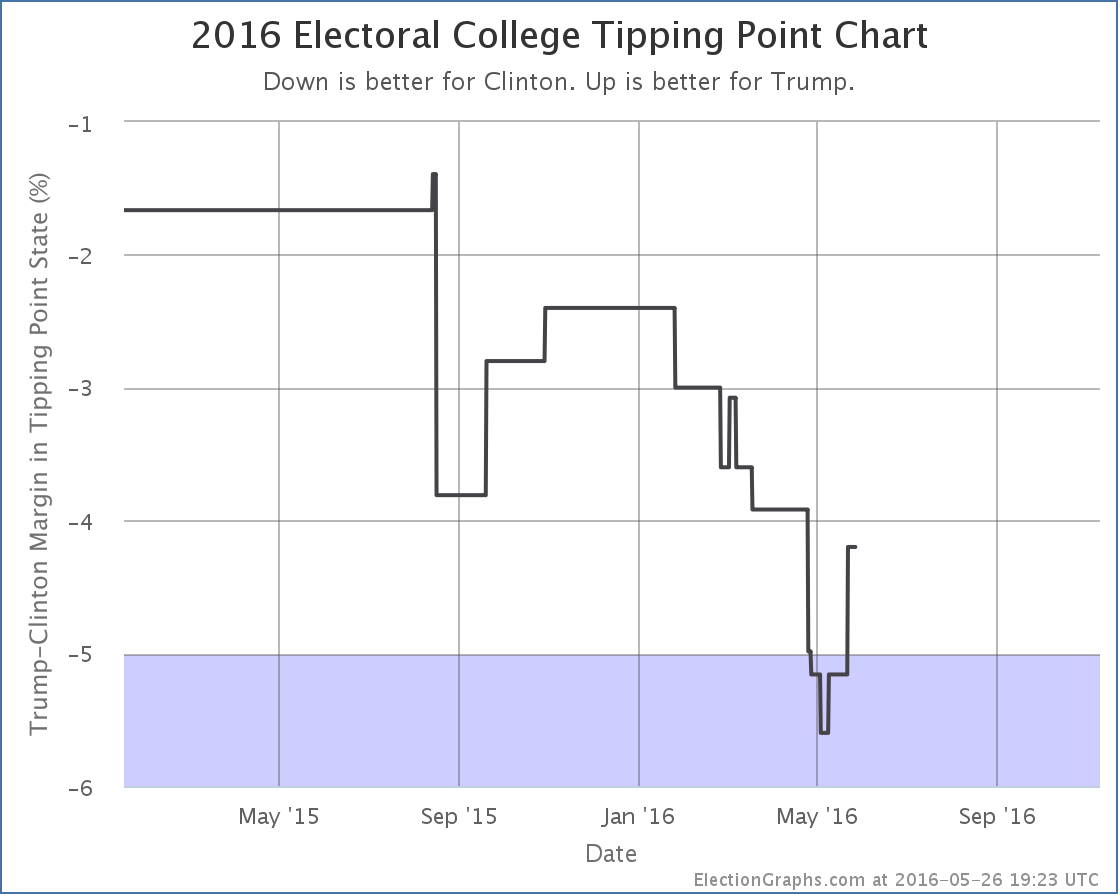
Since North Carolina had been the tipping point, that metric also moves:

chart-152

The tipping point state is now Florida, where Clinton leads by 4.2%.

From January to the beginning of May, there were 12 changes to the “bubble” and 8 changes to the tipping point. Only one of each category was in Trump’s direction. Overwhelmingly those months were a story of Trump’s position against Clinton deteriorating.

Since then we have two bubble changes and two tipping point changes, but all four have been moves in Trump’s direction. It is certainly looking like Trump hit bottom and is now bouncing back. The question is of course how far he bounces, and how long it lasts.

165.4 days until the polls start to close on election night.

Note: This post is an update based on the data on ElectionGraphs.com. Election Graphs tracks both a poll based estimate of the Electoral College and a numbers based look at the Delegate Races. All of the charts and graphs seen in this post are from that site. Additional graphs, charts and raw data can be found there. All charts above are clickable to go to the current version of the detail page the chart is from, which may contain more up to date information than the snapshots on this page, which were current as of the time of this post. Follow @ElectionGraphs on Twitter or like Election Graphs on Facebook to see announcements of updates or to join the conversation. For those interested in individual general election poll updates, follow @ElecCollPolls on Twitter for all the polls as they are added.

Edit 23:36 UTC to adjust sentence order in the first paragraph.

@ElectionGraphs tweets from 2016-05-26 (UTC)

  • 14:39:43 AP says they have found enough uncommitted dels to put Trump over 1237. ElectionGraphs will update as there is info on specific delegates.
  • 14:41:26 As of our last update Trump needed 22 more dels & there were 32 uncommitted dels who had not expressed a preference. https://t.co/Tb9PhOQX4Z
  • 14:42:54 Guess AP spent yesterday calling those 32 uncommitted delegates and at least 22 of them said “Trump”. Hopefully more specific info soon.

@ElecCollPolls tweets from 2016-05-26 (UTC)

  • 16:08:25 Poll Added: Gravis in VA from 2016-05-24 to 2016-05-24 – Clinton 45% to Trump 41% https://t.co/D6fdogGXln
  • 16:14:41 Poll Added: Gravis in VA from 2016-05-24 to 2016-05-24 – Clinton 44% to Trump 38% to Johnson 6% – Logged but not on site.
  • 16:18:00 Poll Added: PPP in NC from 2016-05-20 to 2016-05-22 – Clinton 41% to Trump 43% to Johnson 3% to Stein 2% – Logged but not on site.
  • 16:20:27 Poll Added: PPP in NC from 2016-05-20 to 2016-05-22 – Clinton 43% to Trump 47% https://t.co/8gsYklSkIf
  • 16:20:32 Clinton vs Trump state category change: NC has moved from Strong Clinton to Weak Clinton https://t.co/8gsYklSkIf
  • 16:22:37 Clinton vs Trump tipping point change: Clinton by 5.2 in NC -> Clinton by 4.2 in FL https://t.co/nXG1mZ0pL3
  • 16:22:38 Trump best case vs Clinton has changed: Clinton 279 to Trump 259 -> Clinton 264 to Trump 274 https://t.co/nXG1mZ0pL3
  • 16:24:40 Poll Added: PPP in NC from 2016-05-20 to 2016-05-22 – Sanders 43% to Trump 40% to Johnson 3% to Stein 2% – Logged but not on site.
  • 16:26:00 Poll Added: PPP in NC from 2016-05-20 to 2016-05-22 – Sanders 48% to Trump 44% https://t.co/LJsuZ5ygY6
  • 16:26:05 Sanders vs Trump state category change: NC has moved from Solid Sanders to Strong Sanders https://t.co/LJsuZ5ygY6
  • 16:33:10 Poll Added: PPIC in CA from 2016-05-13 to 2016-05-22 – Clinton 49% to Trump 39% https://t.co/iQuAIXty8O
  • 16:35:36 Poll Added: PPIC in CA from 2016-05-13 to 2016-05-22 – Sanders 53% to Trump 36% https://t.co/5xDnroc8pI
  • 16:52:20 Poll Added: Zogby in OH from 2016-05-18 to 2016-05-22 – Clinton 45% to Trump 39% https://t.co/xGgOc0ro8R
  • 19:01:33 Poll Added: Zogby w/Other in OH from 2016-05-18 to 2016-05-22 – Clinton 42% to Trump 35% https://t.co/JBaB5FCtjn
  • 19:05:17 Poll Added: Zogby w/Other in OH from 2016-05-18 to 2016-05-22 – Sanders 46% to Trump 35% https://t.co/39OKcd8IQ1
  • 19:09:32 Poll Added: Zogby in OH from 2016-05-18 to 2016-05-22 – Clinton 38% to Trump 33% to Johnson 6% to Stein 3% – Logged but not on site.
  • 19:11:22 Poll Added: Zogby in OH from 2016-05-18 to 2016-05-22 – Sanders 43% to Trump 32% to Johnson 4% to Stein 2% – Logged but not on site.
  • 19:17:01 Poll Added: POS in WI from 2016-05-10 to 2016-05-12 – Clinton 43% to Trump 31% https://t.co/ZfkRJner2e
  • 19:27:24 Polls in VA/NC/CA/OH/WI in today’s scan. There was a change of note, so blog post on @ElectionGraphs later.

@abulsme tweets from 2016-05-26 (UTC)

@ElectionGraphs tweets from 2016-05-25 (UTC)

@ElecCollPolls tweets from 2016-05-25 (UTC)