This is the website of Abulsme Noibatno Itramne (also known as Sam Minter).
Posts here are rare these days. For current stuff, follow me on Mastodon
|
Clinton clinched the nomination last week, but DC still hadn’t voted. Now they have.
Clinton got 16 delegates, Sanders got 4.
Since last week when I posted the CA/NJ/NM/MT/SD/ND results, we had updates from CA/NJ/SD as well as many to superdelegate preferences. The net result of all of these was Clinton +7, Sanders +5.
So net change since last week: Clinton +23, Sanders +9.
All the caucuses and primaries are now over. There are still 116 superdelegates who have not expressed a preference publicly, but what they do at this point no longer matters to the nomination. Similarly, while it is possible that the superdelegates who have already supported someone could change their minds, it is unlikely to happen in significant numbers absent an earthshaking surprise.
So we are done.
Lets look at the updated graphs:
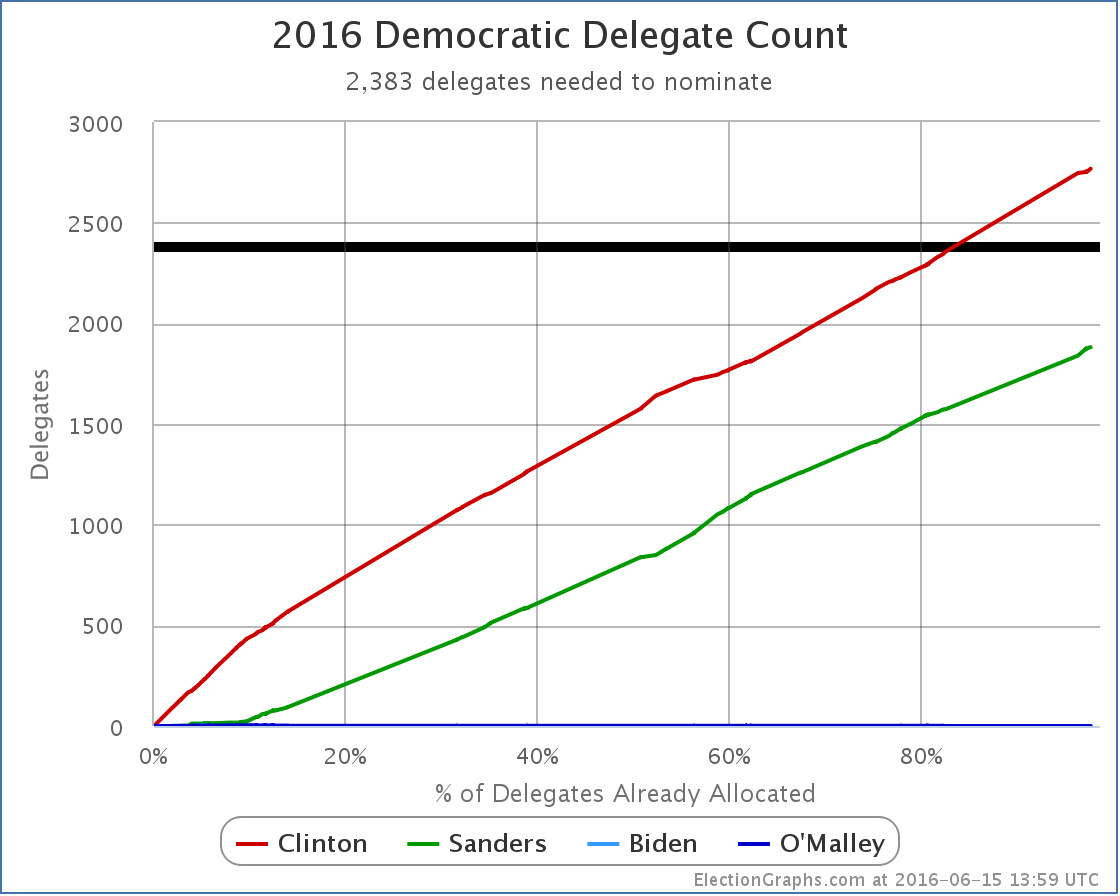
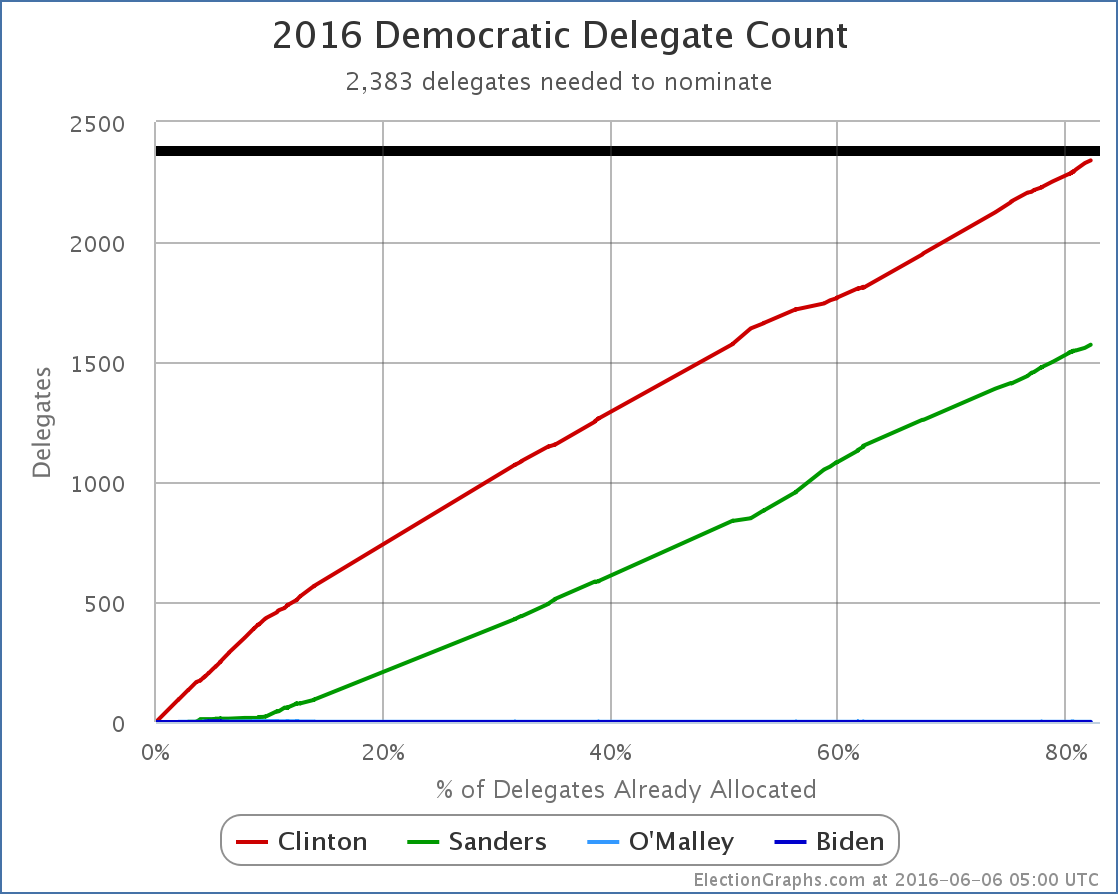
The delegate count is now: Clinton 2768, Sanders 1881, with 116 TBD.

Clinton now has 59.54% of the delegates, Sanders has 40.46%.
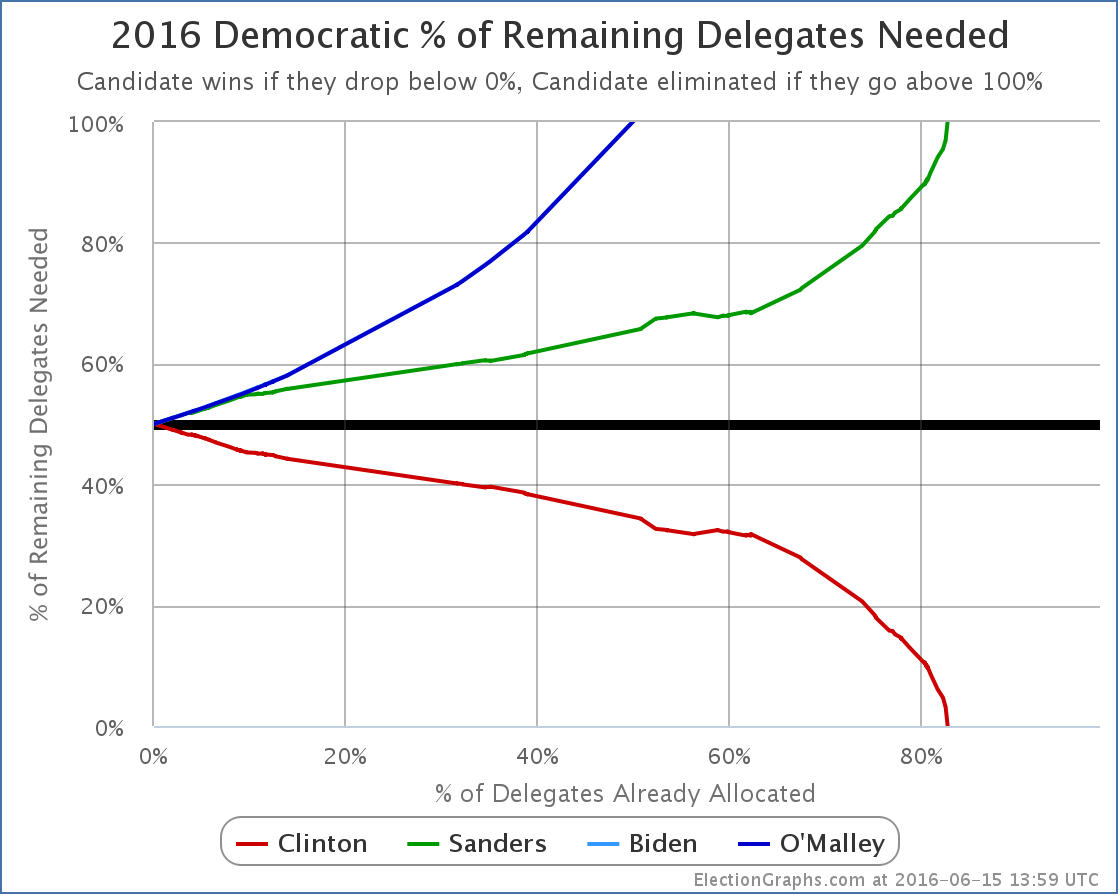
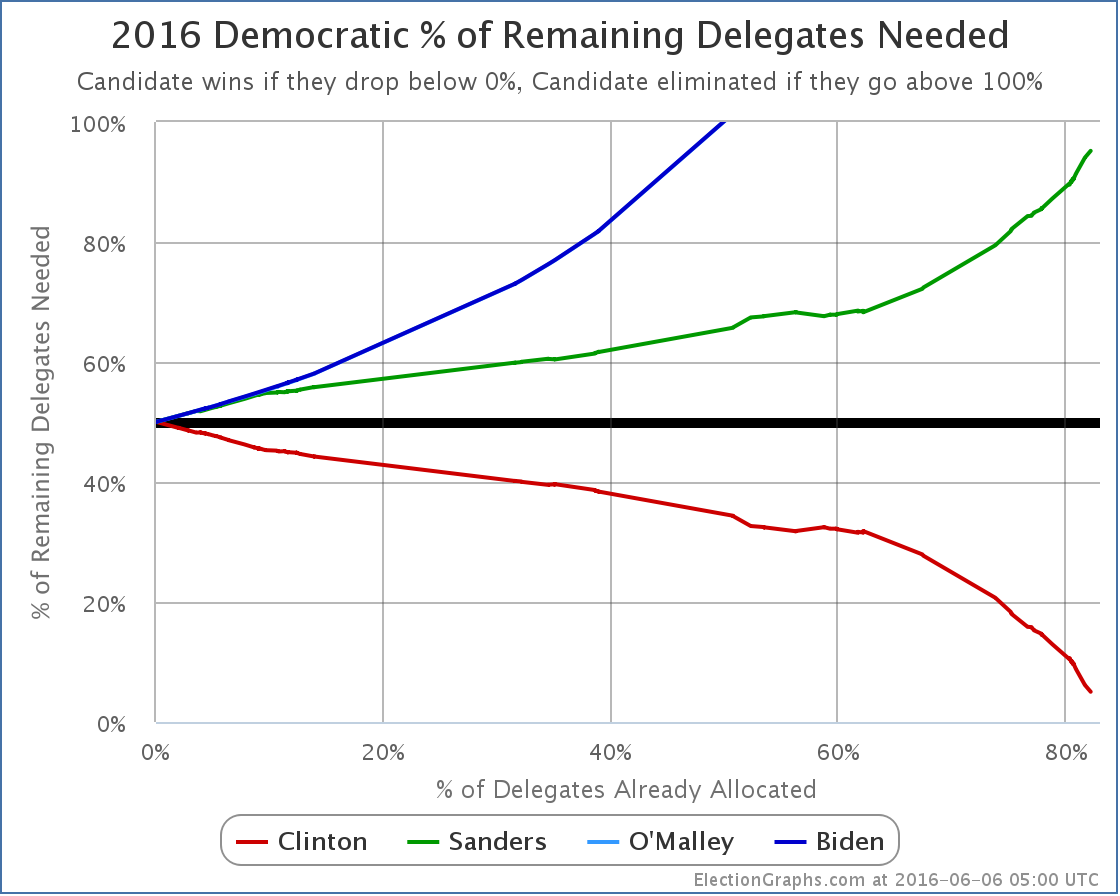
It didn’t change with the DC results since the race was already won, but here again is the “% remaining needed to win” chart.
There isn’t much else to see here absent unexpected craziness. I gave my thoughts wrapping up the Democratic race last week. If there are any additional developments you will see them here. But aside from straggler superdelegates revealing their preferences, nothing of significance is expected.
The Republicans are done too of course.
We have Clinton vs Trump. It is time to settle down and get comfortable for the general election coverage.
146.4 days until the polls start to close on Election Day 2016. Buckle up!
Update 2016-06-18 16:19 UTC – Superdelegate update: Clinton +12, Sanders -1.
Update 2016-06-22 15:47 UTC – Superdelegate update: Clinton +3.
Update 2016-06-22 15:48 UTC – Update from California: Clinton -8, Sanders +8.
Update 2016-06-24 17:06 UTC – Superdelegate update: Clinton +2.
Update 2016-06-28 06:39 UTC – Superdelegate update: Some shuffles, but zero net change.
Update 2016-06-30 06:00 UTC – Update from California. Net change: Clinton -1, Sanders +1
Update 2016-07-01 05:00 UTC – Update from California. Net change: Clinton -1, Sanders +1
Update 2016-07-10 16:00 UTC – Update from California and the Virgin Islands. Net Change: Clinton -1, Sanders +2
Update 2016-07-12 03:33 UTC – Superdelegate update: Clinton +2
Update 2016-07-13 03:56 UTC – Superdelegate update: Net change Clinton +1, Sanders -1. This is Sanders endorsing Clinton.
Update 2016-07-17 15:30 UTC – Superdelegate update: Clinton +3. Update from Puerto Rico: Clinton +1, Sanders -1
Update 2016-07-18 14:25 UTC – Superdelegate update: Clinton +1.5, Sanders -1.5
Update 2016-07-20 07:27 UTC – Superdelegate update: Clinton +2, Sanders -1
Update 2016-07-21 15:56 UTC – Superdelegate update: Clinton -1. This was due to Rep Takai (HI) dying, so total number of delegates also -1.
Update 2016-07-26 07:27 UTC – Final superdelegate update: Net change Clinton +1. This makes the final totals Clinton 2782.5, Sanders 1889.5. Next update will be the convention roll call.
Update 2016-07-28 15:34 UTC – Actual convention roll call results were Clinton 2842, Sanders 1865, DNV 56. So Clinton gained 59.5 delegates while Sanders lost 24.5 delegates compared to the last estimates here.
Note: This post is an update based on the data on ElectionGraphs.com. Election Graphs tracks both a poll based estimate of the Electoral College and a numbers based look at the Delegate Races. All of the charts and graphs seen in this post are from that site. Additional graphs, charts and raw data can be found there. Follow @ElectionGraphs on Twitter or like Election Graphs on Facebook to see announcements of updates or to join the conversation. For those interested in individual general election poll updates, follow @ElecCollPolls on Twitter for all the polls as they are added. If you find the information in these posts interesting or useful, please consider visiting the tip jar.
By the Election Graphs count, Clinton now has 2745 delegates, which puts her well over the 2383 require to clinch the nomination.
As they did with the Republicans, AP went out and called many still publicly uncommitted superdelegates and was able to get the winning candidate to the magic number in their count a little earlier than those of us only using public commitments. In this case AP made their announcement Monday. The count here went over the magic number within minutes of the polls closing in New Jersey Tuesday night.
As of the writing of this post, all but 4 straggling delegates from New Jersey out of the 694 delegates up for grabs last night seem to be reasonably determined, so lets run down then numbers.
After Puerto Rico, Clinton only needed 5.05% of the remaining delegates to win. Sanders needed 95.19% of the remaining delegates. Clinton needed 43 delegates, Sanders needed 811.
In CA/NJ/NM/MT/SD/ND Clinton got 391 delegates while Sanders got 299. (As mentioned, there are still 4 TBD from NJ as of this writing.)
In the days between Puerto Rico and the June 7th results coming in, superdelegate changes yielded a net change of: Clinton +14, Sanders +1, O’Malley -1. Yes, that lone O’Malley superdelegate finally flipped… to Clinton.
Total change since Puerto Rico: Clinton +405, Sanders +300, O’Malley -1
That is Clinton 57.53%, Sanders 42.61%. (Adds to more than 100% because Clinton took the one delegate from O’Malley.)
So Clinton met her target, Sanders did not.
405 delegates is significantly more than the 43 delegates Clinton needed to go over the top.
She clinches. She is the presumptive nominee.
Lets check out the updated graphs:

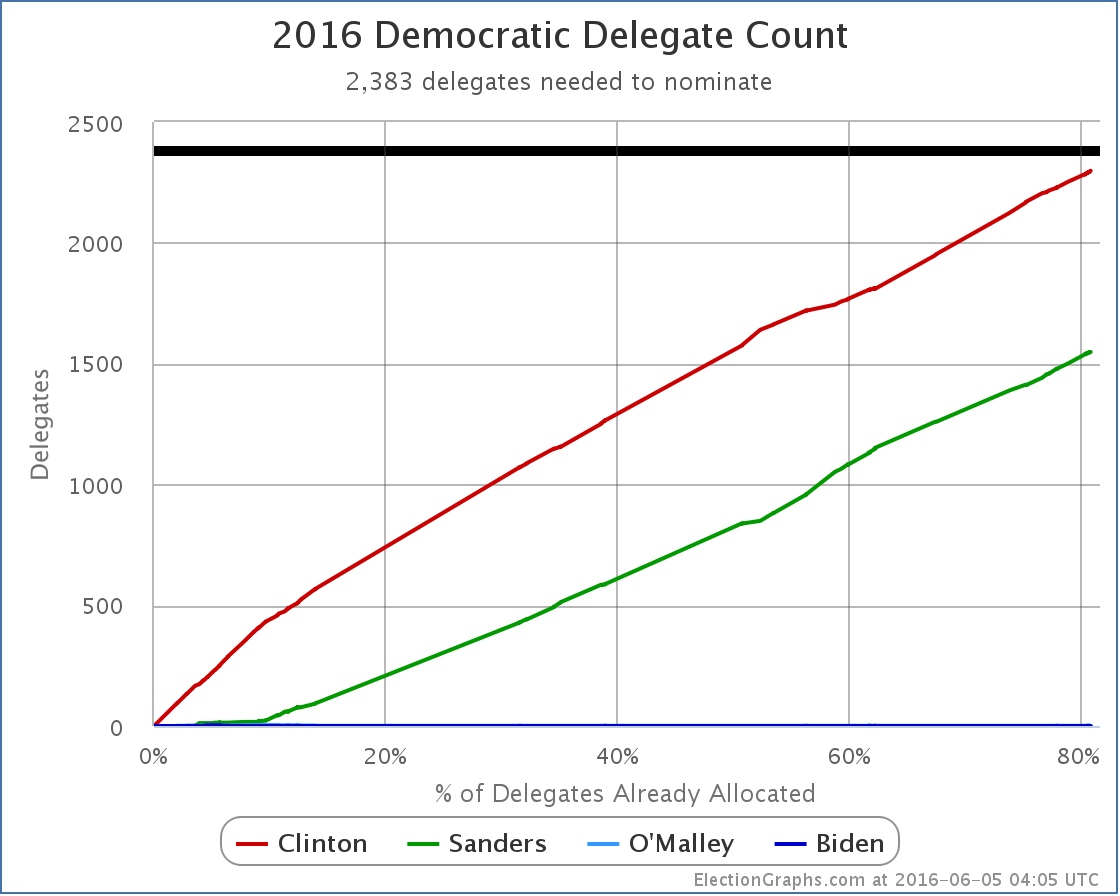
New delegate totals: Clinton 2745, Sanders 1872. Clinton blows past 2383 and is now well beyond where she needed to get.
There are 148 delegates left. Washington DC has 20 up for grabs next week. There are those 4 from New Jersey too. The other 124 are superdelegates who have not yet stated a preference. Clinton needs none of these delegates. Sanders could get every single one of these delegates, and would still lose decisively.
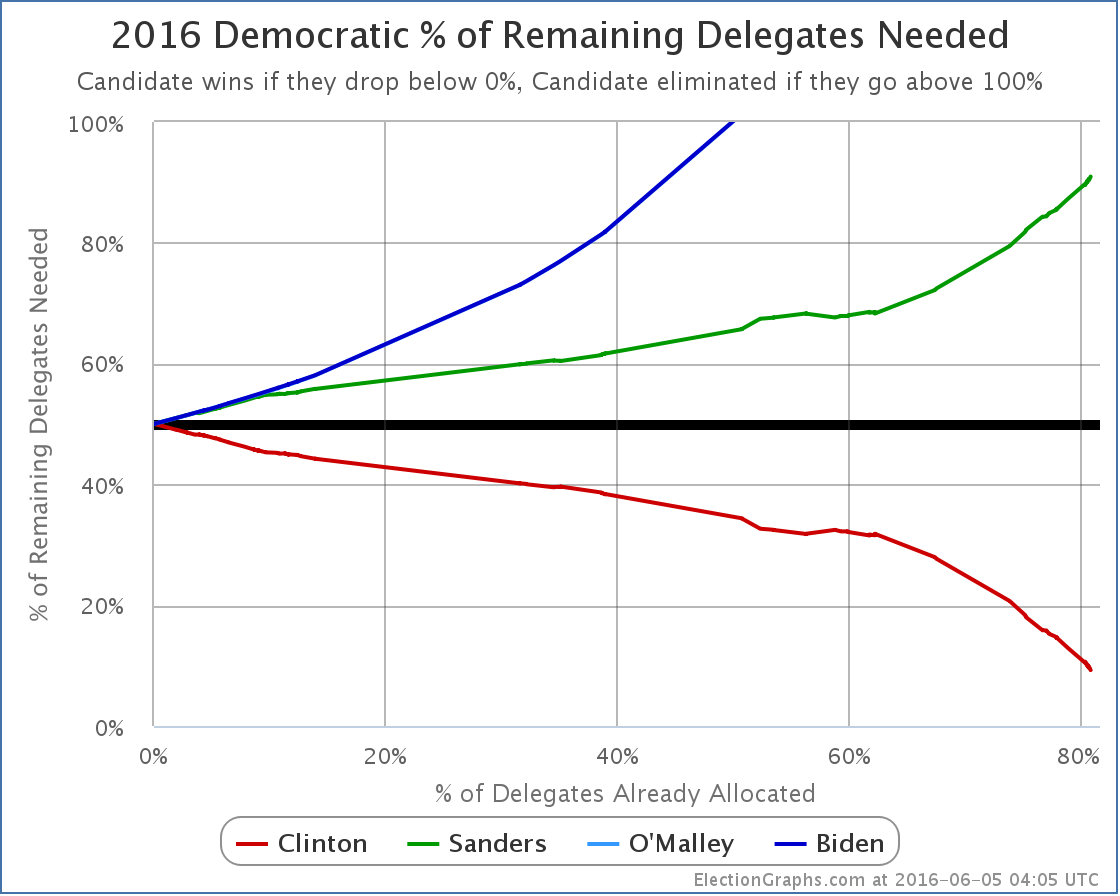
The “% of delegates needed to win” chart is complete. Clinton dropped below 0%, Sanders went above 100%.
One more graph:
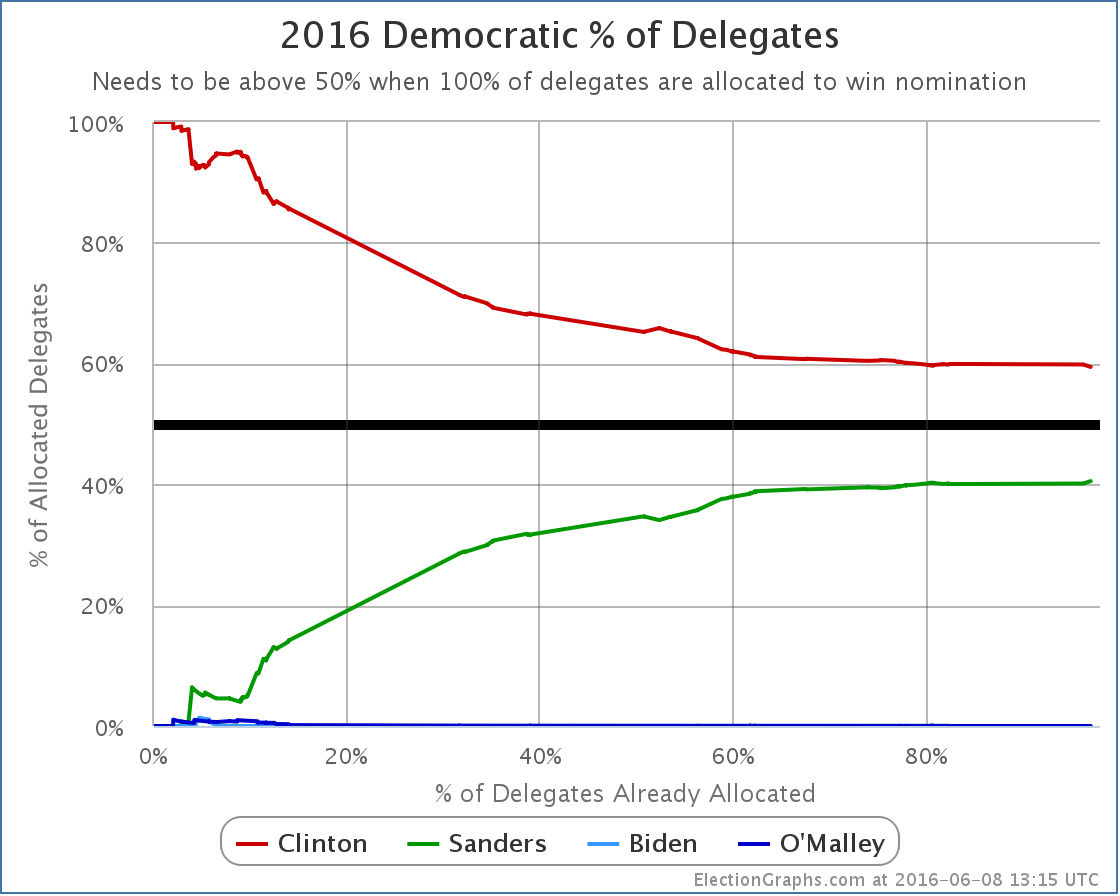
Since she started at 100% of the delegates by getting superdelegates before the first primaries or caucuses even happened, Clinton’s “% of delegates” number of course trended downward through most of the cycle. But for quite some time now the delegate race has stuck pretty close to being a 60% to 40% split in Clinton’s favor. As of now, it sits at Clinton 59.45%, Sanders 40.55%.
OK, now to step back a little…
Clinton dominated this race from the beginning. There were only a handful of moments where Sanders even managed to close the gap a little bit. Sanders was never even close. It was clear since the beginning of March… at the latest… that is being generous… it was fairly clear even before that… that Sanders catching up would take a miracle. The one thing that has been amazing throughout the primary process is the ability of many Sanders supporters to be in complete denial about this in the face of overwhelming evidence. It is one thing to be enthusiastic about your candidate and even to hope for that miracle, but it is another thing to not even recognize that you are losing and that it would indeed take that miracle to win.
And yes, some of those Sanders folks are still in denial even now. Because superdelegates. So a quick look. Right now we have Clinton 2745, Sanders 1872. There are 124 remaining superdelegates. Lets give them all to Sanders. For fun give Sanders all 20 DC delegates and the 4 from New Jersey too. Now we have Clinton 2745, Sanders 2020. All delegates are now allocated. Sanders is still short. To get to 2382 he would need at least 182 delegates who have committed to Clinton to change their minds and vote for Sanders instead. Clinton has 532 superdelegates by the latest count. So that means 34.2% of the superdelegates currently committed to Clinton would have to flip.
They would have to do that flip in the face of Clinton having won the popular vote (even if you include estimated popular vote for caucus states), Clinton having won the pledged delegate count, and Clinton having won the most states. Not to mention significant numbers of the superdelegates not simply being lukewarm Clinton supporters, but being people who she has actively cultivated for many years, a good number of which have actually been active in her campaign.
Is it mathematically possible? Yes. Of course it is. Is it going to happen absent something catastrophic happening to Clinton? No.
Some Sanders folks are still holding out the “What if Clinton is indicted?” scenario. My guess is most superdelegates would consider it an unfair and unjust indictment and stick by their candidate. It probably wouldn’t be enough. Perhaps I suppose. It is a stretch though. More realistically it would take a debilitating health issue or some brand new scandal so serious it dwarfs everything that has come up so far. Can you imagine these sorts of things? Of course. But they are all unforeseen unpredictable types of event, not things you decide to continue a campaign based on. After all, there are ways Martin O’Malley can still win the nomination too!
You can conjure similar scenarios on the other side too of course, but absent that kind of craziness, we now have our nominees in both parties.
So we have Clinton vs Trump. Time to start focusing on the general election analysis!
153.4 days until polls start to close on election day!
Update 2016-06-12 17:16 UTC – Superdelegate update. Net Change: Clinton +11
Update 2016-06-12 17:43 UTC – Missed one change in the superdelegate update above. Additional Change: Clinton -1. (So Clinton +10 for this day’s scan.)
Update 2016-06-12 18:02 UTC – Updates from California, New Jersey, and South Dakota (including the remaining 4 TBD delegates from New Jersey). Net change: Sanders +4.
Update 2016-06-15 01:40 UTC – Superdelegate update. Net Change: Clinton -3, Sanders +1.
Note: This post is an update based on the data on ElectionGraphs.com. Election Graphs tracks both a poll based estimate of the Electoral College and a numbers based look at the Delegate Races. All of the charts and graphs seen in this post are from that site. Additional graphs, charts and raw data can be found there. Follow @ElectionGraphs on Twitter or like Election Graphs on Facebook to see announcements of updates or to join the conversation. For those interested in individual general election poll updates, follow @ElecCollPolls on Twitter for all the polls as they are added. If you find the information in these posts interesting or useful, please consider visiting the tip jar.
Edit 15:19 UTC to mention the 4 delegates from New Jersey in the list of remaining delegates and the calculations for superdelegates flipping.
After the Virgin Islands, Clinton only needed 9.26% of the remaining delegates to win. Sanders needed 90.96% of the remaining delegates.
In Puerto Rico, Clinton got 36 delegates, Sanders got 24.
Since the Virgin Islands, 6 more superdelegates were added to Clinton’s count as well.
So total change since the Virgin Islands: Clinton +42, Sanders +24.
That is Clinton 63.64%, Sanders 36.26%.
So Clinton met her target, Sanders did not.
Updated graphs:
New delegate totals: Clinton 2340, Sanders 1572, O’Malley 1.
There are 852 delegates left. Clinton needs 43 of them. Sanders needs 811 of them.
Clinton now needs 5.05% of the remaining delegates to win. Sanders needs 95.19%.
This of course includes superdelegates. Please see any number of previous posts here on Election Graphs as to why it is appropriate to include them, even though they can change their minds until they vote at the convention. If any superdelegates change their minds publicly before then, it will be tracked here.
Right now Clinton only needs 43 more delegates to clinch the nomination. There are still about 139 who have not stated a preference. There have been media reports that Clinton has 40+ superdelegates who have privately committed to her that they are waiting to roll out after the New Jersey results almost certainly push her over 2383 anyway. NBC, AP and some others also have a higher current delegate count than I do for Clinton by about 20 delegates due to information they have collected privately from superdelegates.
Put all of that together, and it is actually very possible, indeed probably very likely, that Clinton ALREADY has more than 2383 delegates that she is sure of. In terms of public confirmation, she is just a few handfuls of delegates away, the number of handfuls depending on whose delegate count you go by.
Superdelegates could give Clinton the nomination at any moment now. But since Clinton would prefer to win after the votes of regular citizens are counted, her campaign is almost certainly asking any currently uncommitted superdelegates leaning toward her to wait. So with as much certainty as you can ever get in these sorts of things, expect Clinton to be declared the presumptive nominee by everybody who does such things shortly after the polls start closing on June 7th.
For this site, the blog post about the June 7th results probably won’t go out until the next morning, but watch @ElectionGraphs on Twitter for hourly updates of the delegate totals, including of course noting when she wins the nomination by our own count.
Update 2016-06-07 00:52 UTC: I almost put “…at the latest.” on the end of the paragraph about the networks calling the result soon after polls start closing on the 7th. But alas, I didn’t. A few minutes ago AP reported that by their count Clinton is over 2383 and is therefore the presumptive nominee. They are including superdelegates who have not yet publicly expressed a preference, but have done so when asked privately. The count here will take a little bit to catch up, since it is dependent on public statements by superdelegates and/or actual election results. But the result will be the same…
Update 2016-06-07 22:31 UTC: My source trying to catch up with superdelegate info resulting from AP’s updated counts. Net Change: Clinton +15, Sanders +1, O’Malley -1. Yes, that one O’Malley superdelegate finally flipped… to Clinton.
Update 2016-06-07 23:55 UTC: Updated the number of superdelegates in a bunch of states as per Green Papers. Most changes were uncommitted slots anyway, but there was a net change of Clinton -1. There was no net change to the total number of delegates.
Note: This post is an update based on the data on ElectionGraphs.com. Election Graphs tracks both a poll based estimate of the Electoral College and a numbers based look at the Delegate Races. All of the charts and graphs seen in this post are from that site. Additional graphs, charts and raw data can be found there. Follow @ElectionGraphs on Twitter or like Election Graphs on Facebook to see announcements of updates or to join the conversation. For those interested in individual general election poll updates, follow @ElecCollPolls on Twitter for all the polls as they are added. If you find the information in these posts interesting or useful, please consider visiting the tip jar.
Edit 17:40 to fix a typo where I said Clinton needed 42 delegates instead of 43 in one of the places it is mentioned.
With the final results all but inevitable, these updates will be somewhat mechanical absent something unexpected happening.
After Oregon and Kentucky, Clinton only needed 11.37% of the remaining delegates to win. Sanders needed 88.84% of the remaining delegates.
In the Virgin Islands, Clinton got 6 delegates, Sanders got 1.
In other changes since Oregon and Kentucky due to superdelegate updates and adjustments in Maryland, Oregon and Michigan there was a net change of Clinton +17, Sanders +8.
So total change since Oregon and Kentucky: Clinton +23, Sanders +9.
That is Clinton 71.88%, Sanders 28.13%.
So Clinton met her target, Sanders did not.
Updated graphs:
New delegate totals: Clinton 2298, Sanders 1548, O’Malley 1.
There are 918 delegates left. Clinton needs 85 of them. Sanders needs 835 of them.
Clinton now needs 9.26% of the remaining delegates to win. Sanders needs 90.96%.
This of course includes superdelegates. The Sanders camp continues to insist that you shouldn’t count superdelegates until the convention because until then they can change their minds. It is true they can change their minds, but we have been logging whenever that happens, and it has been rare. The best we can tell about how superdelegates will vote is to take their public preferences at face value. If they change their minds and they say so, we will know and the counts will change. In the mean time, to ignore their preferences in the count would be to intentionally ignore data about the current situation.
Right now Clinton only needs 85 more delegates to clinch the nomination. There are still 145 superdelegates who have not stated a preference. They could put Clinton over the top at any time. The Clinton folks undoubtedly do not want superdelegates to put them over the top though, so they may actually be asking the remaining superdelegates NOT to make any endorsements in the next few days.
Some media agencies actually have Clinton’s delegate count a bit higher than our count, which matches The Green Papers exactly at this point. This is because those media organizations have been able to privately confirm the preferences of some superdelegates who have not made public commitments. Both this site and the Green papers use the Wikipedia superdelegate tally as our source, and this only includes publicly confirmed preferences.
In any case, we are very close. Between the Puerto Rican primary and superdelegates, it is possible Clinton will hit the magic number before the big contests on June 7th. Most likely though, she’ll get there as soon as the polls close in New Jersey on the 7th. The rest of the June 7th states will just be icing on the cake.
Update 21:45 – Superdelegate scan +6.
Note: This post is an update based on the data on ElectionGraphs.com. Election Graphs tracks both a poll based estimate of the Electoral College and a numbers based look at the Delegate Races. All of the charts and graphs seen in this post are from that site. Additional graphs, charts and raw data can be found there. All charts above are clickable to go to the current version of the detail page the chart is from, which may contain more up to date information than the snapshots on this page, which were current as of the time of this post. Follow @ElectionGraphs on Twitter or like Election Graphs on Facebook to see announcements of updates or to join the conversation. For those interested in individual general election poll updates, follow @ElecCollPolls on Twitter for all the polls as they are added.
Edit 2016-06-06 16:55 UTC to add yesterday’s superdelegate scan, which I had neglected to add at the time.
With the final results all but inevitable, these updates will be somewhat mechanical absent something unexpected happening.
After West Virginia, Sanders needed 84.90% of the remaining delegates to win, Clinton only needed 15.29%.
In Oregon and Kentucky, Sanders got 62, Clinton got 54.
In other changes since West Virginia due to superdelegate updates, there was a net change of Clinton +1, Sanders -1.
So total change since West Virginia: Sanders +61, Clinton +55.
That is Sanders 52.59%, Clinton 47.41%.
So Clinton met her target, Sanders did not.
Updated graphs:

New delegate totals: Clinton 2275, Sanders 1539, O’Malley 1.
There are 950 delegates left. Clinton needs 108 of them. Sanders needs 844 of them.
Clinton now needs 11.37% of the remaining delegates to win. Sanders needs 88.84%.
Update 2016-05-20 16:33 UTC: Superdelegate scan – Clinton +2, Sanders +2.
Update 2016-05-25 02:26 UTC: Superdelegate scan – Clinton +3.
Update 2016-05-25 02:28 UTC: Change from Maryland – Sanders +1, Clinton -1.
Update 2016-05-27 17:05 UTC: Superdelegate scan – Clinton +7, Sanders +1.
Update 2016-05-30 16:06 UTC: Superdelegate scan – Clinton +4, Sanders -1.
Update 2016-06-03 14:20 UTC: Superdelegate scan – Clinton +4, Sanders +3
Update 2016-06-03 14:22 UTC: There was a one delegate adjustment from Clinton to Sanders in Oregon as results were finalized there. I also discovered one Sanders delegate in Michigan I was missing due to a math error on my part which is now fixed. Net change: Sanders +2, Clinton -1.
Update 2016-06-05 03:25 UTC: Superdelegate scan – Clinton -1
Note: This post is an update based on the data on ElectionGraphs.com. Election Graphs tracks both a poll based estimate of the Electoral College and a numbers based look at the Delegate Races. All of the charts and graphs seen in this post are from that site. Additional graphs, charts and raw data can be found there. All charts above are clickable to go to the current version of the detail page the chart is from, which may contain more up to date information than the snapshots on this page, which were current as of the time of this post. Follow @ElectionGraphs on Twitter or like Election Graphs on Facebook to see announcements of updates or to join the conversation. For those interested in individual general election poll updates, follow @ElecCollPolls on Twitter for all the polls as they are added.
Edit 2016-06-05 05:44 UTC: Corrected a couple details of the list of superdelegate updates to match my logs of the changes that were made. I’d missed logging a couple of the updates here on this post. Dated the updates to approximately when I made the changes.
With the final results all but inevitable, these updates will be somewhat mechanical absent something unexpected happening.
After Guam, Sanders needed 84.23% of the remaining delegates to win, Clinton only needed 15.95%.
In West Virginia, Sanders got 18, Clinton got 11.
In other changes since Guam due to superdelegate updates and revisions in the results from Maine, there was a net change of Clinton +1, Sanders +1.
So total change since Guam: Sanders +19, Clinton +12.
That is Sanders 61.29%, Clinton 38.71%.
So Clinton met her target, Sanders did not.
Updated graphs:

New delegate totals: Clinton 2220, Sanders 1478, O’Malley 1.
There are 1066 delegates left. Clinton needs 163 of them. Sanders needs 905 of them.
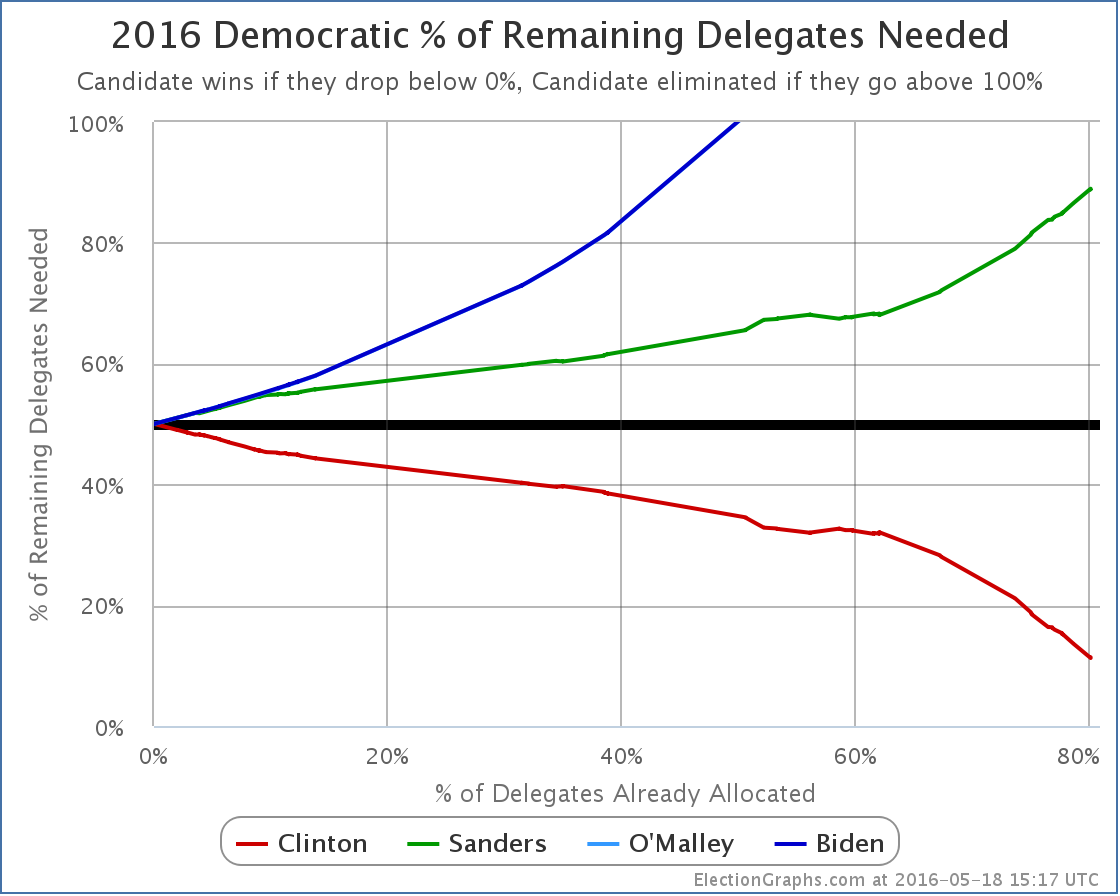
Clinton now needs 15.29% of the remaining delegates to win. Sanders needs 84.90%.
Update 2016-05-14 16:09: Superdelegate scan yields net change Clinton +2.
Update 2016-05-17 16:56: Superdelegate scan yields net change Clinton -2.
Update 2016-05-18 14:44: Superdelegate scan yields net change Clinton +1, Sanders -1
Note: This post is an update based on the data on ElectionGraphs.com. Election Graphs tracks both a poll based estimate of the Electoral College and a numbers based look at the Delegate Races. All of the charts and graphs seen in this post are from that site. Additional graphs, charts and raw data can be found there. All charts above are clickable to go to the current version of the detail page the chart is from, which may contain more up to date information than the snapshots on this page, which were current as of the time of this post. Follow @ElectionGraphs on Twitter or like Election Graphs on Facebook to see announcements of updates or to join the conversation. For those interested in individual general election poll updates, follow @ElecCollPolls on Twitter for all the polls as they are added.
Clinton won Guam. She got 4 delegates. Sanders got 3.
This is of course a tiny number of delegates and changes nothing.
In addition, since Indiana, 3 more superdelegates were added to Clinton’s total, and one pledged delegate in Mississippi moved from Clinton to Sanders due to updates there.
So the net change since Indiana is Clinton +6, Sanders +4.
This difference is barely visible in the charts, but here are the updated charts anyway:
New overall totals: Clinton 2208, Sanders 1459, O’Malley 1.
You’d think at some point that O’Malley superdelegate would say they support someone else. But not yet.
Clinton now only needs 15.95% of the remaining delegates to clinch the nomination.
Sanders would need 84.23% of the remaining delegates to catch up and win.
And so we continue to watch the Clinton win play out.
Update 2016-05-11 05:26 UTC: Superdelegate update – Clinton +2.
Update 2016-05-11 05:33 UTC: Update from Maine – Sanders +1, Clinton -1.
Note: This post is an update based on the data on ElectionGraphs.com. Election Graphs tracks both a poll based estimate of the Electoral College and a numbers based look at the Delegate Races. All of the charts and graphs seen in this post are from that site. Additional graphs, charts and raw data can be found there. All charts above are clickable to go to the current version of the detail page the chart is from, which may contain more up to date information than the snapshots on this page, which were current as of the time of this post. Follow @ElectionGraphs on Twitter or like Election Graphs on Facebook to see announcements of updates or to join the conversation. For those interested in individual general election poll updates, follow @ElecCollPolls on Twitter for all the polls as they are added.
Sanders won Indiana’s pledged delegates 44 to 39.
So he got 53.01% of the delegates. He needed 80.92% to be on a pace to catch up with Clinton.
But it is actually worse. That 80.92% was as of the results from the Northeast last week. Since then between superdelegate announcements and a revision to the Ohio results, there was a net change of Clinton +11, Sanders -1. If you add that in, you get Clinton +50, Sanders +43 since last week. So actually Sanders only got 46.24% of the recent delegates.
Which means, of course, that Clinton just continued her march to the nomination and improved her position despite Sanders’ win.
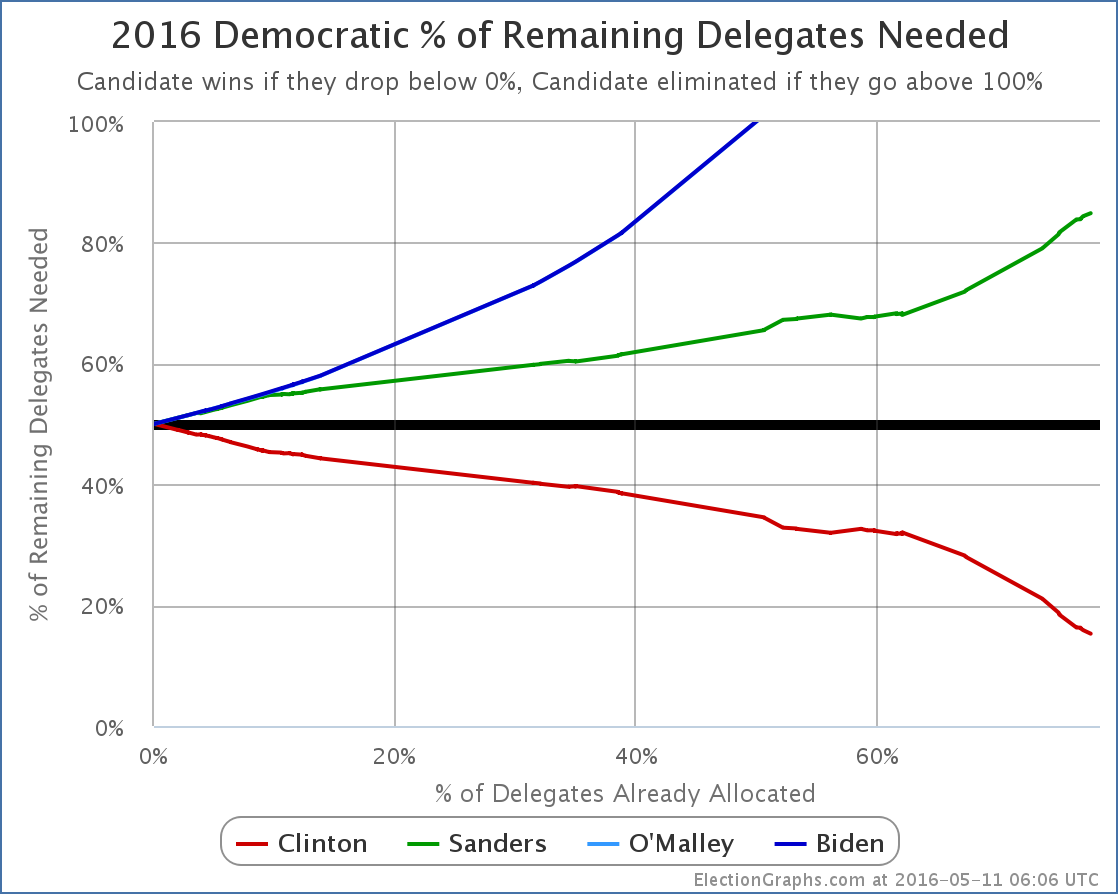
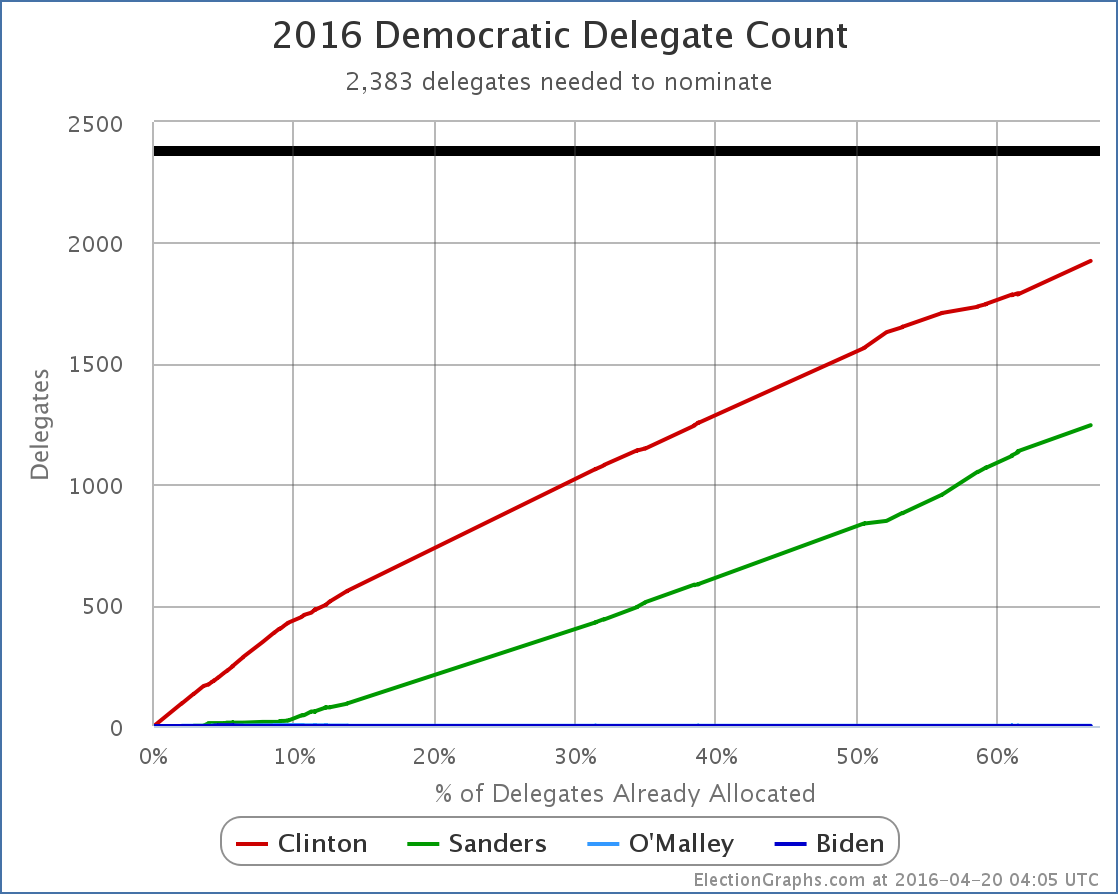
Here come the graphs:
The totals are now Clinton 2202, Sanders 1455, O’Malley 1. Clinton only needs 181 of the 1107 remaining delegates to wrap this up.
Which brings us to…
Clinton now only needs 16.35% of the remaining delegates to win. Sanders needs 83.83%.
Massive superdelegate defections could alter this, but there have never been any signs of such movement, and there are none now.
For a long time now the result has been clear absent a catastrophic change. As we have fewer and fewer delegates left, the curves above will move more quickly toward the final result, and it will be more and more difficult to get a result that would even slow it down.
ElectionGraphs.com will continue to document this process, but there is little to no drama left, it is just a matter of watching Clinton gather up the remaining delegates needed.
Update 2016-05-08 01:57 – Superdelegate update, net change Clinton +3. Update from Mississippi, net change Clinton -1, Sanders +1.
Note: This post is an update based on the data on ElectionGraphs.com. Election Graphs tracks both a poll based estimate of the Electoral College and a numbers based look at the Delegate Races. All of the charts and graphs seen in this post are from that site. Additional graphs, charts and raw data can be found there. All charts above are clickable to go to the current version of the detail page the chart is from, which may contain more up to date information than the snapshots on this page, which were current as of the time of this post. Follow @ElectionGraphs on Twitter or like Election Graphs on Facebook to see announcements of updates or to join the conversation. For those interested in individual general election poll updates, follow @ElecCollPolls on Twitter for all the polls as they are added.
Even the Sanders folks are starting… just starting… to admit it might be over.
Clinton won 218 delegates yesterday. Sanders won 166.
In addition, since New York there were new superdelegate endorsements and updates in Illinois and Ohio which have netted Clinton +9, Sanders +1.
So including everything since New York, we have Clinton +227, Sanders +167.
That means Clinton got 57.61% of the delegates. She only needed 28.73%.
Meanwhile Sanders got 42.39% of the delegates. He needed 71.39%.
In practical terms this has been for over a long time. Absent a huge unexpected event of course.
But we still watch it play out.
Here are the relevant graphs:

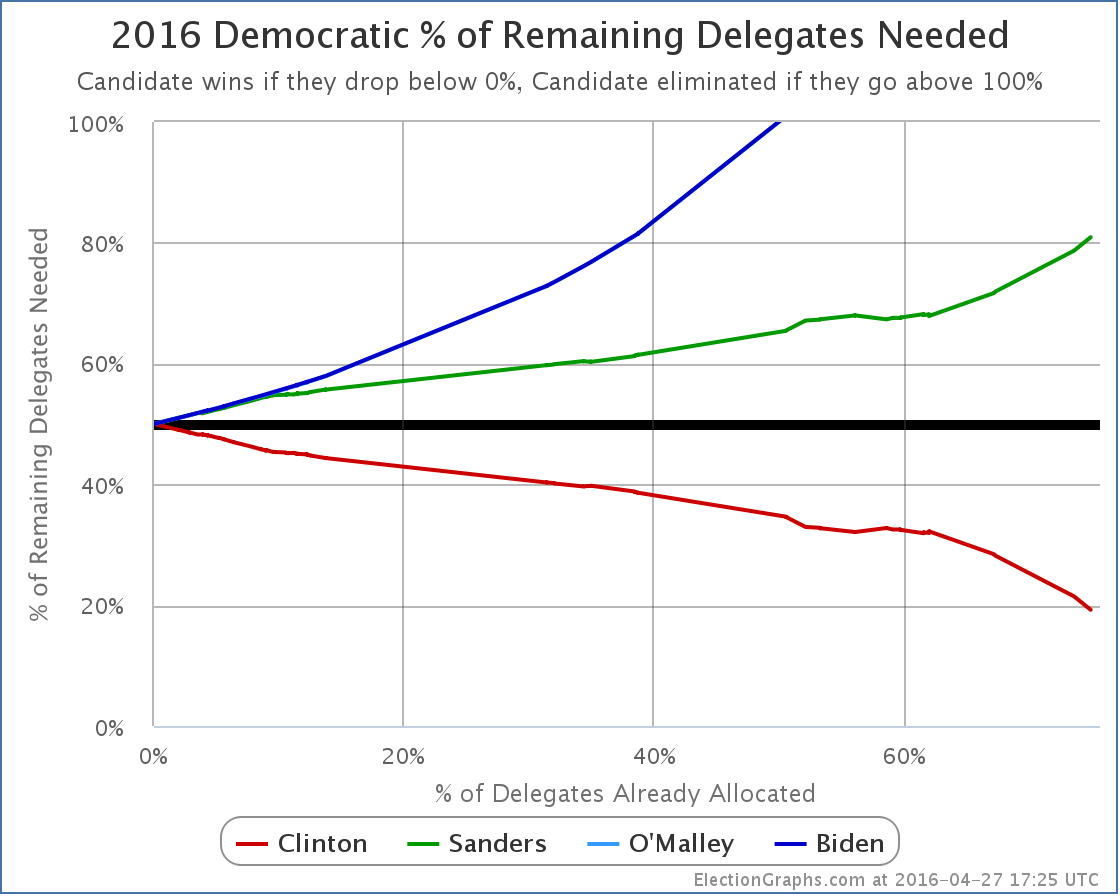
Clinton now only needs 231 of the remaining 1200 delegates to win. That’s 19.25% of the remaining delegates.
Sanders on the other hand needs 971 of the 1200. That is 80.92%.
Guess which is most likely?
Or, of course, still, tons of Clinton superdelegates could defect and change this a bit. I wouldn’t hold my breath for that though.
Update 2016-05-01 17:08 UTC: Superdelegate updates plus change to Ohio pledged delegates. Net change: Clinton +11, Sanders -1.
Note: This post is an update based on the data on ElectionGraphs.com. Election Graphs tracks both a poll based estimate of the Electoral College and a numbers based look at the Delegate Races. All of the charts and graphs seen in this post are from that site. Additional graphs, charts and raw data can be found there. All charts above are clickable to go to the current version of the detail page the chart is from, which may contain more up to date information than the snapshots on this page, which were current as of the time of this post. Follow @ElectionGraphs on Twitter or like Election Graphs on Facebook to see announcements of updates or to join the conversation. For those interested in individual general election poll updates, follow @ElecCollPolls on Twitter for all the polls as they are added.
Clinton won New York 139 to 108.
This is only a surprise to Sanders supporters who were in deep denial. This is exactly as has been expected for many many weeks. The series of Sanders wins prior to this were also mostly predicted. The one exception (Michigan, where Sanders did outperform expectations) wasn’t enough of a win to actually help Sanders. The Clinton vs Sanders wins and losses have for the most part played out very close to expectations. The variations from that have only been a few delegates here or there.
The breathless talk of momentum and talk of a Sanders path to victory has mostly been due to the Sanders camp desperately trying to spin whatever narrative they have, the general public not understanding how the process works (yes, superdelegates count), the public not understanding the math (even massive Sanders wins at this point aren’t enough to catch up and win), and the media hopelessly biased toward a race being more fun to cover than just monitoring progress toward an almost inevitable result.
It has been clear since around March 6th… at the LATEST… probably earlier to be honest… that absent a major Clinton implosion, Clinton would be the nominee and Sanders wasn’t going to catch her.
And yes, yes, even today… for that matter even up until the actual votes are cast at the convention… there is still that chance of a Clinton implosion. There could be some new scandal, some new health event, or something else, that causes even Clinton supporters to abandon her. That would potentially change everything, even if Clinton already has things wrapped up mathematically.
Absent that though, this result has been clear for a long time, and we are just watching the steps to get there.
In addition to New York, since the last democratic contest in Wyoming there have been a variety of superdelegate changes, plus revised results from Colorado. The net result of all of those was Sanders +5, Clinton -2. Those are good numbers for Sanders, but small.
Add in New York and the results since Wyoming are Clinton +137, Sanders +113.
That means Clinton got 54.80% of the delegates. She only needed 32.23%.
Sanders got 45.20% of the delegates. He needed 67.84%.
So the already nearly impossible Sanders path gets even more remote.
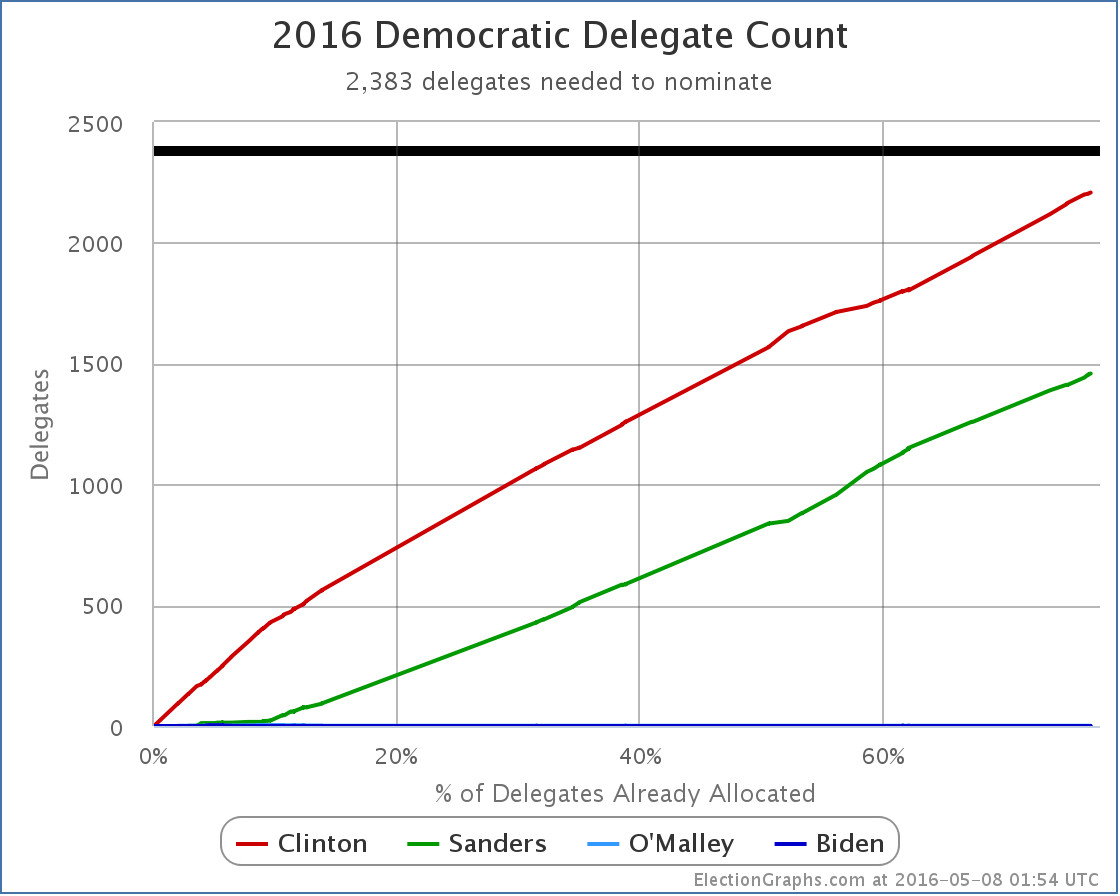
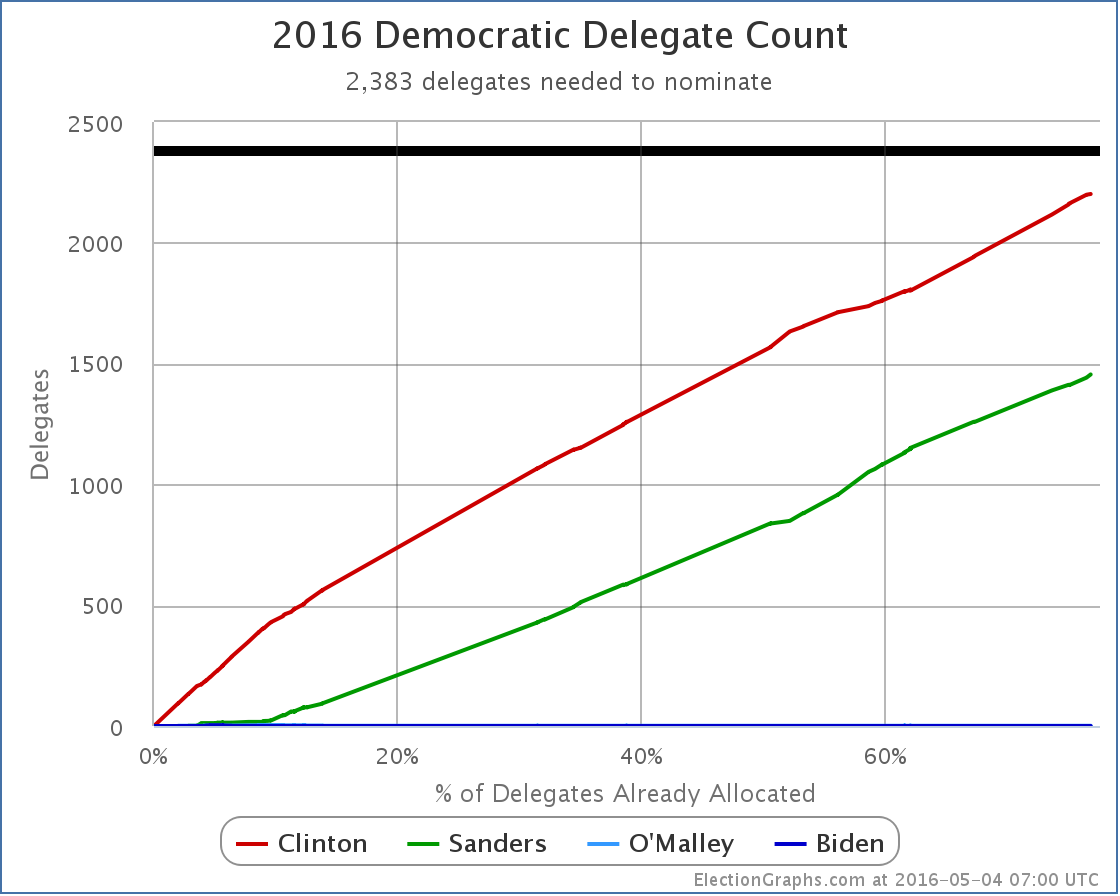
I don’t usually post the raw delegate count graph, but we are now in sight of the finish line.
We now have Clinton 1925, Sanders 1245, O’Malley 1. With 1594 delegates still to be determined, and 2383 needed to win the nomination.
You can see that since primaries and caucuses began (around the 9% mark), with only a few exceptions here and there, the pace at which both candidates have collected delegates has been pretty steady. (If you look at this with a date axis it looks much more jagged, but this is all just distortion caused by the way the states happened to be scheduled, looking at % allocated removes this distortion and allows you to look more cleanly at the actual trends.)
Clinton has been consistently ahead, and except for a few short exceptions has been gradually increasing her lead.
It is clear even from this chart that to catch up before we get to 100% there would need to be a dramatic change, not just a small improvement on the Sanders side.
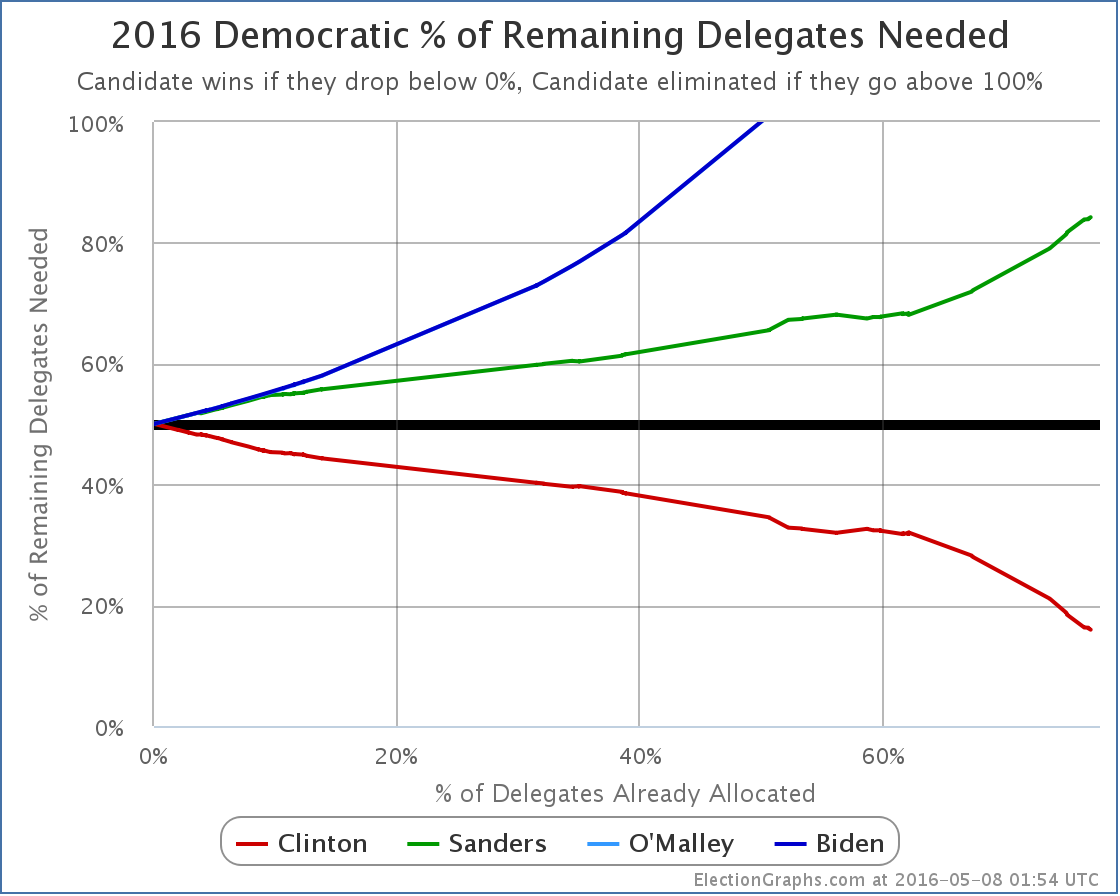
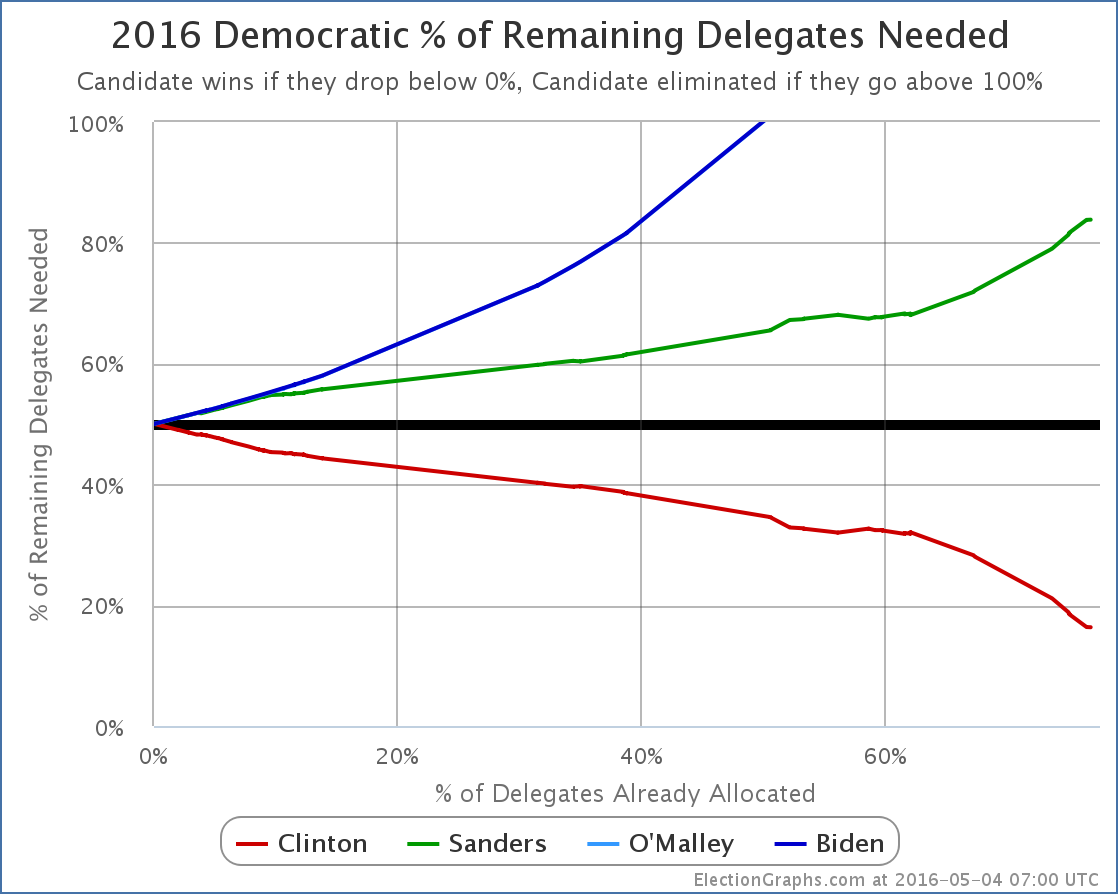
But lets look at the more telling “% of remaining delegates needed” graph:
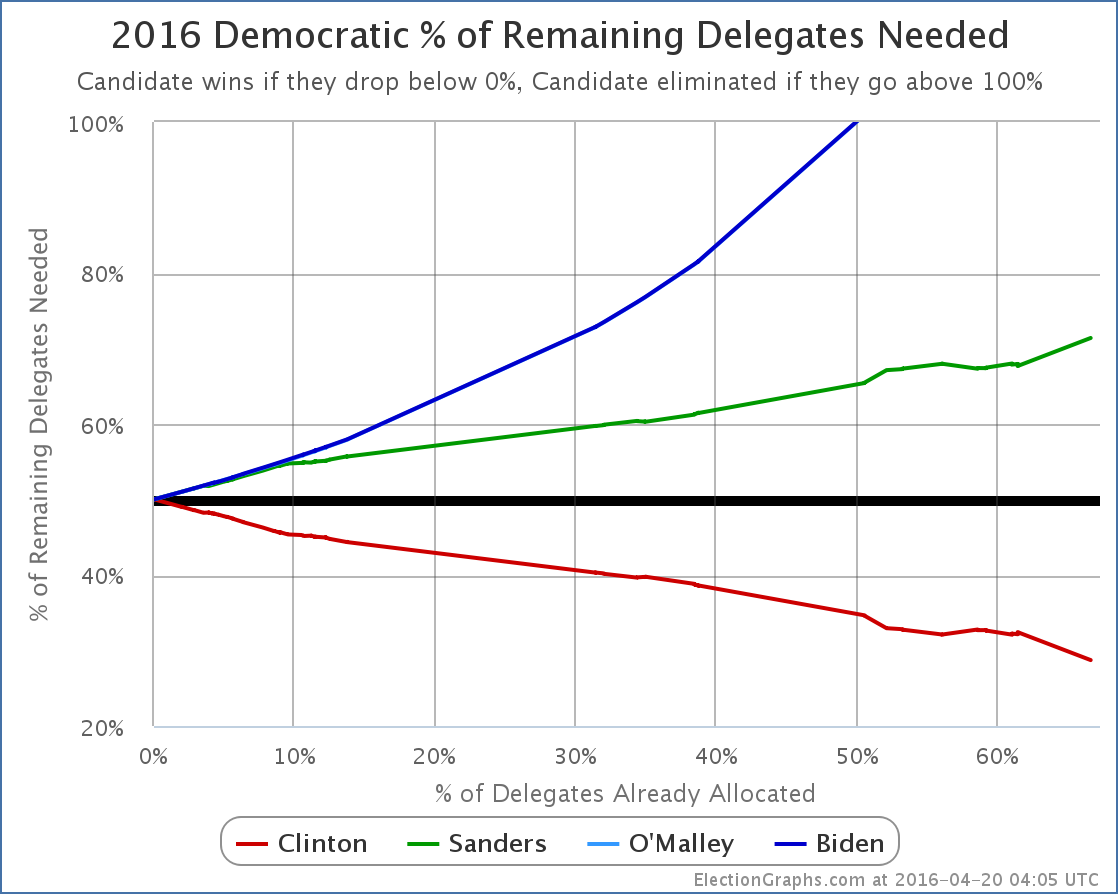
Sanders now needs 71.39% of the remaining delegates (including the remaining superdelegates) to catch up and win the nomination.
Meanwhile, Clinton only needs 28.73% of the remaining delegates.
Or, as always, this changes if a massive wave of Clinton superdelegates start changing their minds and going over to Sanders. That hasn’t happened so far, and absent the Clinton implosion discussed earlier, is very unlikely to happen now.
We will probably still keep hearing about it not being over until the vote at the convention because the superdelegates might change their minds though. Because they CAN change their minds. But they tend not to. It is over. It has been for a long time.
Absent the Clinton implosion of course.
[Edit 16:42 UTC to add the raw delegate totals.]
[Update 2016-04-24 00:13 UTC – Superdelegate scan: Clinton +2]
[Update 2016-04-26 16:18 UTC – Superdelegate scan and updates in Illinois and Ohio. Net change: Clinton +3, Sanders +1.]
[Update 2016-04-27 16:55 UTC – Superdelegate scan: Clinton +4]
Note: This post is an update based on the data on ElectionGraphs.com. Election Graphs tracks both a poll based estimate of the Electoral College and a numbers based look at the Delegate Races. All of the charts and graphs seen in this post are from that site. Additional graphs, charts and raw data can be found there. All charts above are clickable to go to the current version of the detail page the chart is from, which may contain more up to date information than the snapshots on this page, which were current as of the time of this post. Follow @ElectionGraphs on Twitter or like Election Graphs on Facebook to see announcements of updates or to join the conversation. For those interested in individual general election poll updates, follow @ElecCollPolls on Twitter for all the polls as they are added.
|
|