There has been a lot of recent press about new national polls of the Clinton vs Trump race. Nobody should look at individual polls of course, but there have been enough polls now to move the averages. RCP has Trump +0.2%. Pollster has Clinton +1.6%. Pollster includes more polls and has a more sophisticated methodology, but the core result is the same… a close Clinton vs Trump race, and much closer than what looked to be the case a few weeks ago.
So what do we see looking at the electoral college view? Well, first of all, keep in mind that individual states tend to be polled less often than we get national polls, and some states are polled more often than others. So a state by state view like the one here, at least at this stage in the cycle, will react more slowly to rapid changes than the national numbers. If there is a big national change, you simply have to wait long enough to there to be enough new polls in enough states to move the state averages and then the national summary.
Since the last time I posted about a national model change on May 11th, there have been new general election polls in Oregon, Louisiana, Georgia (x2), Utah, New Hampshire, Arizona, New Jersey, Tennessee, Indiana, Florida (x3), Virginia, California, and Ohio. Of all of these, only the Florida polls have made a difference in my national summary.
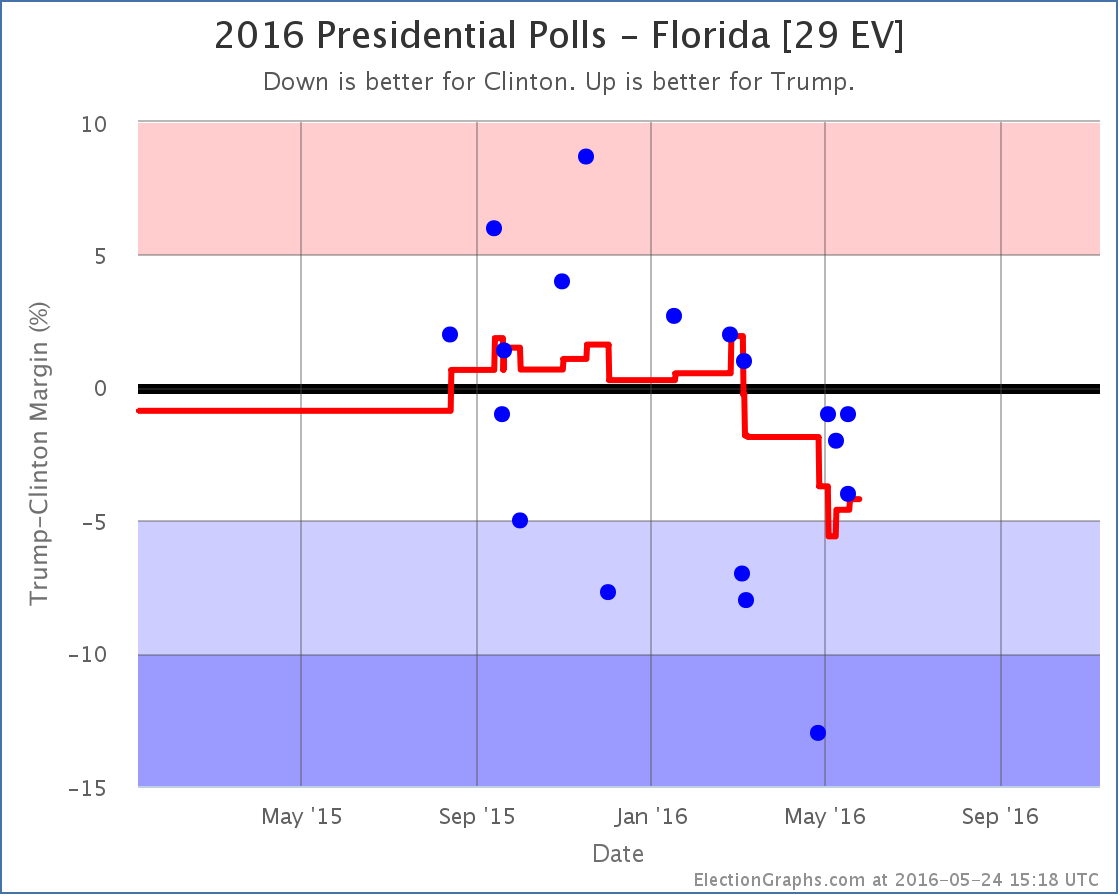
The three new polls, one of which was from early May but was only released a few days ago, all show Clinton ahead, but by less than 5%. This pulls Clinton’s lead back under 5%, specifically to a 4.2% lead.* The oldest poll in the average at the moment, showing a 13% Clinton lead, is now looking very much like an outlier, so it would not be surprising to see this look even closer when the next new poll is released.
This essentially reverses the changes from the May 11th update, and puts Florida back in play as a possible pick up for Trump.
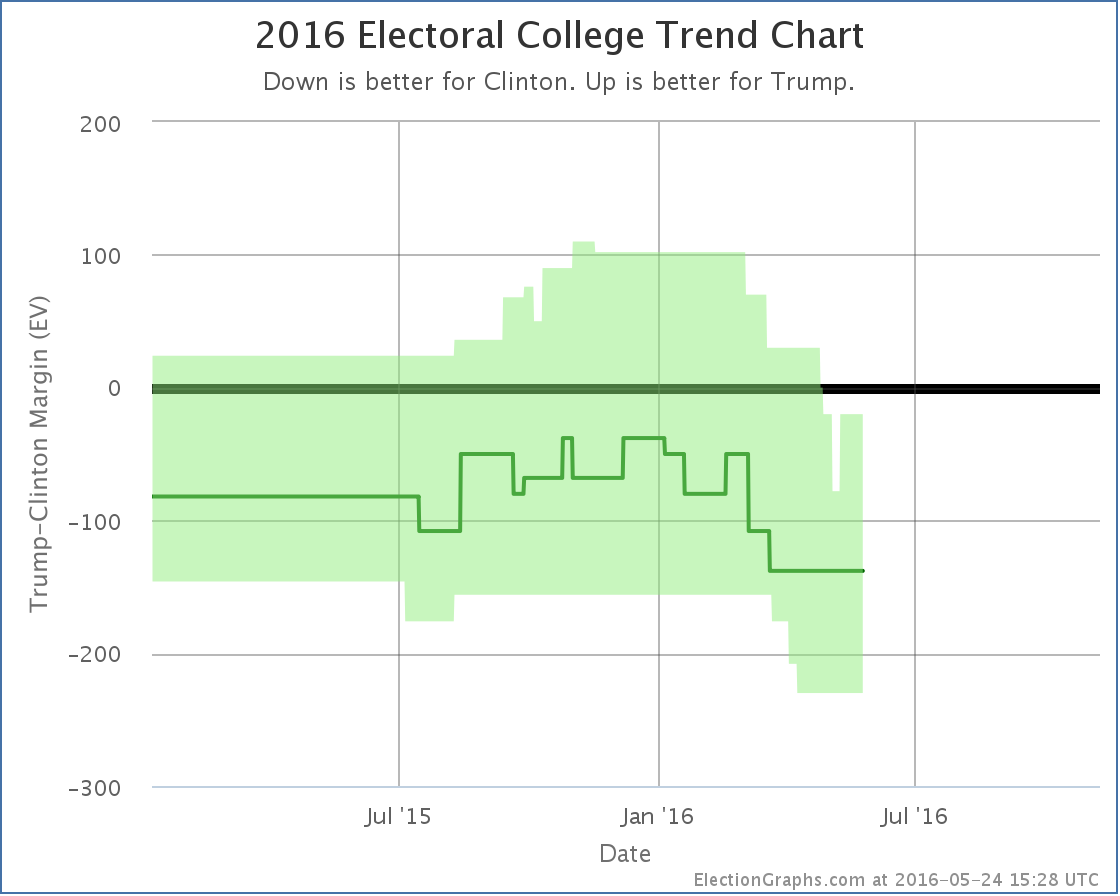
With Florida a possibility again, if Trump wins all the states he leads, plus all the states where Clinton is ahead by less than 5%, we end up at Clinton 279, Trump 259 – A 20 electoral vote win for Clinton.
Since Florida was the tipping point state, this also moves the tipping point:
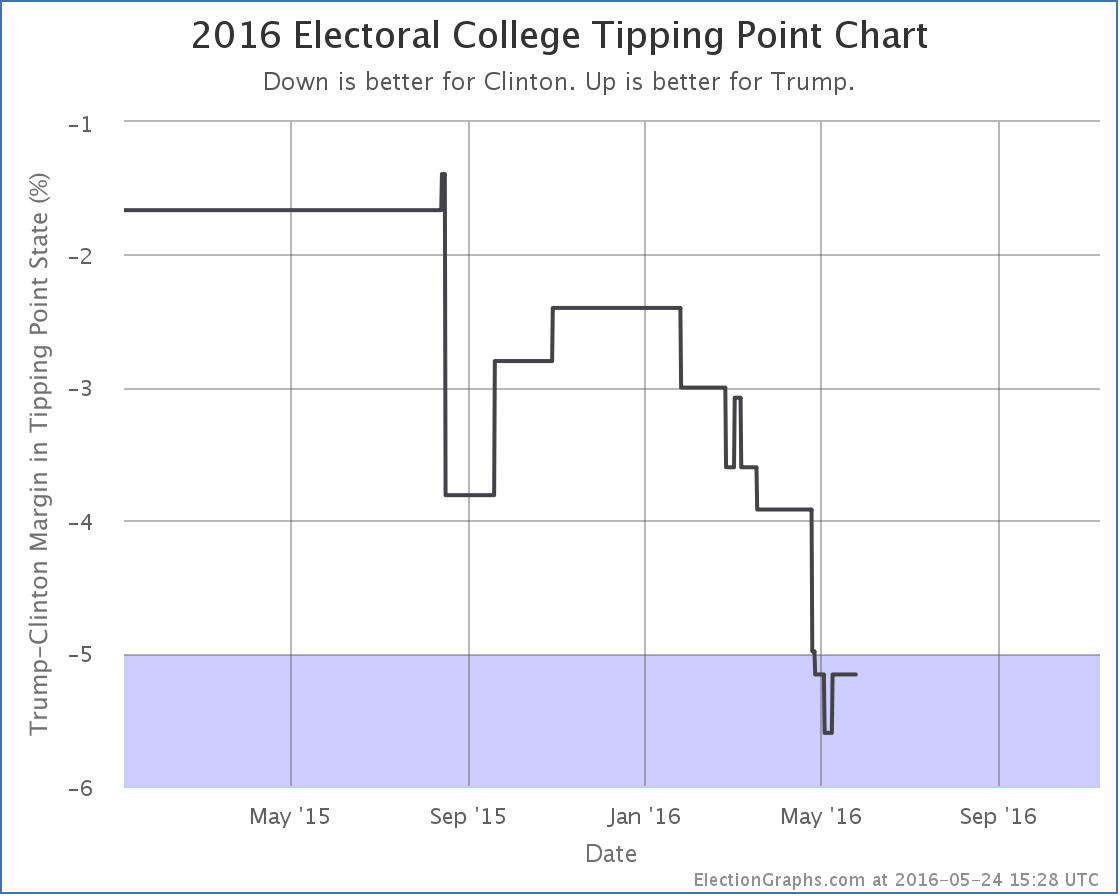
The new tipping point is North Carolina, where Clinton leads by 5.2%.
Trump’s “best case” is still to lose at the moment. But it is closer than it looked before.
So, the natural question here, especially given the national polls, is if this represents the end of the decline Trump has been suffering since January, and the start of a process where the state by state race starts looking as close as the national race polling averages would indicate.
The only real answer to that is that it is too soon to tell and we need to wait for more state polls to see if we see other states moving. But it would not be surprising if we see exactly that in the next few weeks.
With the results of both primary races essentially settled, but with Trump rapidly consolidating his party while Clinton is still dealing with Sanders, a tightening makes a lot of sense.
As Trump turns his attention to the general election, he will also presumably presumably do the traditional “pivot” to start courting voters that may have been turned off by his performance in the primaries. There have already been a number of moves in this direction.
We may have just seen Trump’s low point and the beginning of his rebound. Or this may be a blip. We shall see soon enough. The pace of new state level general election polls is quickening.
168.2 days until polls start to close on election night. A lot will happen in that time. Stay tuned.
* For anybody watching really carefully, because of the order in which I found these polls, two were added on Sunday and with those the chart showed a move from Strong Clinton to Weak Clinton on the 8th based on the poll that was taken in early May but released just last week, with a return to Strong Clinton on the 18th with a more recent poll. Since there was no net change from the addition of these two polls, even though they created a move back and forward on the charts, I did not do a post on Sunday. With a new poll added today that has the same middate in the field as the later of the two polls I added Sunday, the return movement that had been on the 18th was erased and there was now an overall change prompting this post. It looks odd that the movement on the chart is from the 8th, but I am not posting about it until the 24th, but the above is why.
Note: This post is an update based on the data on ElectionGraphs.com. Election Graphs tracks both a poll based estimate of the Electoral College and a numbers based look at the Delegate Races. All of the charts and graphs seen in this post are from that site. Additional graphs, charts and raw data can be found there. All charts above are clickable to go to the current version of the detail page the chart is from, which may contain more up to date information than the snapshots on this page, which were current as of the time of this post. Follow @ElectionGraphs on Twitter or like Election Graphs on Facebook to see announcements of updates or to join the conversation. For those interested in individual general election poll updates, follow @ElecCollPolls on Twitter for all the polls as they are added.
Nomination Bounce:
Trump’s “best” EV outcome goes from Clinton+78 to Clinton+20
https://t.co/IWVLLp6pK2 @Johngcole https://t.co/5jpRhSL1Io
@minerjp @DigiVorr Bounce:
Trump’s “best” EV outcome goes from Clinton+78 to Clinton+20
https://t.co/IWVLLp6pK2
https://t.co/5jpRhSL1Io