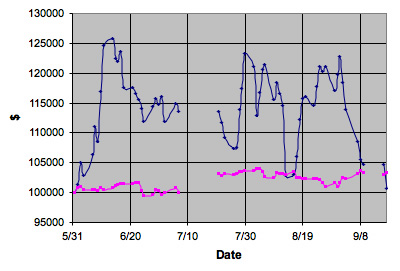
So, over the last few months, I once again started tracking a “stock scheme” that I have played with once every couple of years all the way back to college. This time I did it for a longer time period than any of the other times. The above is how it did. This covers 60 trading days, although there are a couple gaps when I was out of town or whatever and didn’t track it. I just assumed that I didn’t apply the scheme those days.
It started out really well, but then langished, and in the last few days lost all the gains it had made. Kinda dissapointing. The first chart is how $100,000 invested in this scheme would have done over time, using a $7 per trade fee structure. As you can see, in the first few days I would have gotten lucky and made about 25%. Then it just bounced up and down (mostly down) from then on. At the end of the 60 days, I still was up from the starting point, but trailed where I would have been just buying an S&P index (that’s the other line… SPY). Of course, given the way this particular thing works, with actual fees, it would indeed take pretty much $100K to still be above water. Oh well.
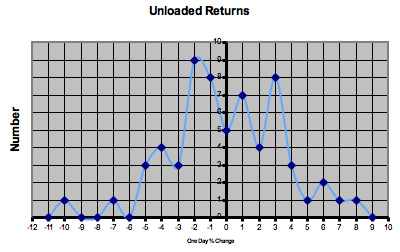
The second chart shows a histogram of each days performance (with no fees). As I started, the histogram had a bulge on the negative side, but a longer tail on the positive, thus making the overall average just positive enough to make money. But as more and more data got collected, it looked more and more like a standard bell curve centered on zero.
Oh well.
I’d like to play with more of these models, but automation is in order. I did this by trying to remember every afternoon in the hour before the market closed to check the prices of a set of stocks under consideration. (The link goes to a sample.) The based on those prices and the changes from the previous day, I pick one for the next day. Of course, in real life, I check at slightly different times each day and as mentioned, there were a few gaps where I did not check at all.
Anybody got a good tool or could script one that at a specific time of day would go to the page I linked to, grab all the stock symbols and associated prices and dump them to a common file format that I could go back and analyse after having just let the thing run and collect data for a few months. Try different scheme variations on it and such.
Not that I really expect to find something that will make real cash if used (although if I did that would be cool). But just cause I like playing with this sort of stuff and like making graphs and stuff.
Leave a Reply
You must be logged in to post a comment.