This is the website of Abulsme Noibatno Itramne (also known as Sam Minter). Posts here are rare these days. For current stuff, follow me on Mastodon

Categories

Calendar

September 2015
S M T W T F S
 12345
6789101112
13141516171819
20212223242526
27282930  

Electoral College: Rubio takes lead in North Carolina, makes it close in Michigan

It is getting boring to keep saying “Republican getting stronger against Clinton”, but it is time for yet another update saying just that. As has been common lately, the Republican in question is Rubio, so lets look at these moves:
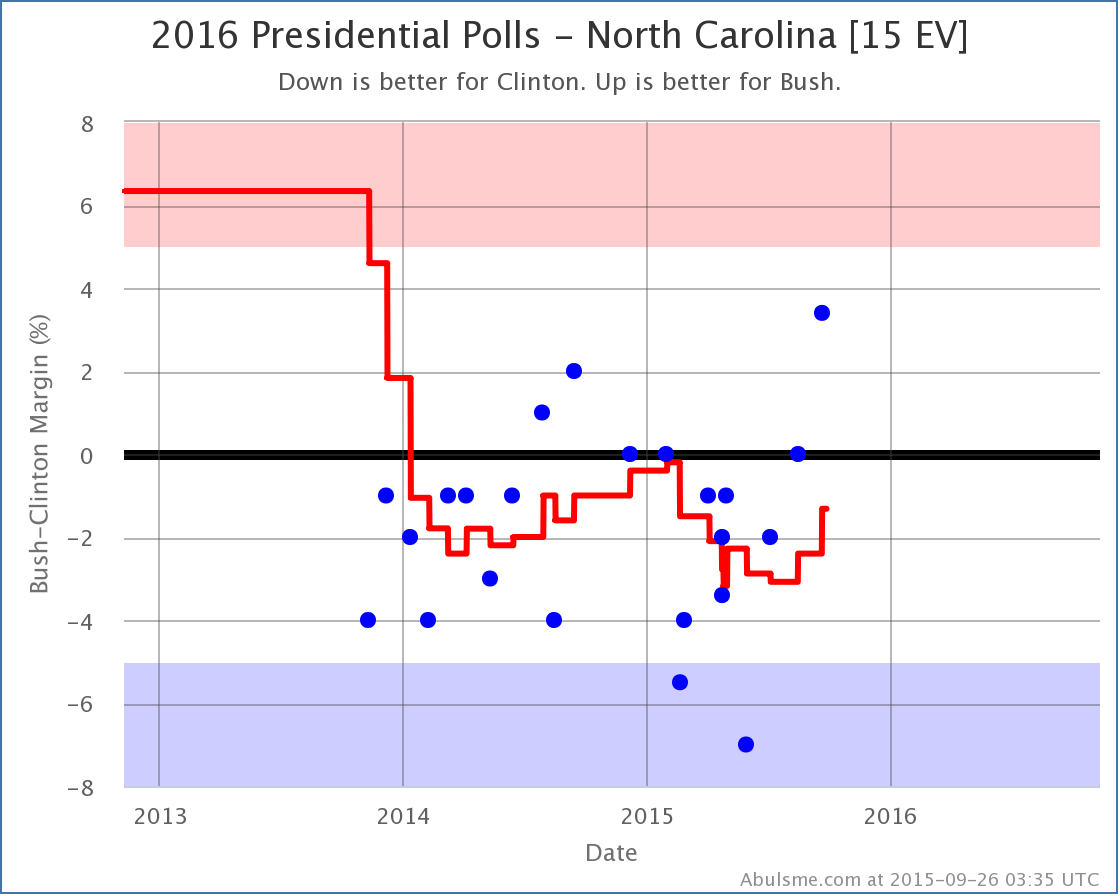
North Carolina

chart-89

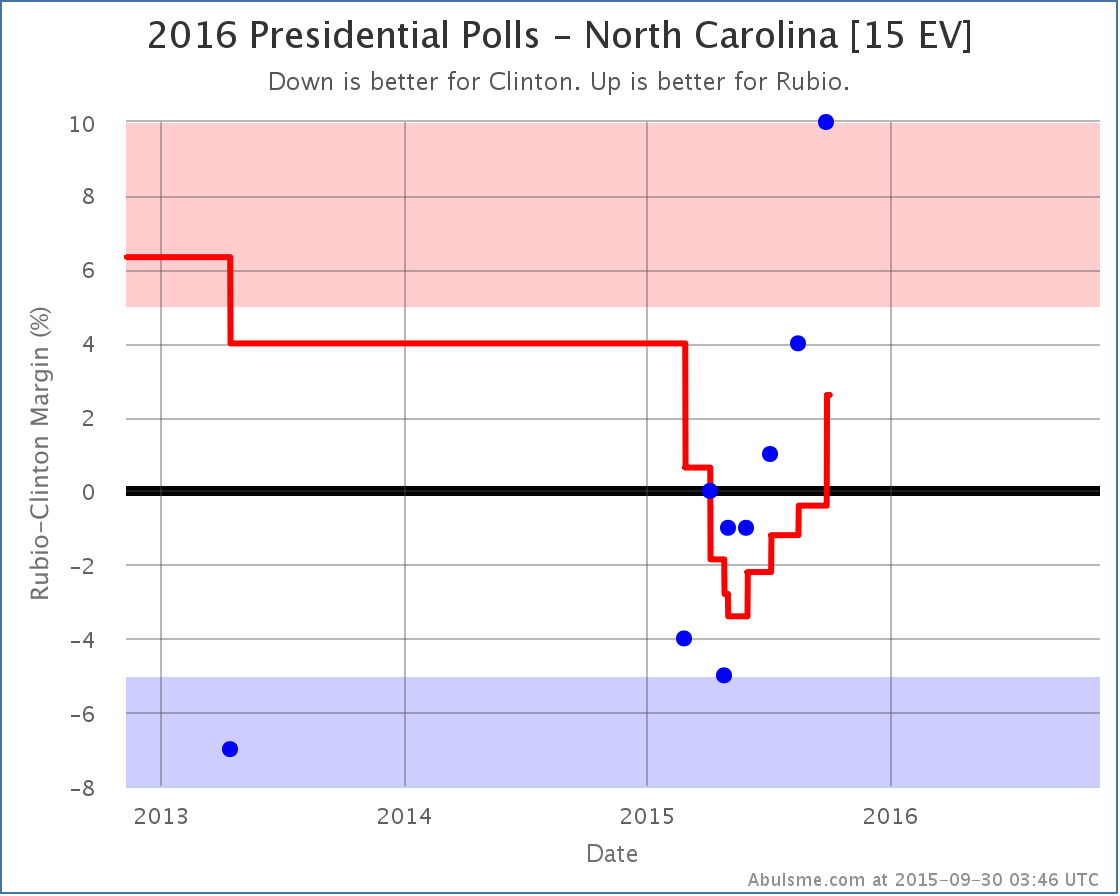
Look at that trend! It just gets worse and worse for Clinton. Every new poll in the last few months has been worse than the poll before. And with the latest, the average flips to Rubio’s side of the line.

North Carolina was never going to be a blow out for Clinton, but it was looking for awhile that she was in a good position to pull out a narrow win. That possibility seems to be evaporating quickly.

Michigan

chart-91

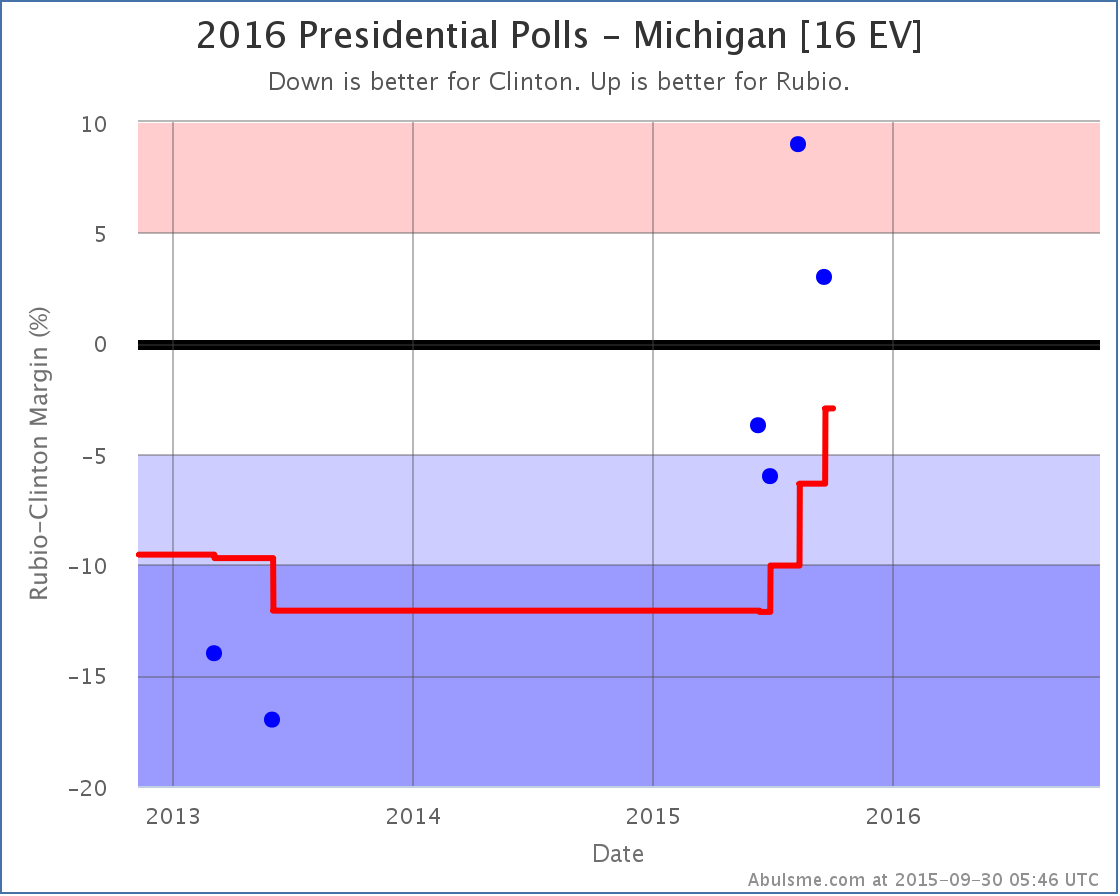
There are less polls to back it up, but the move in Michigan is potentially more dramatic. In a few months the average has gone from a strong Clinton lead, to Michigan essentially being a toss up.

Once again, not a good trend for Clinton. Michigan has not gone Republican since voting for George HW Bush in 1988. In 5 of those 6 elections the winning margin for the Democrats was over 5%. In two of them it was over 10%. A close Michigan means a Clinton in trouble.
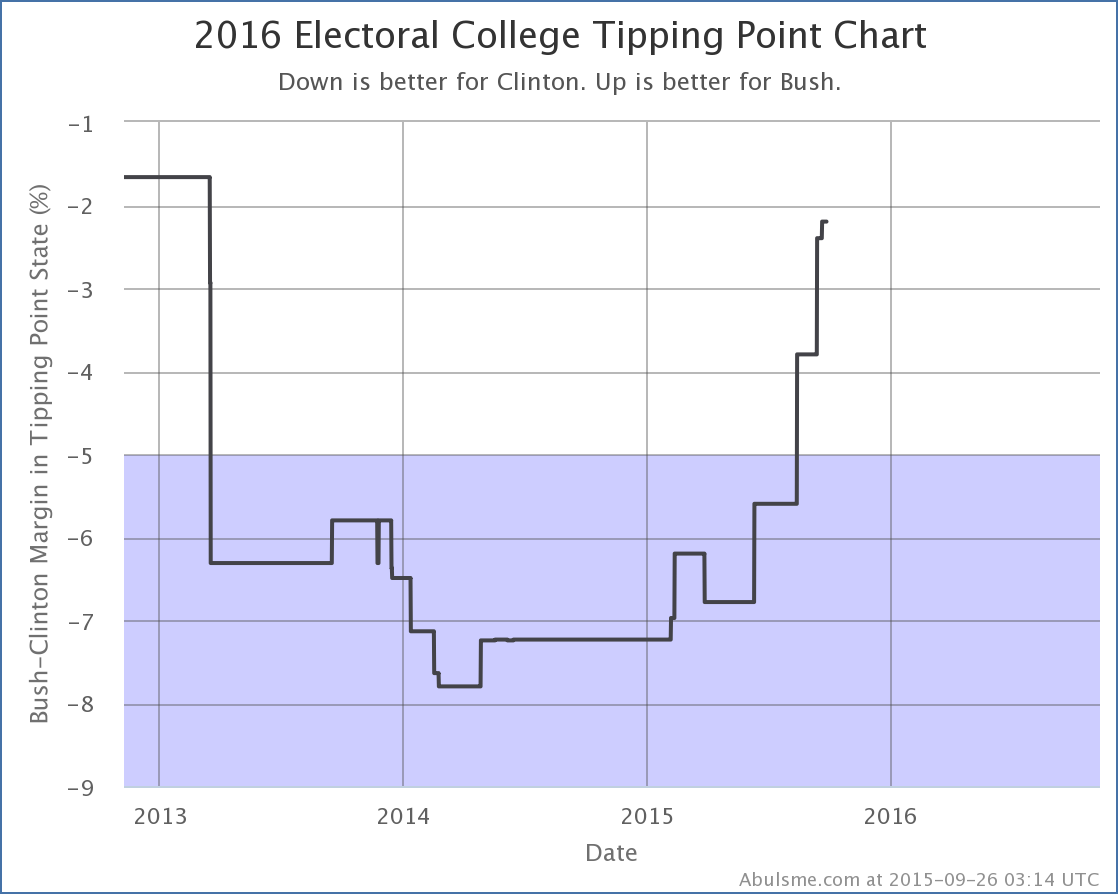
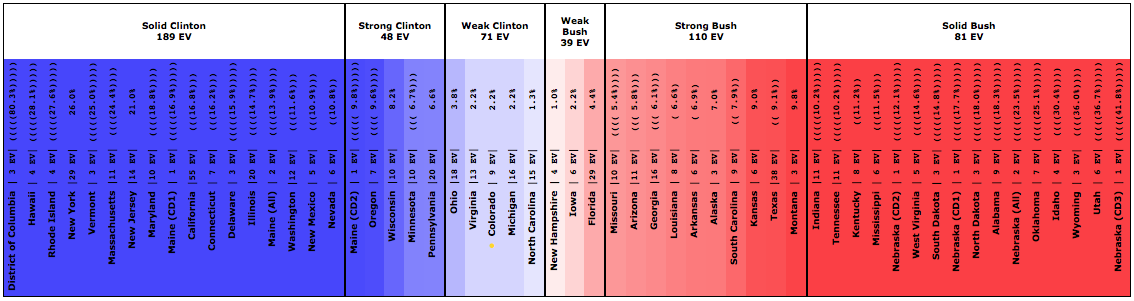
National Overview

chart-92

Screen Shot 2015-09-30 at 14.56.56206

Screen Shot 2015-09-30 at 14.59.00497

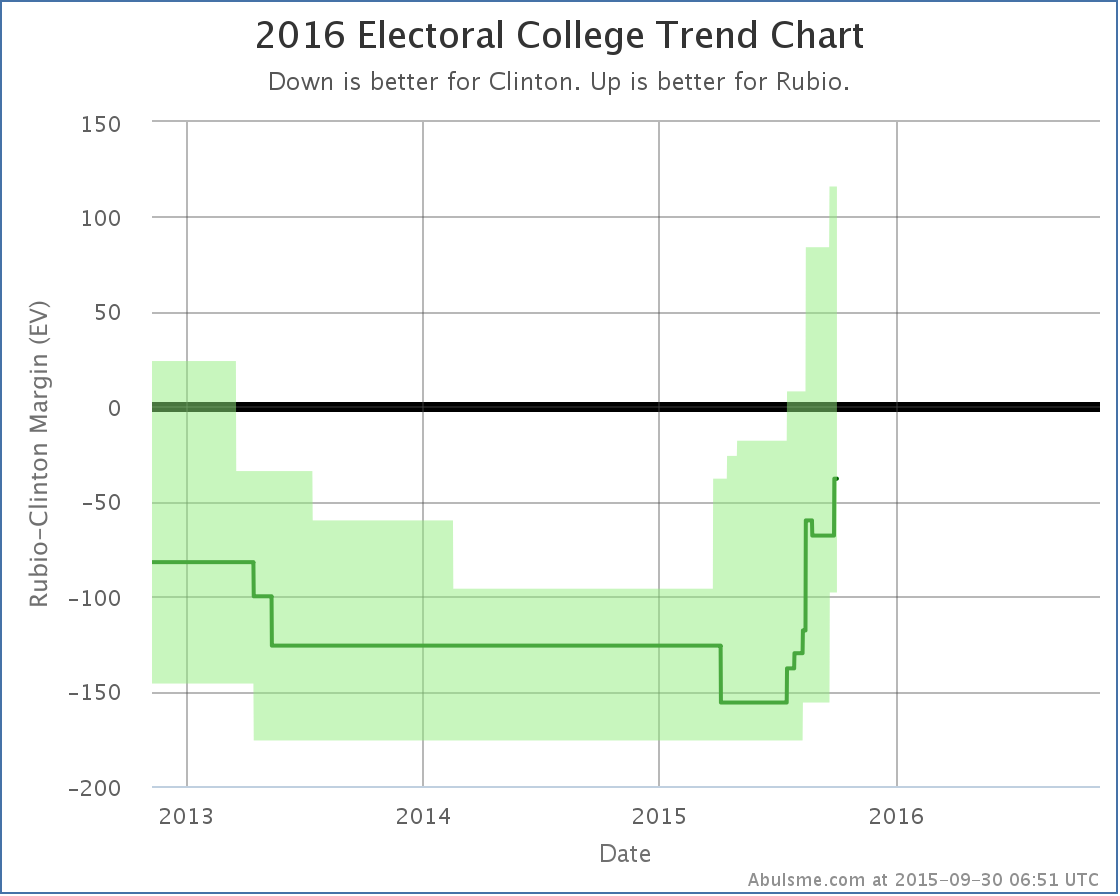
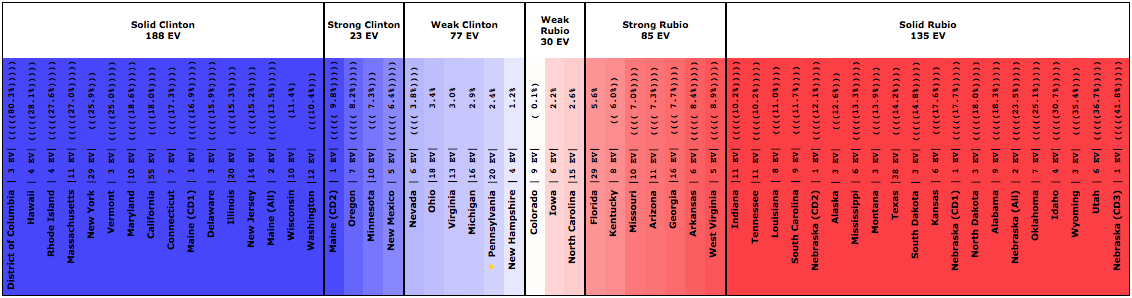
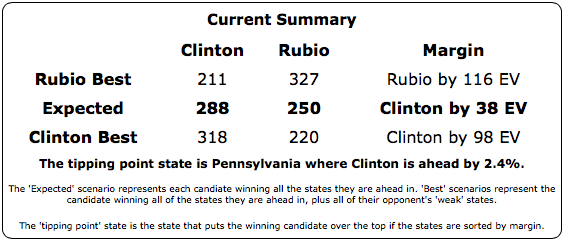
Yes, if everybody wins the states where they are leading in my poll average, Clinton still wins… barely. But there are a HUGE number of states where it is close. In this matchup, nine states are in play and the range of possible outcomes is very wide. Right now Rubio’s best case (if he sweeps all the close states) is actually better than Clinton’s best case (if she sweeps the close states).

Clinton still has an advantage here, but just by the slimmest of margins. There is a long way to the election, but for the moment, at least in the Clinton vs Rubio matchup, this is a close race…

Other Candidates

So Rubio is doing well against Clinton, and that is the only one of the five best polled candidate combinations with a change today, but a quick look at the comparison is still useful.

chart-93

chart-94

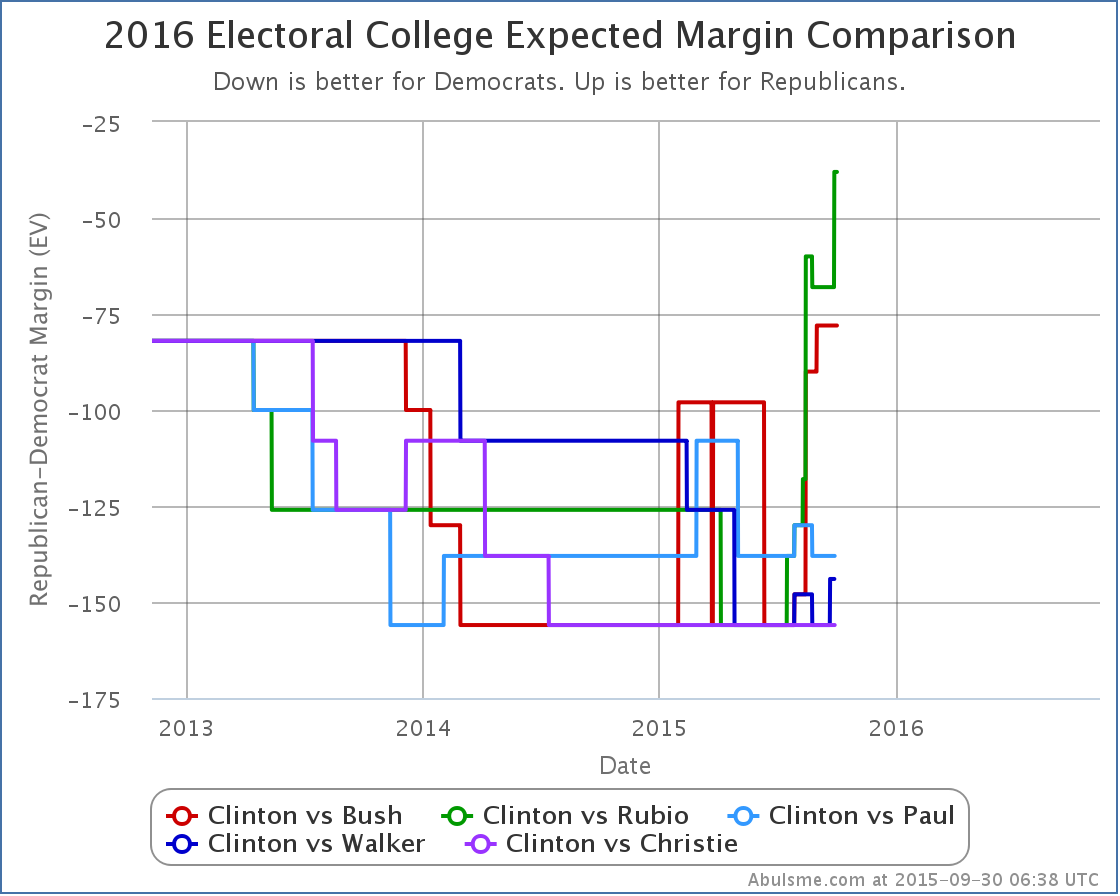
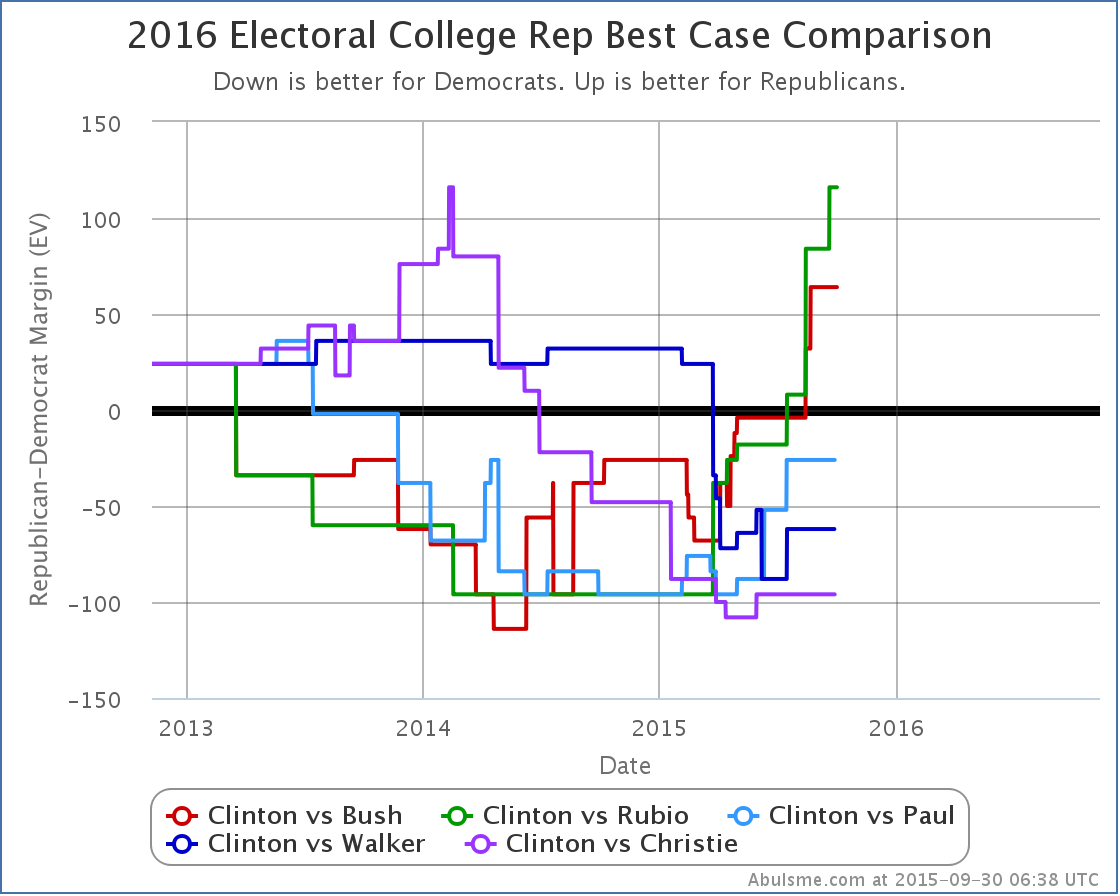
Highlighting these two comparisons specifically because of the Rubio changes today, but similar trends show up for the other comparisons. Of the five best polled combinations, Bush and Rubio are standing out and have been dramatically improving their positions vs Clinton. Paul, Walker and Christie… have not. At least not lately. Of course, Walker has already dropped out at this point, and Christie and Paul are on life support, with their national Real Clear Politics polling averages at 3% or less right now. So they just aren’t getting the attention… or the polling volume lately… of Bush and Rubio.

As I’ve mentioned before, other candidates are getting a lot more attention now, but they are still way behind these five in the arbitrary polling quality metric I use. They just haven’t had enough sustained polling to get a comparable picture yet. That will change if the folks like Trump and Carson and Fiorina remain viable and folks like Paul, Walker and Christie fade away. Same thing for Sanders and Biden. It just takes a bit of time to get enough good state polls to start paying serious attention to the results in an analysis like this.

405.1 days until polls start to close.

Note: This post is an update based on the data on ElectionGraphs.com. All of the charts and graphs seen here are from that site. Graphs, charts and raw data can be found there for the race nationally and in each state for every candidate combination that has been polled at the state level. In addition, comparisons of the best polled candidate combinations both nationally and each in each state are available. All charts above are clickable to go to the current version of the detail page the chart is from, which may contain more up to date information than the snapshots on this page, which were current as of the time of this post. Follow @ElecCollPolls on Twitter for specific poll details as I add them.

@abulsme tweets from 2015-09-29 (UTC)

@abulsme tweets from 2015-09-28 (UTC)

My Supermoon Eclipse Pics

Since everybody is posting these, figure I will too. :-)

image

02:44 UTC

image

03:20 UTC

Both from just south of Everett, WA.

@ElecCollPolls tweets from 2015-09-27 (UTC)

  • 20:55:13 A bunch of minor errors in my data were fixed today, mostly poll sample sizes and a few dates. Thanks to @hominidviews for the corrections.
  • 20:57:15 None of the changes impacted the overall analysis, but they may be important to anyone using my raw poll list for their own analysis.

@abulsme tweets from 2015-09-27 (UTC)

@ElecCollPolls tweets from 2015-09-26 (UTC)

@abulsme tweets from 2015-09-26 (UTC)

Electoral College: The Drumbeat Continues, Clinton keeps slipping

Aside from that one blip of good news in August every single update I’ve posted in many months has been more bad news for Clinton. This update is no exception, with two changes worth noting, both in favor of the Republican.

Clinton vs Bush

chart-85

The new poll in North Carolina didn’t shift move the state to a new category, but the move from a Clinton lead of 2.4% down to a Clinton lead of 1.3% moved the tipping point, which had been North Carolina. With North Carolina shifting Bushward, the tipping point becomes Colorado, where Clinton is ahead by 2.2%.

chart-86

This is a relatively small blip upward for the tipping point, but it continues the trend. This race just keeps getting closer. Remember, the tipping point is how far polls have to move nation wide in order to flip the result of the election. The gap is now only 2.2%. That is tiny. A 2.2% lead can disappear over night, or be an illusion cased by a bias in the polls. Right now, Bush and Clinton are effectively neck and neck. Yes, Clinton has a lead, but it is extremely narrow.

The spectrum of the states now looks like this:

Screen Shot 2015-09-26 at 04.05.54723

Clinton’s buffer is down to just Colorado, Michigan and North Carolina, all states where her lead is less than 2.2%. We’re only a few Republican leaning polls in those three states away from having a Republican in the lead for the first time since I launched this site.

Clinton vs Walker

Well, he dropped out. But a poll in Iowa that included him wrapped up just before his announcement. And that poll was good for Walker. So, one last hurrah…

chart-87

With this last poll… and it will be surprising if there are any more with Walker… Walker takes a narrow lead vs Clinton, and so moved Iowa into his column, increasing his “expected” result against Clinton…

chart-88

He increases his expected result to… losing by 144 electoral votes! Well, OK, Walker wasn’t the most competitive of the Republican candidates against Clinton.

Goodbye Walker.

409.8 days until polls start to close.

Note: This post is an update based on the data on ElectionGraphs.com. All of the charts and graphs seen here are from that site. Graphs, charts and raw data can be found there for the race nationally and in each state for every candidate combination that has been polled at the state level. In addition, comparisons of the best polled candidate combinations both nationally and each in each state are available. All charts above are clickable to go to the current version of the detail page the chart is from, which may contain more up to date information than the snapshots on this page, which were current as of the time of this post. Follow @ElecCollPolls on Twitter for specific poll details as I add them.

@ElecCollPolls tweets from 2015-09-25 (UTC)