Well, last for tonight anyway, it is way past my bedtime.
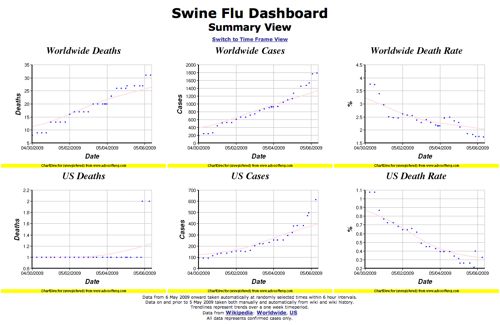
I switched things around so the main page of the Swine Flu Dashboard is a “Summary View” with only the “all data so far” graphs of the six things being tracked (deaths, cases and death rate worldwide and US only). For these I changed the trend line to be based off of a one week time period. There isn’t yet a full week of data, so that means the entire trend line may still shift. Parts of it will turn red once those parts are “fixed”.
I have then moved off onto a separate “time frame view” looks at each of those six numbers on a “previous week”, “previous month” and “previous year” basis. Obviously these will be more interesting once there is data over a longer time period. For this view I’ve made the trend lines dependent on which time frame you are looking at. They are based on 2 days for the weekly view, 2 weeks for the monthly view and 2 months for the yearly view.
Anyway… that’s it for tonight.

Leave a Reply
You must be logged in to post a comment.