This is the website of Abulsme Noibatno Itramne (also known as Sam Minter).
Posts here are rare these days. For current stuff, follow me on Mastodon
|
Standard Into:
This is the latest in a series of quarterly posts on congressional legislative output. I started these in June 2013 in response to a flurry of commentary about how the 113th congress was lagging behind in output compared to previous congresses. Now, it is fundamentally debatable if passing fewer laws is a good thing, a bad thing, or just a completely meaningless number since of course the impact of laws varies widely. I’m guessing in reality, it is a pretty meaningless number.
But I noticed that in many of these debates, there was a lack of rigor in the ways these numbers were used. For instance, it seemed common to compare the current number of laws passed in the 113th, to the TOTAL passed in the 112th or 111th. Or maybe talking about the “pace” at which legislation was being passed as if there was an expectation that this would continue linearly. Never did I hear a comparison that actually looked specifically at where the previous congresses had been at the same point in the cycle. So I made one.
Now the new stuff:
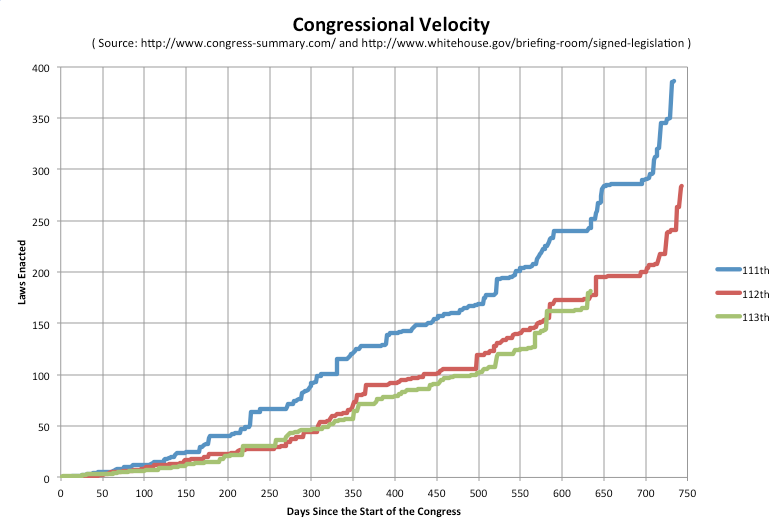
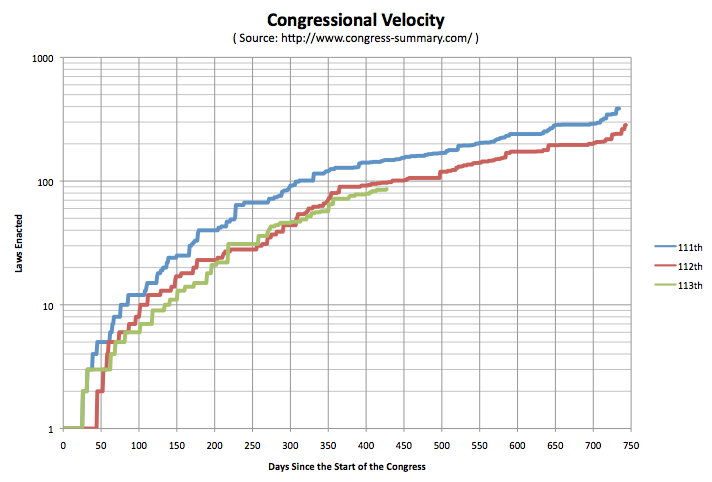
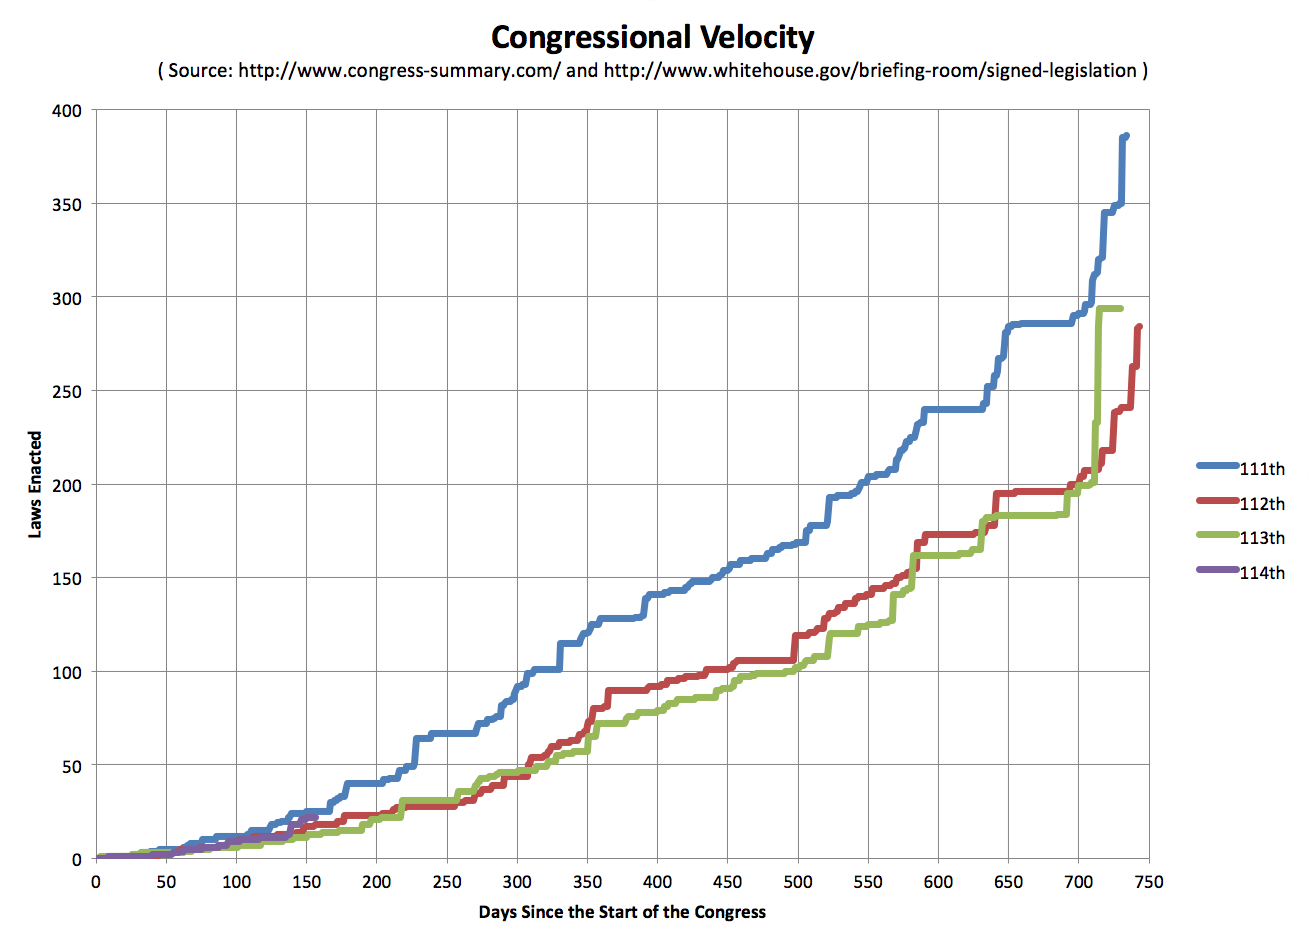
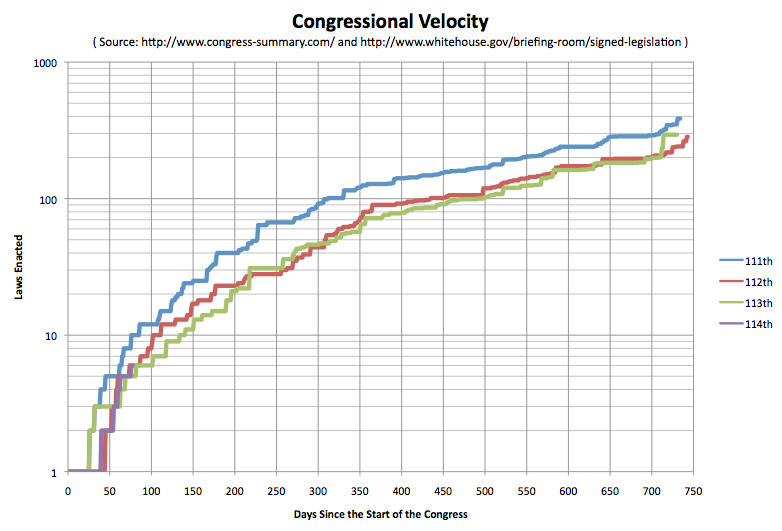
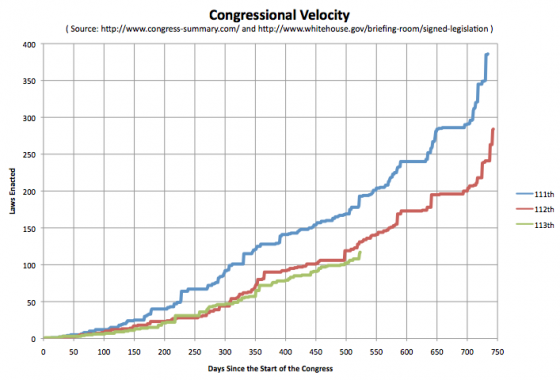
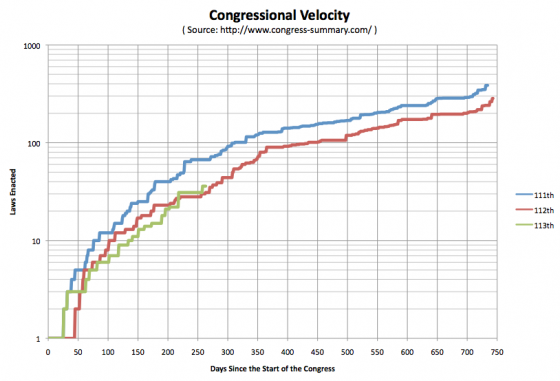
The 114th congress is now past their first 100 days. Past 150 in fact. So lets check in on how they are doing at the whole making laws thing. Bottom line, they have produced more signed laws than either the 112th or 113th congresses at this point in the cycle, and they are actually not that far behind the 111th.
Here are the graphs:
Standard Into:
This is the latest in a series of quarterly posts on congressional legislative output. I started these in June 2013 in response to a flurry of commentary about how the 113th congress was lagging behind in output compared to previous congresses. Now, it is fundamentally debatable if passing fewer laws is a good thing, a bad thing, or just a completely meaningless number since of course the impact of laws varies widely. I’m guessing in reality, it is a pretty meaningless number.
But I noticed that in many of these debates, there was a lack of rigor in the ways these numbers were used. For instance, it seemed common to compare the current number of laws passed in the 113th, to the TOTAL passed in the 112th or 111th. Or maybe talking about the “pace” at which legislation was being passed as if there was an expectation that this would continue linearly. Never did I hear a comparison that actually looked specifically at where the previous congresses had been at the same point in the cycle. So I made one.
Now the new stuff:
The 113th congress is over. No new laws were signed after my December update. So the 113th ended up with 294 bills signed compared to 239 in the 112th and 249 in the 11th.
But now the 114th congress is in session. How is that going so far?
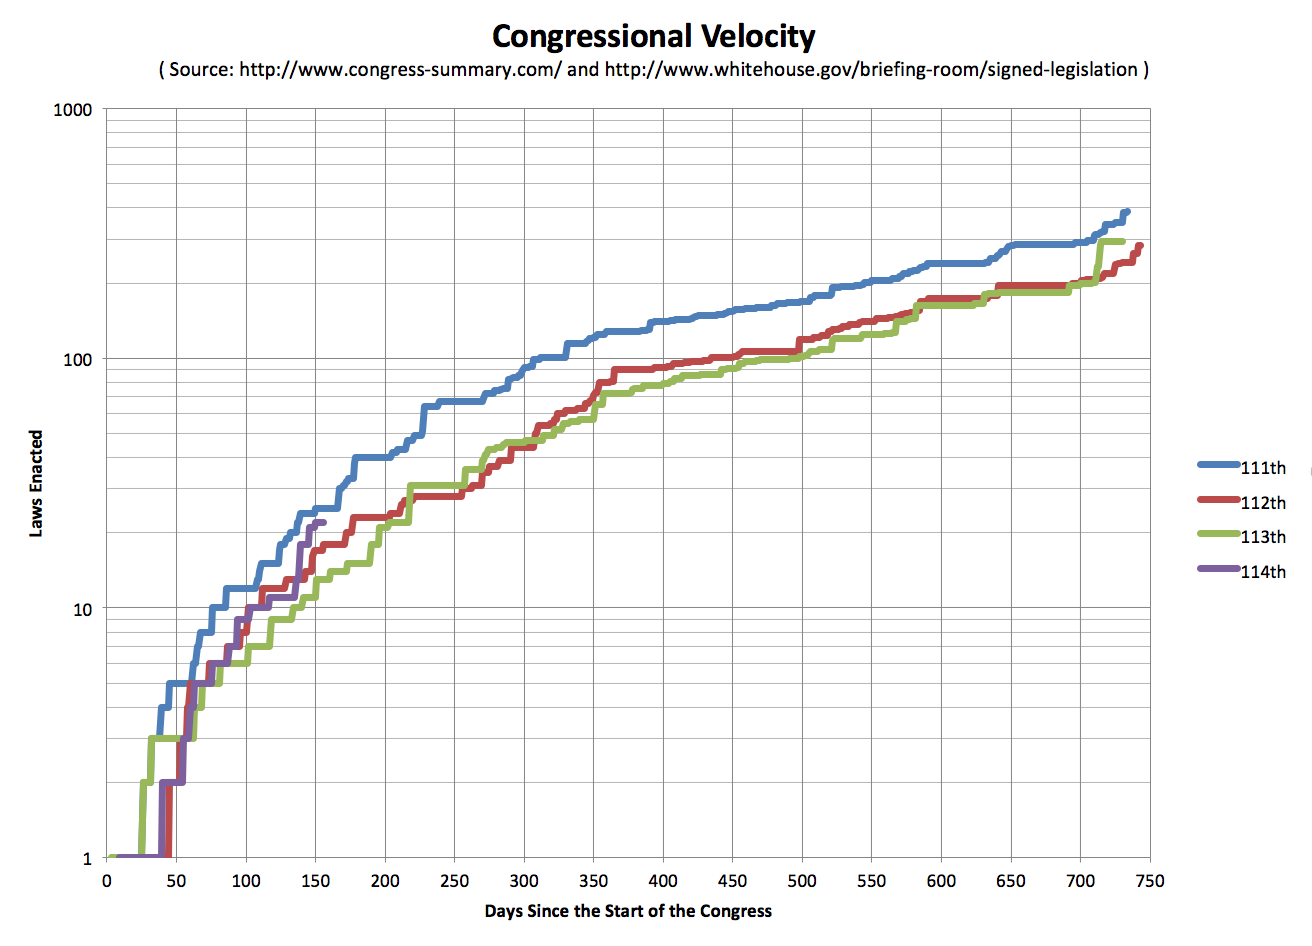
As of March 20th, the 76th day of the new congress, 6 bills have been signed into law:
- Terrorism Risk Insurance Program Reauthorization Act of 2015
- Clay Hunt Suicide Prevention for American Veterans Act or the Clay Hunt SAV Act
- Protecting Volunteer Firefighters and Emergency Responders Act – to fund the Department of Homeland Security through March 6, 2015
- An Act making appropriations for the Department of Homeland Security for the fiscal year ending September 30, 2015, and for other purposes.
- An Act to award a Congressional Gold Medal to the Foot Soldiers who participated in Bloody Sunday, Turnaround Tuesday, or the final Selma to Montgomery Voting Rights March in March of 1965,…
- Office of Compliance Administrative and Technical Corrections Act of 2015
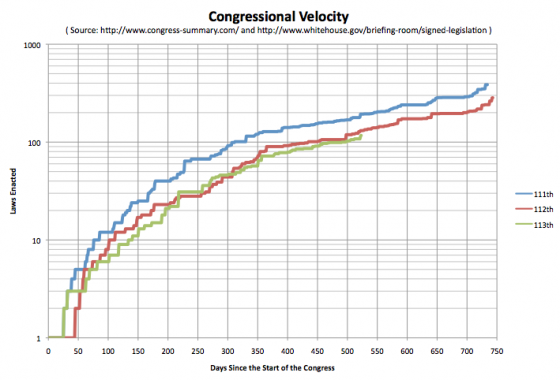
At the same time in the last few congresses, the 113th had 5 laws, the 112th had 6 laws, and the 11th had 10 laws. So for this time in the cycle, we’re pretty much right in line with the last two congresses, and just a tad behind the 111th.
Here are the graphs:
Standard Into:
This is the latest in a series of quarterly posts on congressional legislative output. I started these in June 2013 in response to a flurry of commentary about how the 113th congress was lagging behind in output compared to previous congresses. Now, it is fundamentally debatable if passing fewer laws is a good thing, a bad thing, or just a completely meaningless number since of course the impact of laws varies widely. I’m guessing in reality, it is a pretty meaningless number.
But I noticed that in many of these debates, there was a lack of rigor in the ways these numbers were used. For instance, it seemed common to compare the current number of laws passed in the 113th, to the TOTAL passed in the 112th or 111th. Or maybe talking about the “pace” at which legislation was being passed as if there was an expectation that this would continue linearly. Never did I hear a comparison that actually looked specifically at where the previous congresses had been at the same point in the cycle. So I made one.
Now the new stuff:
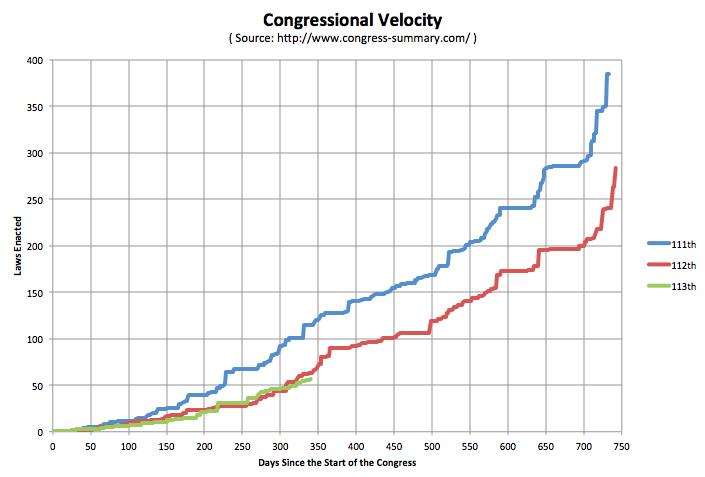
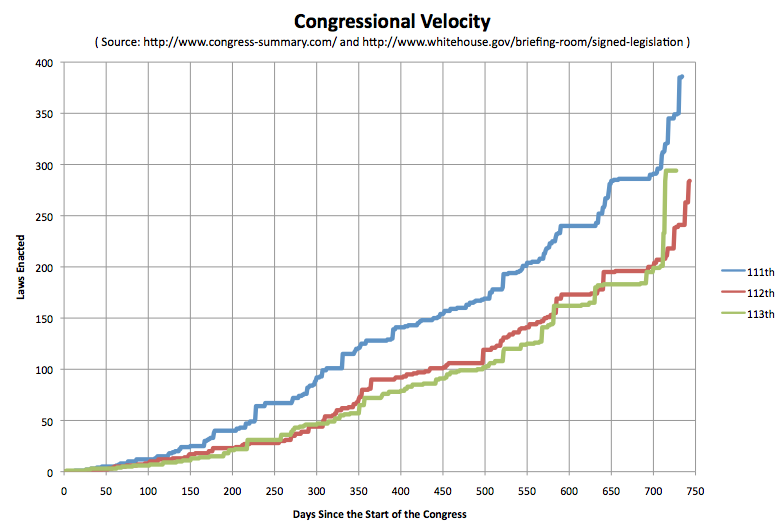
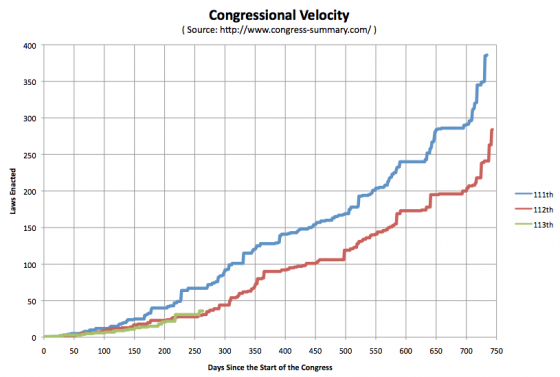
Bottom line, although the 113th Congress lagged slightly behind the 112th congress for most of its existence, with only a handful of short periods being ahead, on December 16th the president signed 32 bills into law, and the 113th pulled ahead of the 112th. Then on the 18th the president signed 51 more bills. On the 19th he signed 10 more. With all this activity the 113th left the 112th in the dust in terms of laws enacted.
So all the hand wringing about how little this congress got done (by this metric at least) in the end just disappears in a flurry of legislative activity during the lame duck congress. Now, as usual, many of these bills aren’t all that consequential, thus the caveats in the first paragraph. Never the less, the 113th matched and exceeded its predecessor in terms of number of laws enacted, and in fact even came close to the 111th.
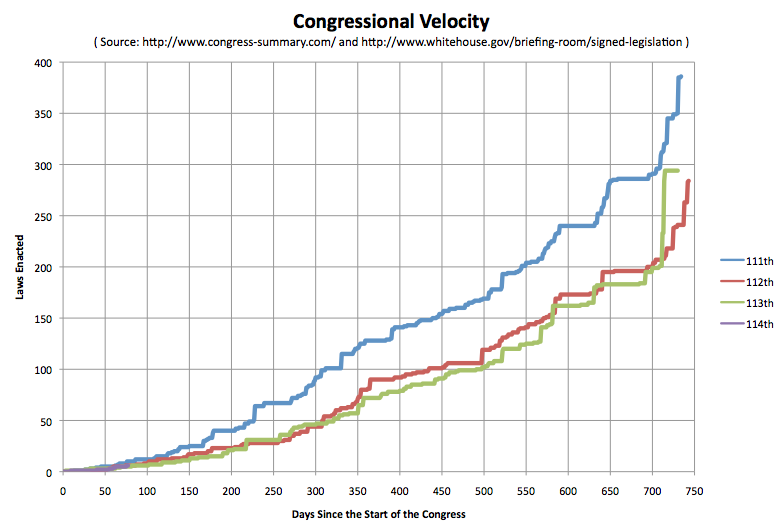
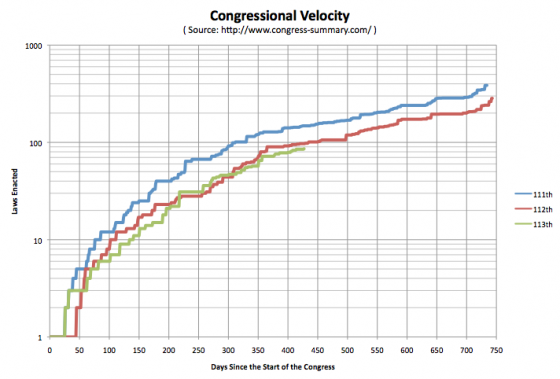
The totals for each of the three congresses on the 727th day of their existence (Dec 31st for the 113th and 111th, Dec 30th for the 112th):
- 111th: 349 bills passed and signed into law by the president
- 112th: 239 bills passed and signed into law by the president
- 113th: 294 bills passed and signed into law by the president
In both the 111th and 112th congresses, there were additional laws from that congress signed by the president well into January… even after the next congress took office on January 3rd. I’ll of course keep an eye out to see if that happens again, but with the big flurry of signing in mid December and congress not in session since then, it seems unlikely there will be much, if any, of that this time around.
Here are the graphs:
Next up, we’ll see how the 114th does!
This is the latest in a series of quarterly posts on congressional legislative output. I started these in June 2013 in response to a flurry of commentary about how the 113th congress was lagging behind in output compared to previous congresses. Now, it is fundamentally debatable if passing fewer laws is a good thing, a bad thing, or just a completely meaningless number since of course the impact of laws varies widely. I’m guessing in reality, it is a pretty meaningless number.
But I noticed that in many of these debates, there was a lack of rigor in the ways these numbers were used. For instance, it seemed common to compare the current number of laws passed in the 113th, to the TOTAL passed in the 112th or 111th. Or maybe talking about the “pace” at which legislation was being passed as if there was an expectation that this would continue linearly. Never did I hear a comparison that actually looked specifically at where the previous congresses had been at the same point in the cycle.
In fact, although there are some repeating patterns to be sure, legislation does not tend to be passed at a steady pace throughout the two years of a congress. Rather, it is very slow for the first six months, then tends to speed up to a more steady pace after that, which aside from fits and starts for vacations and “big days” when the congress passes many small non-controversial laws, continues up until the next election day… then lawmaking seems to accelerate quite a bit in the lame duck session.
At least that was the pattern in the 111th and 112th.
In any case, despite all the hype, the 113th has generally been close to the 112th on this metric. Usually a little behind, but close. And at various times it has pulled slightly ahead.
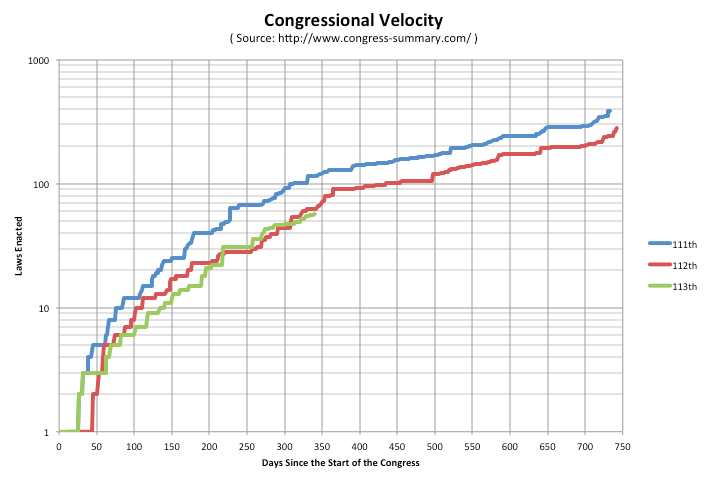
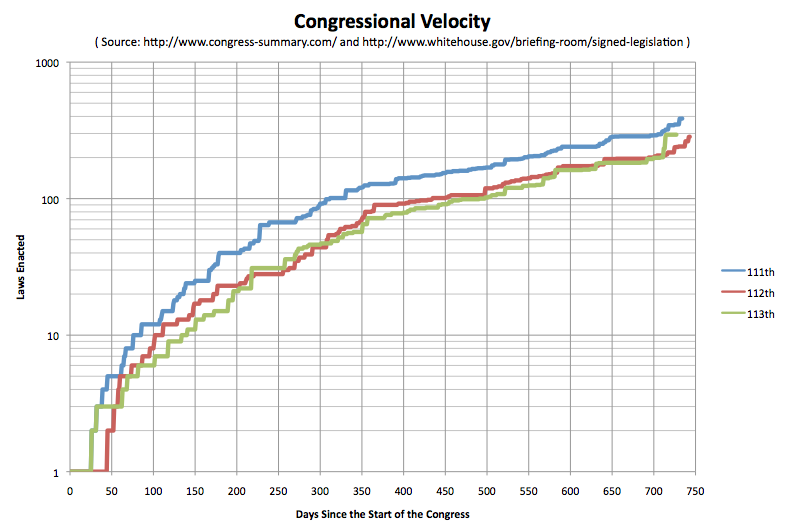
Today’s quarterly update is one of those times. As I post, we are 635 days into the congress. At this point the 113th has passed and the president has signed into law 182 public laws. At the same point in the 112th congress, only 178 laws had been signed. So at this very moment, the 113th is actually AHEAD of where the 112th was. Now, this is unlikely to last, as it seems this is just because the 113th scheduled one of their “big days” a little earlier than the 112th did. So with congress currently in recess, the 112th is likely to catch up in early October. For the moment though, the 113th is ahead.
Of course, both are far behind the 111th, which had 252 laws signed by this time.
Here are the graphs:

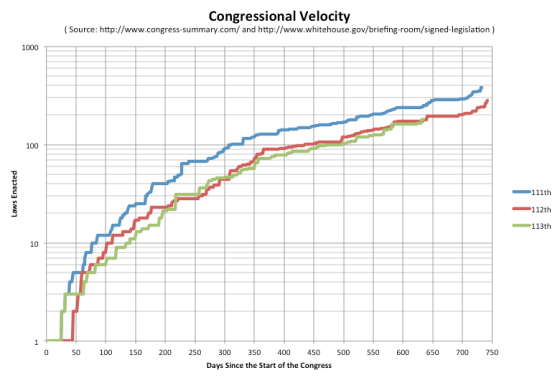
This is the latest in a series of quarterly posts comparing the legislative output of the last three congresses. The last update was in March. Once again, the 113th is behind the pace of the 112th… but not actually by all that much. As of June 10th, President Obama has signed 117 laws from the 113th Congress into law. At the same point in the 112th there had been 131 laws enacted, and in the 111th there had been 193.
Here are the charts:
This is the latest update for the series of posts I have been doing on how the current congress compares to the last two in law making velocity. The last post was in December. Depending on your views on such things, enacting more laws may be better, or enacting fewer laws may be better. In any case, the 113th congress is continuing to succeed at enacting fewer laws than either of the two previous congresses. As of the last law currently listed at my source at Congress Summary, which was a reauthorization of the National Integrated Drought Information System signed into law by Obama on March 6th, the 113th has passed and Obama has enacted 86 laws. At a comparable time in the cycle, the 112th had enacted 97 and the 111th has enacted 148.
Here are the charts:

[Edit 16:23 UTC to fix a capitalization issue.]
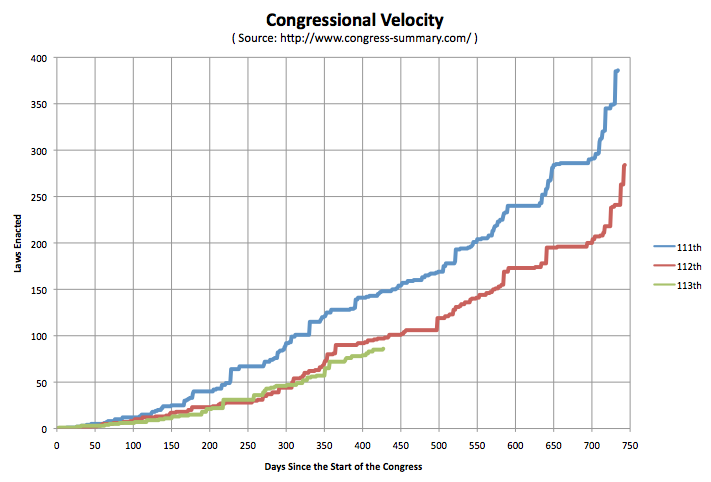
Just a quick update to my earlier posts from June and September on how many laws have been enacted by the 113th Congress in comparison to the 111th and 112th Congresses. From August 9th to November 6th, a period of 90 days, the 113th had actually enacted more laws than the 112th Congress had at a comparable time in the 2 year cycle. But Starting November 7th, the 113th fell behind the 112th again. As of the most recent legislation congress-summary.com lists as having been passed (extending the Undetectable Firearms Act of 1988 for 10 years, signed by the president on December 9th) the 113th has enacted 57 laws compared to the 63 the 112th had passed. (The 111th was up to 115 at this point.)
The 113th is a little behind the 112th at the moment, but actually they have been tracking each other pretty closely so far. It will be interesting to see if the gap widens in the next three months, or if the 113th catches up with the 112th again.
Anyway, this isn’t perhaps the best measure of Congressional productivity in the world, and depending on who you talk to, Congress passing fewer laws might be either bad or good. But it is still a fun data series to track.
Here are the charts:


It has been a bit over 3 months since I did my last “Congressional Velocity” comparison between the 113th congress and the 112th (and 111th) back in June. So time to do it again.
Specifically though, I was prompted by reading an article by Ezra Klein about the current congressional standoffs headlined “John Boehner’s Congress is a train wreck“. It seems like it probably is. I have no quibbles about that, but Klein also included this bit:
The data tells the same story. So far, the 113th Congress has passed 36 public laws. For comparison, the 112th Congress — the least productive Congress since we began keeping records — passed 283 public laws. At this rate, the 113th Congress is on track to be, by far, the least productive Congress on record.
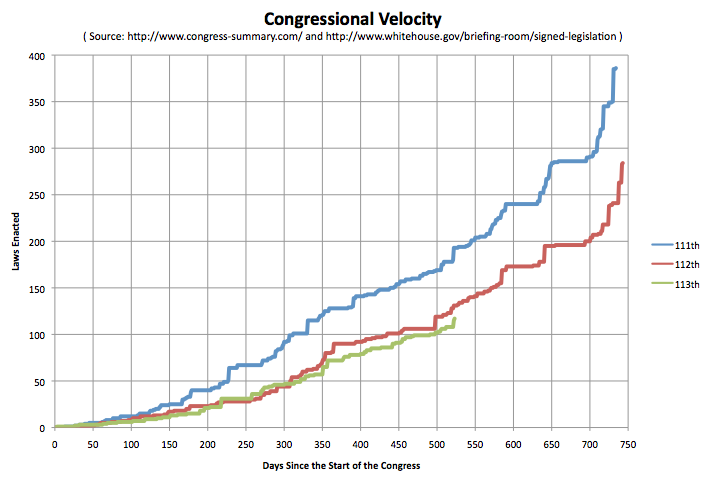
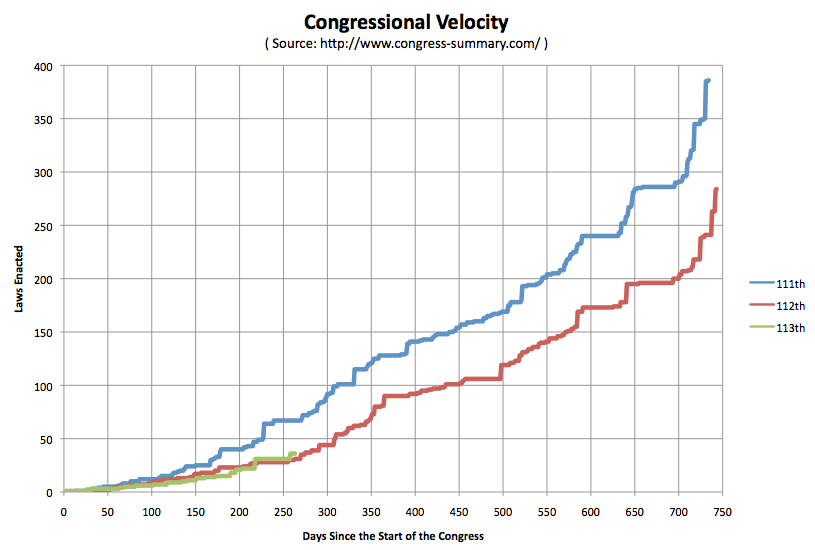
And here I quibble. Not in the way Boehner does, saying this isn’t a good metric. But just to point out that actually, at this very moment, the 113th is actually AHEAD of where the 112th was at the comparable time. Lets look at the charts:
The 113th WAS on pace to be slower than the 112th… until August 9th, when the president signed 9 bills into law, and the 113th pulled ahead. The 113th has kept that “lead” since then.
Unless there were some laws signed in the last few days that aren’t posted on the White House website or my usual source at congress-summary.com yet, as of September 22nd, the 113th Congress is responsible for 36 public laws, while at the same point in 2011, the 112th had only managed 31.
Now, they may well fall behind again, they aren’t THAT far ahead after all. Certainly neither the 113th or 112th are anywhere near where the 111th was (67 by this point). But for the moment, “At this rate, the 113th Congress is on track to be, by far, the least productive Congress on record.” isn’t actually quite right. The 112th was slightly worse at this point in the cycle.
At least on this particular metric.
[Minor corrections and wording changes 06:30 UTC.]
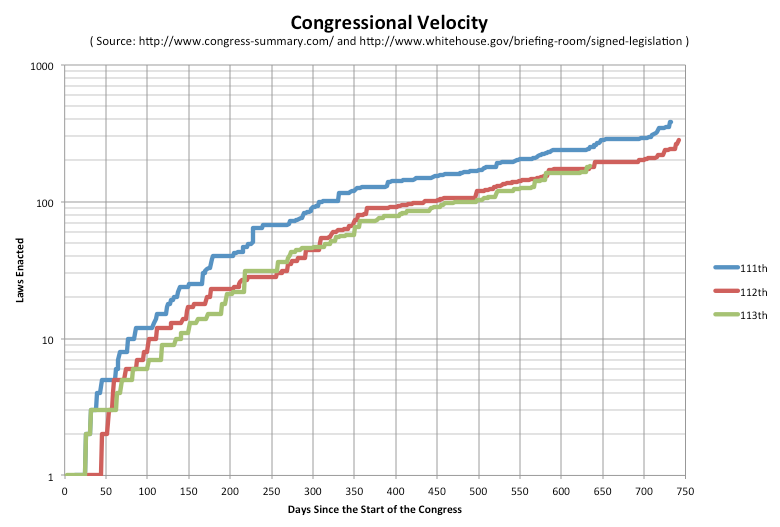
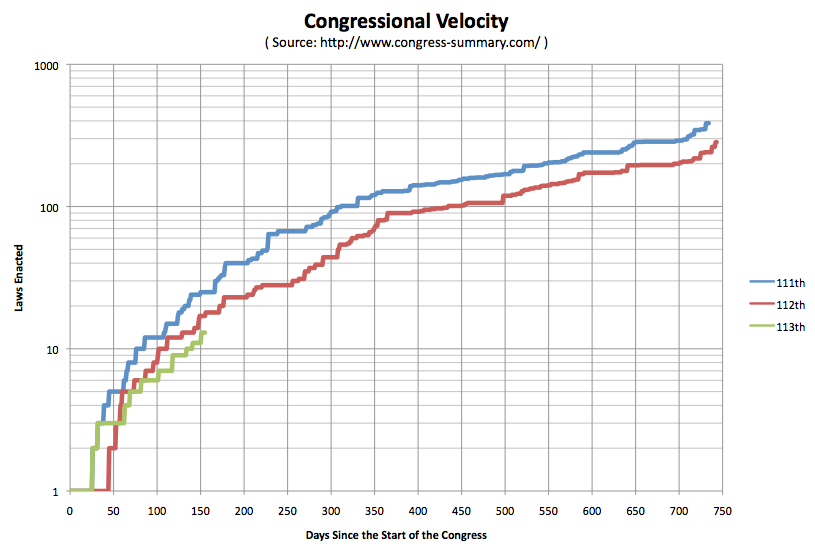
In our annual predictions show for 2013 one of the items Ivan and I disagreed on was if the 113th congress would enact laws at a higher or lower velocity than the 112th. (Enact of course meaning passed by both houses of Congress and signed by the President.)
So I have started to track that. Here are the charts so far (one with a linear scale, one with a log scale to better show the early detail):
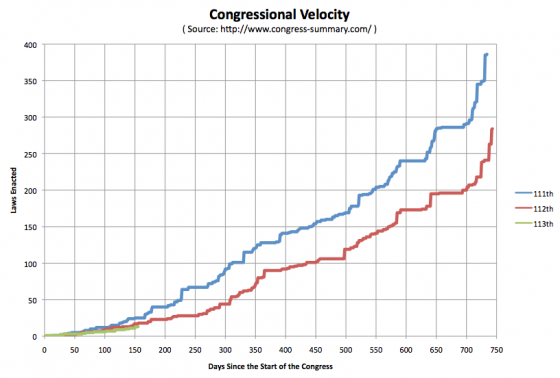
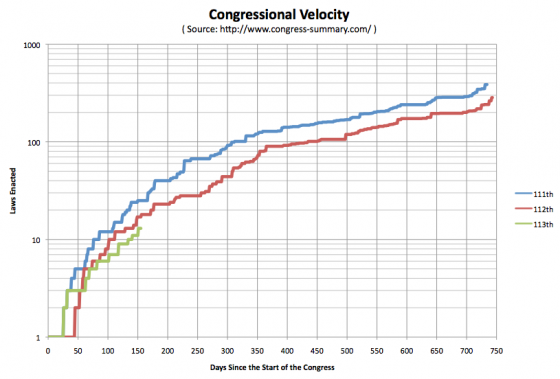
Minus any new laws recently signed that might not have made it to my source at congress-summary.com yet, as of 155 days into each of the three Congresses (that would be June 7th of the first year in all three cases) we have the 111th having 25 laws enacted, the 112th having 17 laws enacted, and the 113th having 13 laws enacted.
It is interesting to note the somewhat similar patterns in the shapes of the curves, indicating that although the velocity may be different, there seems to be a nice pattern to how Congress ramps up, when it takes breaks, when it speeds up and does more, etc. Bursts around holidays and in the lame duck period, lulls during the summer, bigger lull in the run up to elections, etc. (Of course, to really examine this, you’d need to look at more than 3 congresses, the similarities may not bear out with robust scrutiny.)
So far I am correct in my prediction that the 113th would enact fewer laws than the 112th. But there is still plenty of time before the end of the year for this to change and for Ivan to be proven right instead.
At the moment I am not making any statement on if that is a good or a bad thing. :-)
|
|