This is the website of Abulsme Noibatno Itramne (also known as Sam Minter). Posts here are rare these days. For current stuff, follow me on Mastodon

Categories

Calendar

April 2024
S M T W T F S
 123456
78910111213
14151617181920
21222324252627
282930  

Swine Flu Acceleration

I find myself bored waiting for the new daily data points on the Swine Flu Dashboard so I have accelerated data collection from once per day to four times per day (random times within each 6 hour interval) starting in a few hours at 0 UTC.

Addition to Swine Flu Dashboard

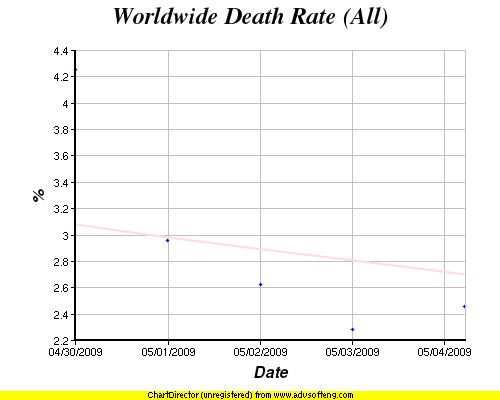
I added death rates (deaths/cases) to the suite of charts on the Swine Flu Dashboard.

Still updated once a day at random times, but to make the ratio correct, I now grab the deaths and cases data at the same time of day in each geographic grouping, although worldwide and US will generally be updated at different times.

Swine Flu Dashboard

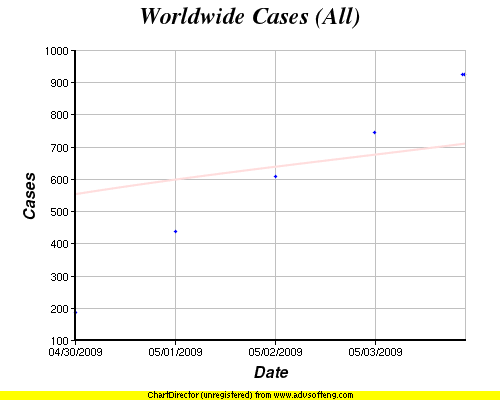
Despite my strong suspicion that this whole thing is over hyped, noticing that most (if not all) places I’ve seen are just giving totals, rather than trends over time, I’ve gone ahead and set up a Swine Flu Dashboard giving charts over time on confirmed cases and deaths on a worldwide and US only basis. The data is taken from Wikipedia for the worldwide numbers (as the way the WHO website presented the data was more difficult to grab) and from the CDC for the US numbers. I got data from the last few days manually, but the charts are now set to update automatically on a daily basis.

I’ll leave this going until either it becomes a pain for some reason, or the hype bubble pops and nobody cares any more.

Note: Yeah, yeah, H1N1. Whatever. Swine Flu.

Kemp

Just got the CNN Breaking News alert on my phone. Jack Kemp is dead. I remember thinking that he (along with Dole) back in 1996 were decent well meaning folks even if I disagreed with them on a lot.

But Mom, All the Cool Kids Have Swine Flu!

Of course they all have swine flu. Of course they do.

Kids Who Cried “Pig”? Suspected Flu Cases Increase
(Kim P., Seattlest, 1 May 2009)

Kids must be smarter than we give them credit–those little stinkers might be pulling a “Oh, I’m sick, I have swine flu and can’t go to school” after hearing Madrona K-8 closed for an entire week. Currently, seven of King County’s ten suspected cases of Swine flu H1N1 flu have infected children and teens. More local schools where a “suspected case” has attended classes are now closed as a precaution.

Yum Huh.

Denied!

Obama Denies Bailout Funds For Automakers
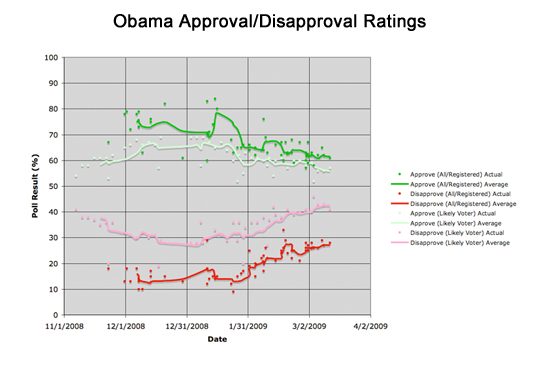
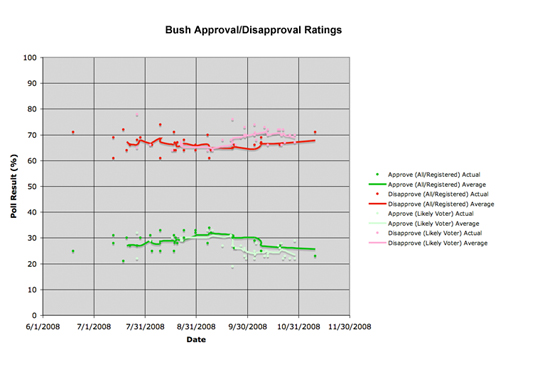
(Philip Elliott, AP on Huffington Post, 30 Mar 2009)

The White House says neither General Motors nor Chrysler submitted acceptable plans to receive more bailout money, setting the stage for a crisis in Detroit that would dramatically reshape the nation’s auto industry.

President Barack Obama and his top advisers have determined that neither company is viable and that taxpayers will not spend untold billions more to keep the pair of automakers open forever. In a last-ditch effort, the administration gave each company a brief deadline to try one last time to convince Washington it is worth saving, said senior administration officials who spoke on the condition of anonymity to more bluntly discuss the decision.

Obama was set to make the announcement at 11 a.m. Monday in the White House’s foyer.

Buh Bye!

Not to Mention

That the total amount of all these stupid bonuses is a tiny tiny fraction of the TRILLIONS we are spending overall in bailouts, stimulus, and crazy stuff the Fed is doing. Even wasting 5 minutes on this is a huge distraction from paying attention to the parts of this that actually matter more and which are REALLY wasting the public’s money.

To reiterate… I say just let everything die.

A good hard long recession will clear everything out to make room for later generations.

Brandy points out that my old email archives (paper archives from the early 90’s from before I had enough hard drive space to store everything) will not fit in the car we would have to live in.

So be it.

Bonuses

For the record, although I’m sure Ivan and I will talk about it on the next show… I think the AIG bonuses are crazy. But I think the proposed retroactive taxes to take them away from the people who got them are completely and totally wrong and misguided and a horrible horrible precedent. We want a government that feels free to decide after the fact that it doesn’t like that you made the money you made, and then change the rules so that they can take it from you… after you’ve got the money (and quite possibly after you have spent it, not knowing it would be taxed)? Really? We want that? Really?

These bonuses were written into contracts that AIG made. They were probably contracts AIG should not have made. But they were already done by the time the bailout happened. They were obligations, just like the other debt obligations AIG had. Of course AIG was going to pay its debts with the bailout money. That is what the bailout was for after all. Duh.

And no, we shouldn’t have put strings on the bailout saying that AIG should pay some debts but not others. If we really felt that way, we should not do a bailout at all. Let the damn thing go out of business, then if there are creditors we think deserve it more than others, bail THEM out.

All and all, with every turn of every screw in this whole saga, I’m more and more convinced that the “right” thing to do, going back all the way to last fall, is to not have bailed out a damn thing. Not one company, not one industry. Not the financials, not the autos, not nothing.

Would we have a worse recession right now if we had? Probably. I won’t try to argue against the folks that say these bailouts were necessary to prevent that from happening. I’ve always had severe reservations though.

And at this point I’m thinking that perhaps an extremely severe recession where most of the companies in most of these industries go completely out of business… taking with them all of the other companies… and yes regular people… who depended on them… is really the only way to get the bad blood out of the system. To completely and totally kill (for at least a generation or two, these things always come back) the idea that the bad practices that resulted in the mess are things NOT TO DO. Right now, I don’t see that lesson REALLY being learned. People are just waiting for the tide to turn and then they will go right back to where things were.

We need to get back to the point where if you are going to try something, you really do shoulder almost all of the risk for it yourself, rather than trying to bury the risk in layers of insurance products designed to make the risky not risky. Hey, guess what, things are still risky. You’re just moving the risk around and making it harder to see. It does not go away. And maybe insurance makes sense when it is against things which are actuarially highly predictable like death and disease and fender benders… but there should not be insurance against bad business decisions. It just distorts the whole incentive model and encourages people to take on very risky endeavors that are probably best left on the table.

How about a little caution and prudence instead? Sure, you don’t get as big an upside, but so what.

Anyway, I say bring on the damn depression. Let everything fail. Salt the earth. Perhaps there will be horrible pain for a generation. But what comes after that will be stronger because of it. Trying to prop this crap up MAY be helping things in the short term, but in the long term, it is just propping up businesses and business practices that deserve to fail. Let them die.

DIE DIE DIE.

Apathetic Non-Likely Voters

Chris Weigant once again uses some graphs I made for him, and some quotes from me, in an article on his site Wednesday.

A Surprise In Obama’s Poll Numbers
(Chris Weigant, 18 Mar 2009)

It really is a bit early to focus on President Obama’s approval ratings in the polls, I know. But, rather than looking at the overall picture of how he’s doing, I have been noticing something interesting which I don’t believe others have picked up on — Obama’s numbers dramatically improve depending on the sample used by the pollsters. When “likely voters” (LV) are polled, the numbers they give are different from when either “registered voters” (RV) or “all adults” (A) are polled. Obama’s LV approval rating is about five points lower than the RV/A numbers. The difference is more pronounced in the disapproval ratings, where LV numbers are fully ten points higher than RV/A numbers.

(Also cross posted at Huffington Post)

Chris draws some tentative conclusions from this about there (at least potentially) being a reservoir of extra strong support for Obama among the folks who are in the “All” or “Registered Voter” samples but who are not in the “Likely Voter” samples… perhaps tied to people who were not traditional voters who were “energized” by the Obama campaign and are retaining their excitement.

Maybe. But as Chris quotes me in his article, I have my doubts and think it is highly likely that there is a much more pedestrian explanation. The quote of mine Chris gives does hit on the crux of this, but for completeness to get my own thoughts on this out there, let me quote here a bit more of my comments to Chris which he excerpted. (I’ve made some minor edits to fix some wording issues with the original, and to remove other comments not directly relevant.)


Date: 15 March 2009 04:10:58 GMT

I can’t do fancy loess regression like Pollster does. The lines are simple “last five poll” averages. But for these purposes that is probably fine.

My gut feel here is that these differences are actually somewhat tied to how undecideds or non-responders are taken into account. If you take my “average” lines for approve and disapprove and sum them at each point, for All/Registered you will see that the sum varies from 79.2% to 92.4% with an average of 87.5%. Meanwhile, for likely voter the sum varies from 88.6% to 99.0% with an average of 95.1%.

This means that the “all” group has a much higher undecided rate… which could either be a real effect or just that the likely voter polls push harder for an answer. It actually makes sense though that people who are less likely to vote are more undecided though, so lets assume it is a real effect.

What would more undecided people result in? Hmmm… well at first you’d think that it would lower BOTH the approve and disapprove numbers. But what we are seeing here is lower disapprove, but HIGHER approve. So what does this get you? Maybe there is a real effect here… something along the lines of the less-likely voters being more willing to give the benefit of the doubt and give an “Approves” rating and less likely to take a leap and say “Disapprove”.

I think this also makes sense for the less-likely voter. Less likely voters are also most likely less in tune and in touch with what is going on… generally less informed. So they are giving the benefit of the doubt on approval, and less likely to disapprove, because they don’t feel they know enough to pass a negative judgement.

I haven’t tried this, but I’m guessing if you broke the polls up in a similar way for the last few years of the Bush administration, you’d see the same pattern… with the broader sample generally being less negative (more likely to approve, less likely to disapprove). This just seems like the natural tendency you would get from less informed people, which is who you are adding when you move from Likely Voters to the broader sample.

That is my guess anyway.

But you are right, the differences are quite clear between these groups.


Date: 15 March 2009 04:52:57 GMT

OK, before July or so, the polls were not identified as likely/registered/all, so there was no way to differentiate. So this only shows those polls that were in fact broken up that way.

So yes, with Bush in his last few months we do see the same pattern… the wider sample is more likely to be positive, and less likely to be negative. The differences are MUCH smaller though, and at certain points (back in August and September) the lines are almost indistinguishable. But I still think this does hold with the general principal that the people who are less likely to be engaged (and therefore not likely voters) are more likely to approve “by default” and less likely to give a negative (disapprove) rating. Basically, if you don’t pay attention to what is going on, you give the benefit of the doubt.

If one does the same exercise as I did last time looking at the sum of approve and disapprove, we see that the number of “undecideds” is almost identical between the two groups (rather than being larger in the wider sample). This actually makes some sense too… after 8 years, almost everybody felt they had enough information to make a judgement about Bush, and the percentage of people who felt like they didn’t know enough and therefore did that benefit of the doubt thing was much smaller.

At least, I think that explanation is a good tentative explanation of both the Bush and Obama results.

Date: 18 March 2009 06:49:08 GMT

I hypothesized that what is going on here is simply that non-likely voters… which are likely to also be people who are less informed about what is going on, and generally pay a little less attention to what is going on, are just more willing to “give the benefit of the doubt” and therefore are more likely to give a positive rating AND less likely to give a negative rating… they just generally are a little bit more positive than the people who actually pay attention.

And the Bush number seem to also follow this pattern… with the addition that after 8 years, even the people who pay less attention had a lot more information and were more likely to have an opinion, so the degree to which they are more positive than the likely voters is a lot less.

Now, all of the above is just a hypothesis. To actually test it, you’d actually have to run some polls specifically designed to investigate this and to control for other effects. This is just my guess as to a plausible interpretation of the data.

I would hesitate to attribute this as actual SUPPORT of Obama. The non-likely voters are almost by definition people who are less politically engaged. So what “approval” means is a softer concept in this group. It is kind of like asking me, as someone who doesn’t follow sports at all, if I approve of how my local sports team is doing. I honestly have no idea how they are doing. So, while perhaps I would pick a neutral position if I’m given the choice, I’m still pretty likely to say I approve of how they are doing… the default position is to assume they are doing OK… it is the position that causes the least friction. If I said I disapprove, I feel like I need to have reasons… maybe even good reasons… for saying I disapprove. But if I really don’t pay much attention, and don’t have a strong opinion, I’ll be reluctant to pass the negative judgement.

In the end, my thoughts about the undecideds may have been tangential. Basically, if there was no difference in behavior on these polls between Likely voters and non-Likely voters, other than there being a greater undecided rate among non-likely voters, one would expect that BOTH approve and disapprove would be LESS in the non-likely voter group… but that is NOT what you see. Disapprove is less as expected, but approve is unexpectedly higher. This indicates that there is indeed a behavioral difference other than just a higher tendency to be undecided. The bit about the “benefit of the doubt” is my stab at explaining that behavioral difference.

And that is that. :-)

Stewart and Cramer

Another Daily Show bit that will stand out over time. The actual show cut this way down, but the full, unedited, 23 minutes or so, is available online. And we’re left once again asking why “real” news places don’t actually push and prod and question the assumptions everyone makes, etc. It would be nice if that happened sometime. This is played straight too. This isn’t a bunch of laughs. Both Steward and Cramer are dead serious almost the whole time. Speaking of which, I give Cramer a lot of credit for actually coming on this show and taking his spanking.

In three parts:

(via Oliver Willis and a bunch of other places)