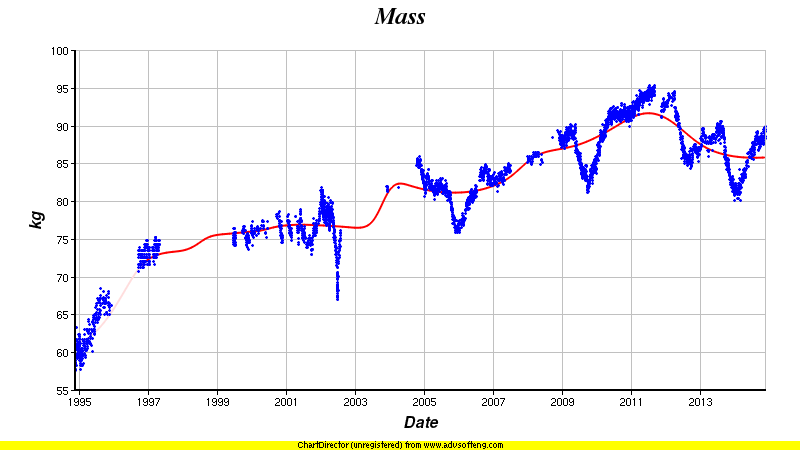
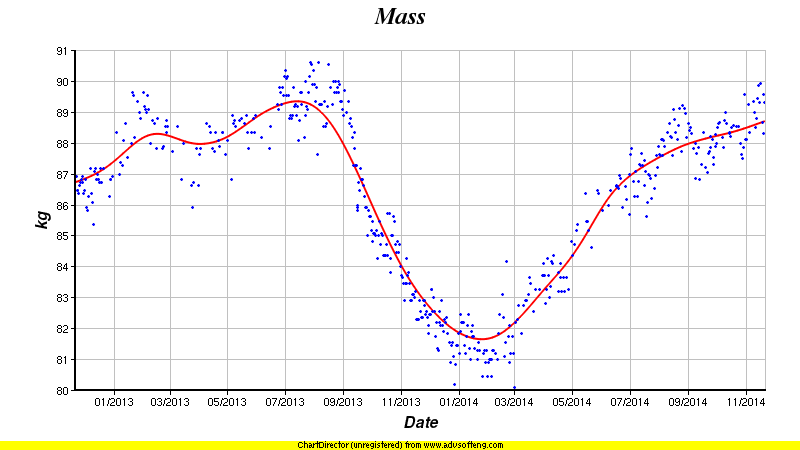
Recent Comments

  • Abulsme on Getting Backblaze Statistics from the Command Line on a Mac:
    Hello Brian, don’t know if you set this thread to email you when there were new comments or not, but thought I’d follow up here before trying to ping...
  • Abulsme on A Pig at the Rainy Fourth:
    Metal pigs taste sort of metallic when you bite into them.
  • Abulsme on Running the Maze:
    Jack, I do believe you are correct, it is not a maze, it is a labyrinth.
  • Abulsme on Of the Reek:
    From SM via Facebook: Ah, well unfortunately we didn’t talk so much about pros and cons of colors, as green versus blue versus purple. 2 seconds ago
  • Abulsme on Of the Reek:
    From JS via Facebook: will tune in – Ben took a foray into colored hair….fortunately hair grows back. 17 hours ago
  • Jack Donaghy on Running the Maze:
    Is that a maze or a labyrinth?
  • Kelly on A Pig at the Rainy Fourth:
    Brandy, aren’t a vegetarian anyway…? of course the big pig mobile frightened you! Get me a knife & fork!
  • Abulsme on A Pig at the Rainy Fourth:
    From SM via Facebook: Hmmm, I hadn’t thought of that. 2 seconds ago
  • Abulsme on A Pig at the Rainy Fourth:
    From ES via Facebook: Maybe it just likes zz top about an hour ago
  • Abulsme on A Pig at the Rainy Fourth:
    From ES via Facebook: Petty cool pig! the eyes I m sure glowed! 9 minutes ago

Categories

Calendar

July 2010
S M T W T F S
« Jun    
 123
45678910
11121314151617
18192021222324
25262728293031

New Archives

Get Posts by Email

Oops

Alex Mass Doubling Time

It was close yesterday, but as of today based on the overall trend line for Alex’s mass…

Alex has doubled in mass!

Anyway, it looks like he is doubling every 148 days.

Assuming an exponential growth pattern…

His mass will exceed my own when he is 1.8 years old.

His mass will exceed that of the Earth when he is 32.6 years old.

Such a big boy!

(Note that this is of course dependent on the exact methodology I use for drawing the trend line, but I like how I draw the line, so I’ll stick to it!  It is better than just looking at today’s reading vs the first one right after he was born…  human mass fluctuates and there is non-trivial experimental imprecision, so it is important to look at trends over a bunch of data points, not individual readings.  And I’ll be sticking to the idea that his growth will be exponential, even though you can clearly see that the shape of the curve is not exponential.  I’m sure that is just an anomaly, and it will become exponential any time now. :-) )

Revamped Self-Tracking Dashboard

Screen shot 2009-10-26 at 00.15.45

Over the weekend (mostly while holding Alex overnight while he was sleeping and later while sitting with Amy while she did homework) I spent some time reworking a lot of the stuff in my personal dashboard.  It is much better now than it was 24 hours ago.  The main changes are:

  • Switched from showing each chart in three separate time scales to showing each only once, with the default time scale being one year
  • Added the option to easily change the time scale on both the summary view and on the zoomed views of individual graphs
  • Added “spinners” to indicate when a chart is still loading
  • Converted all units to SI Units in cases where those units were not already in use
  • Gave in and made the assumption of standard Earth gravity to convert weight (force) to mass, thus now giving these sorts of measurements in kilograms rather than Newtons.  This may lead to incorrect results if I ever take a weight reading in an area with a strong gravitational anomaly present or while not on Earth.
  • Removed the time scale from each individual chart title as it is now clear from the page headings (and of course the date range on the chart)
  • Reworded many of the chart titles to more clearly explain what they are showing, removing most of the obscure abbreviations and acronyms, although I have left a few in places where I desire to be cryptic
  • Slightly modified the vertical height of the zoomed in graphs to make room for the time scale controls
  • Behind the scenes changed the structure of the PHP to factor out the list of charts, making it easier for me to add, remove or reorder charts in the future
  • Removed several old charts that were no longer being updated or which caused performance problems on the page
  • Added several new charts

Anyway, that is it for now.  Enjoy my Self Quantified Self-Tracking Dashboard Thingymajig.

[Edit 0:39 UTC for minor text corrections.]