This is the website of Abulsme Noibatno Itramne (also known as Sam Minter). Posts here are rare these days. For current stuff, follow me on Mastodon

Categories

Calendar

April 2024
S M T W T F S
 123456
78910111213
14151617181920
21222324252627
282930  

Sam’s Sleep and the Election

samsleep201212140305

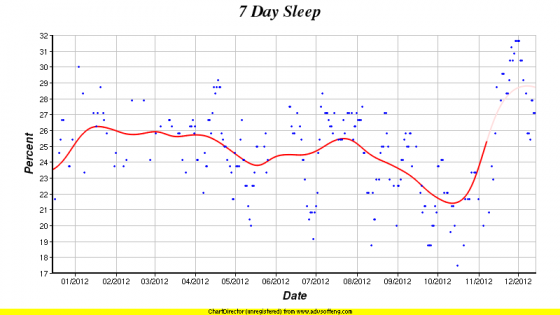
The dots are individual readings taken approximately daily (with some gaps) showing the percentage of the previous 7 days I spent sleeping. The red line is a smoothed trend of those first data points.

I said a few times that I did the election stuff mostly in “time I otherwise would have been sleeping”. You can see that quite clearly here.

Although the red line, the average of the average as it were, only dipped to about 21.3% (about 5 hours and 7 minutes per night), the lowest individual reading was on October 15th. On that day, I’d only slept 17.5% of the previous 7 days… or an average of 4 hours and 12 minutes per night. The reality was that although I slept a decent bit more than that on the weekend, but a lot less than that during the week.

It was brutal for a little while there. I just couldn’t sustain the not sleeping. I was starting to be less functional and less efficient during the time I was awake, both on the election stuff and at work. Even worse, I was starting to have to fight to not fall asleep on my commute back and forth from work, which was downright dangerous.

So that’s why as we got to the last week and a half before the election, I started taking some time off from work. First some half days, then actually fully taking off the few days right around the election. Much better to actually take the time off than try to sustain doing everything with so little sleep. That just wasn’t working.

Once I made that change, my sleep started to recover. Once the election was actually over, it recovered dramatically. The trend lines seems to have peaked now, so I thought it was a good time to post. At the beginning of December, I actually got to the point where there was a 7 day period where I spent 31.6% of my time sleeping (about 7 hours 36 minutes per night average). That is the best I’d done in well over a year.

It still isn’t the over 8 hours I’d really like to see, but I just don’t think that is going to happen again any time soon.

In any case, I just thought it was remarkable how clear an impact my election activities had. I really was doing it in “time I otherwise would have been sleeping”.


It Is Still Annoying

In the latest Curmudgeon’s Corner…

Sam and Ivan talk about:

  • Sleep
  • Repub Presidential Candidates
  • Flooding and Tornado and Death
  • Tablets
  • Data Breaches
  • Passwords
  • War Powers

Just click to listen now:

[wpaudio url=”http://www.abulsme.com/CurmudgeonsCorner/CC20110515.mp3″ text=”Recorded 15 May 2011″]

or

1-Click Subscribe in iTunes

View Podcast in iTunes

View XML Feed

Sleepy Time

The percentage of my life spent asleep as it has changed over the last year. Down roughly from 29% (about 6 hours 58 minutes per night) to about 26% (about 6 hours 14 minutes per night) over the course of the last 365.242 days. The best was last December when I hit about 30% (about 7 hours 12 minutes per night) and the worst was in early November when I was at about 25.5% (about 6 hours 7 minutes per night). Those are of course from the general trend lines, as you can see, some specific data points have been significantly higher or lower than those trends. The data points themselves are not single nights, but rather represent daily samples of the trailing seven days.

Anyway, I thought it was an interesting chart. :-)

View of a Staycation through a Sleep Lens

Dots are individual daily readings of the percent of time I spent asleep in the prior 7 days. The red line is a smoothed trend line (even though the points themselves are already smoothed by virtue of being over 7 days). I was on a “staycation” August 19th through 31st. The increase in time spent asleep is clearly visible.

In His Room

Last night was Alex’s first night sleeping all by himself in his own room rather than just a foot or two from Mom. Right now he is working on night number two in his room.

This may be a small milestone for Alex, but I think it is an even bigger milestone for Mom. :-)

Post Baby Sleep

Although the frequency has slowed, I still occasionally get people asking how I am sleeping what with a baby in the house and all, and everything everybody always says about no sleep when there is a new baby. I’ve been meaning for a long time to post about this, since at least October, but am just now getting around to it. Anyway, because I am certifiable and track everything, I can give some quantitative answers to the sleep question.

Here is a relevant chart:

annotatedsamsleep20091129wmonthlevelsmoothing

This is a chart with daily values of the percent of the previous seven days I spent asleep. (Click the chart for a larger version.)

Unfortunately I did not start tracking this number until August even though I had the capability to do so earlier. If I had started earlier we would have had a better baseline to do a longer term before and after comparison. In this chart I have used the smoothing factor for the trend line that I usually use for my one month charts, rather than what I would normally use to show the amount of time shown here. This allows me to show a little more responsiveness in the trend line to short term changes. For a current chart with my normal smoothing values, see here.

Anyway, if one looks at how much sleep I was getting immediately before Alex was born, it is at about the 30% level. That would be about 7.2 hours per day of sleep. You can clearly see the deep dive down to about 14% (about 3.4 hours per day). But this does not last very long. 17 days later I recover to the immediate pre-Alex level. Of course I don’t stay there for long. You can see I move up and down between about 24% (about 5.8 hours a day) and 31% (about 7.4 hours a day). If I had to hazard a visual guess at an average for October and beyond, I’d say about 27% (about 6.5 hours per day).

Because I only have the month or so of pre-Alex data though, it is hard to see if there is a distinct before and after longer term change. As you can see, I did have a pre-Alex peak of 34% (about 8.2 hours per day) that has not yet been equaled. But it impossible to say if that was an abnormal peak. Also, there was a dip down to 20% (about 4.8 hours per day) at one point when I was staying up late on a couple of personal projects. So the “normal” range may have been pretty wide to begin with.

So the 17 day “back to normal” recovery time is probably about the best estimate that can be made with this data. I’m still annoyed for not having tracked this metric for longer. I had the ability to do so starting approximately in February, but I didn’t. Oh well.

Now, this does show however that aside from the one peak in August, I’ve never been close to the 33% (8 hours a day) generally recommended sleep level, and I’m not very consistent at all in terms of how much I sleep. Oh well. I doubt I’m really all that atypical on that front, although I must admit I would probably enjoy it if I could get and keep my average closer to that 33% level.

Finally, and this is an important point, this is MY recovery time… but BRANDY was the almost exclusive source of food and was the one that was almost always the one who got up and stayed up nights with Alex when needed. So HER chart would look vastly different, and her sleep recovery time much longer, if it has even recovered yet. I can’t show any graphs of that though, as Brandy won’t let me hook her up to machines to monitor her at night. I have no idea why. :-)