After a busy week including several days without power at Election Graphs HQ, I caught up on the 62 poll results that had been released in the last week. There were polls in eight different states (NV, IA, NH, SC, FL, CO, VA and WI) and for many different candidate combinations. With all of that though, there were only a few significant changes to the “best polled” candidate combinations that I comment on here.
Clinton vs Bush (best polled)
There were two polls for Clinton vs Bush in New Hampshire. Taken one by one, they show New Hampshire slipping back to the Clinton side of the fence for a few days, then back to a narrow Bush lead. Both taken together though, New Hampshire is in the same state as before this set of polls was included. This leaves the “expected case” at Clinton winning by 48 EV.
There was also a poll in Virginia though, and while the state was “Weak Clinton” before, and “Weak Clinton” after, Clinton’s margin increased, and improved Clinton’s “tipping point” against Bush. As a reminder, the tipping point is the margin in the state that would push the winning candidate over the edge. This can also be thought of as the amount the national polls would have to shift (assuming all states shifted uniformly) to change the winner. So it is essentially how close the race is taking into account the structure of the electoral college.
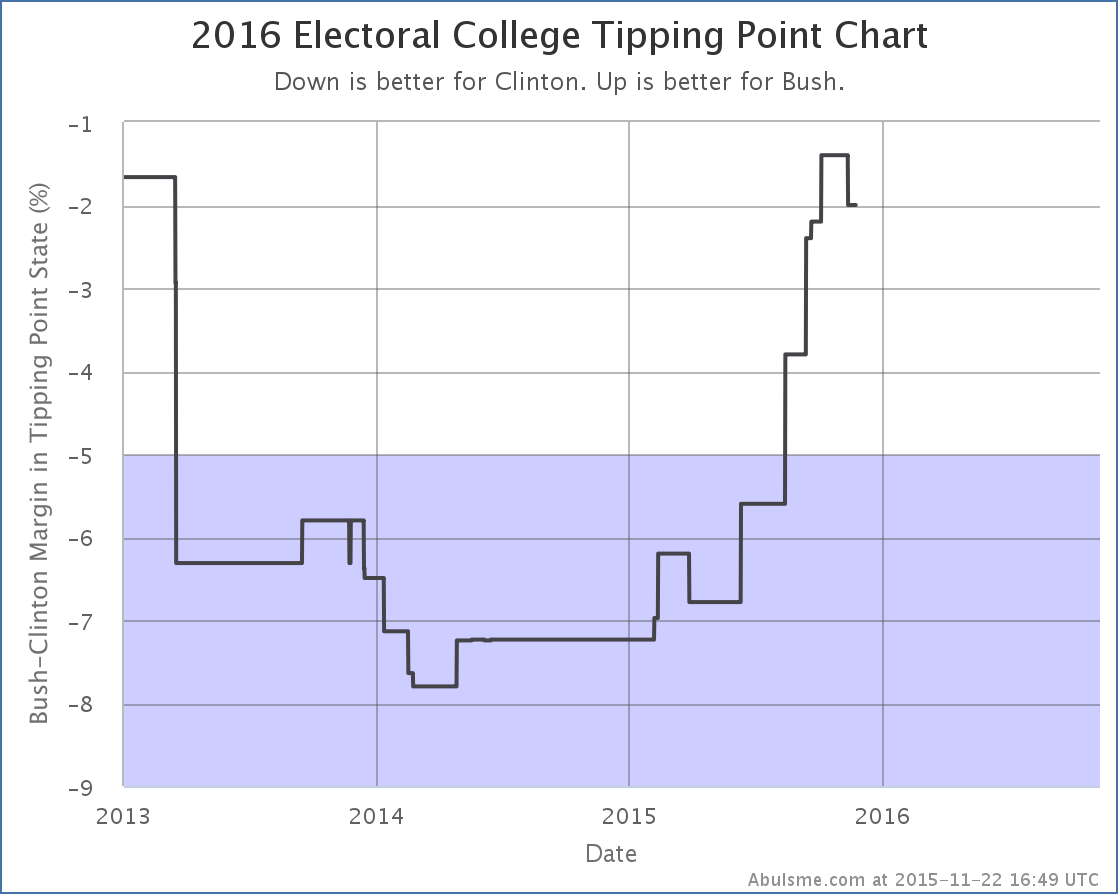
This is the first move toward Clinton in the tipping point against Bush since March. Is this a possible indication that Clinton has reached her floor and has started a rebound? Or is this just a blip, or something specific to Bush? Only more polls will tell.
Clinton vs Cruz (2nd best polled)
Since Clinton vs Cruz is just coming on to the five best polled list today, I won’t spend time looking at recent trends or changes. Instead, lets just look at where this combination sits right now:
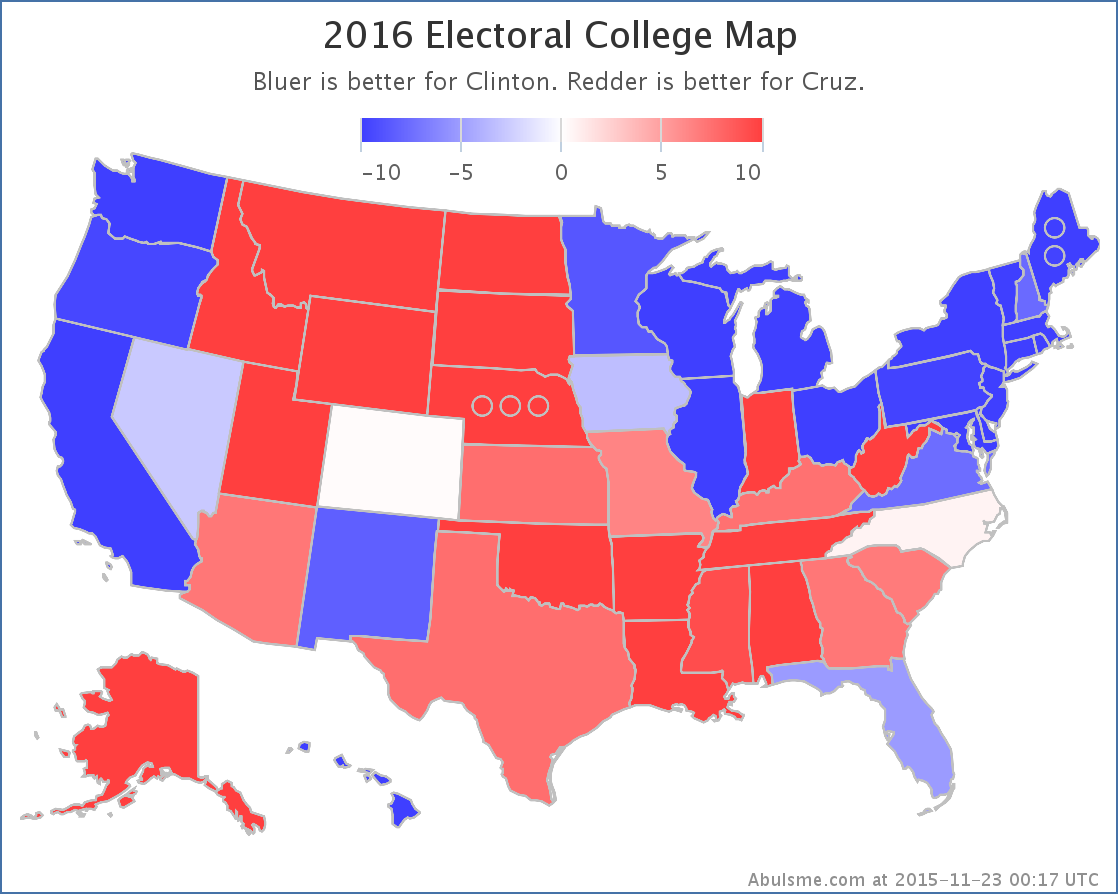
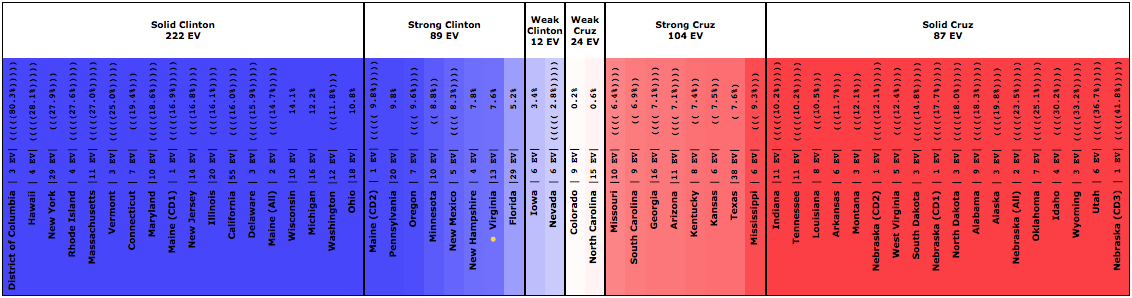
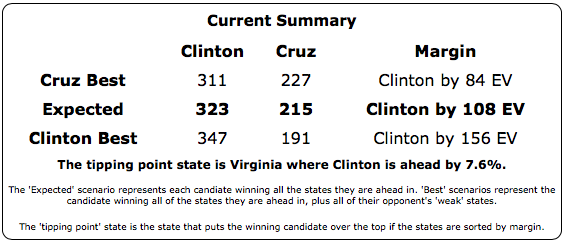
In other words, Cruz does pretty badly against Clinton at the moment. Rubio and Bush at least are making it close. Cruz is not.
Clinton vs Rubio (7th best polled)
Speaking of Rubio, with today’s update, Clinton vs Rubio actually falls off the “five best polled combinations” list, replaced by Clinton vs Cruz. I suspect Rubio may get back on this list soon, but in the meantime, here are the changes in this last update.
After a couple weeks with Rubio’s lead in Florida over 5%, with the latest update, the average falls to Rubio +4.1%, again making Florida a “Weak Rubio” classification, meaning that while Rubio is ahead, the state is within reach for Clinton, and could easily flip.
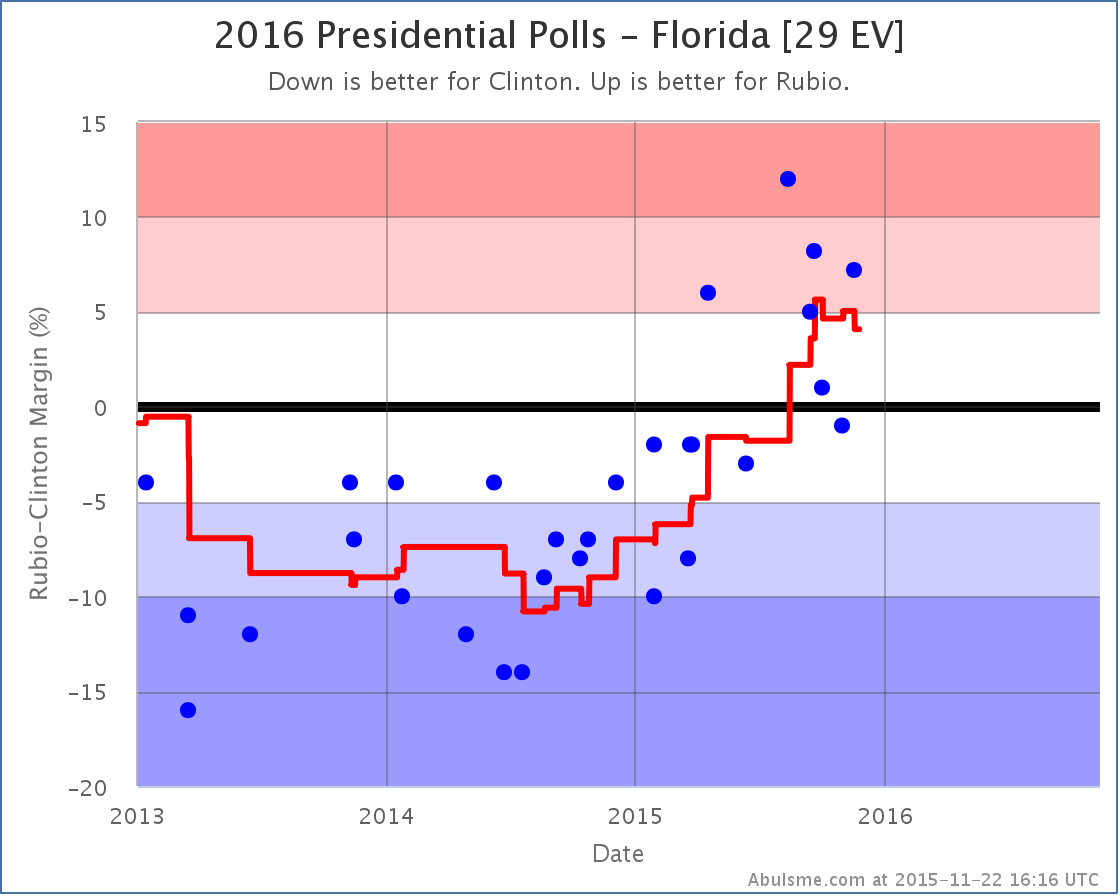
Florida is a big state, so this has a big impact on Clinton’s best case (where she wins all the Weak Rubio states in addition to the states she is actually ahead in).
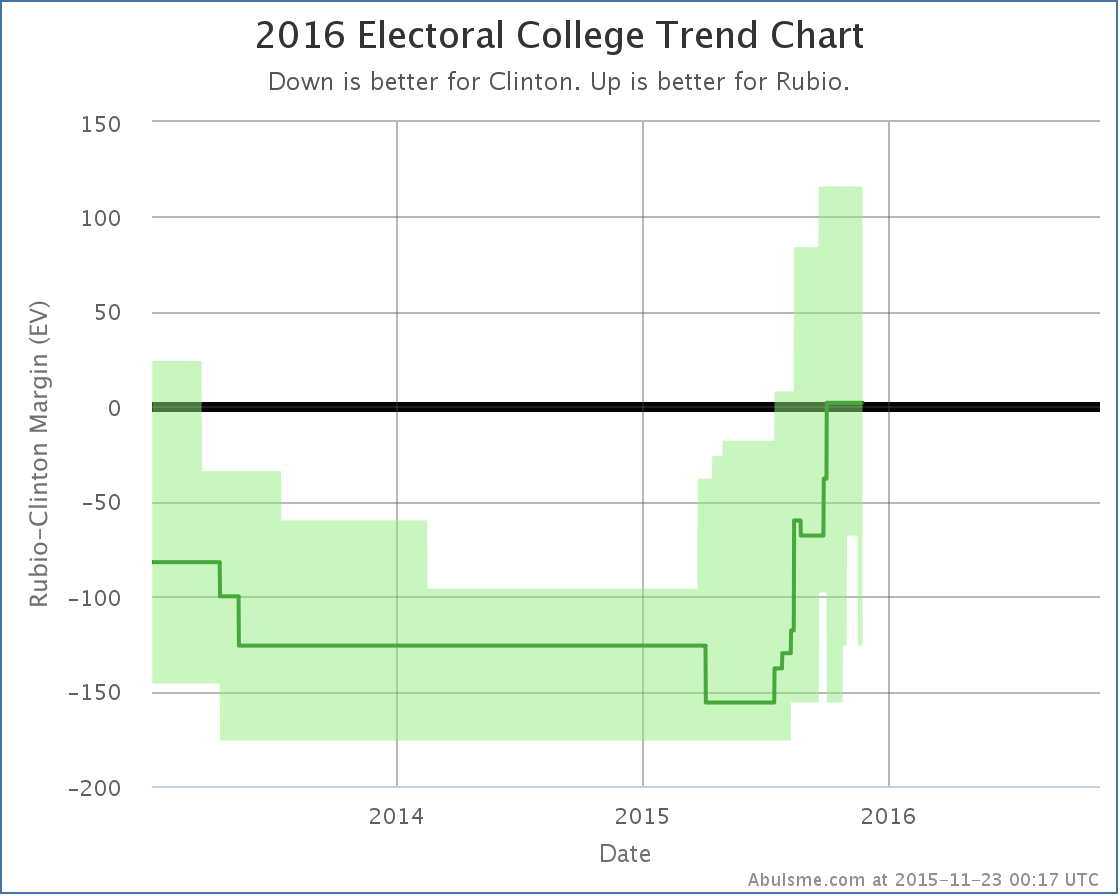
You can see the ragged lower edge of the “bubble” in the chart above. That is primarily Florida going in and out of the group of states considered possible for Clinton. For the moment, it is back in. The “expected case” is still Rubio winning by a razor thin 2 EV, but her best case is now back up to winning by 126 EV. So, Clinton strengthening?
Well, maybe, but at the same time, another poll increases Rubio’s average in Colorado, in turn improving Rubio’s tipping point against Clinton:
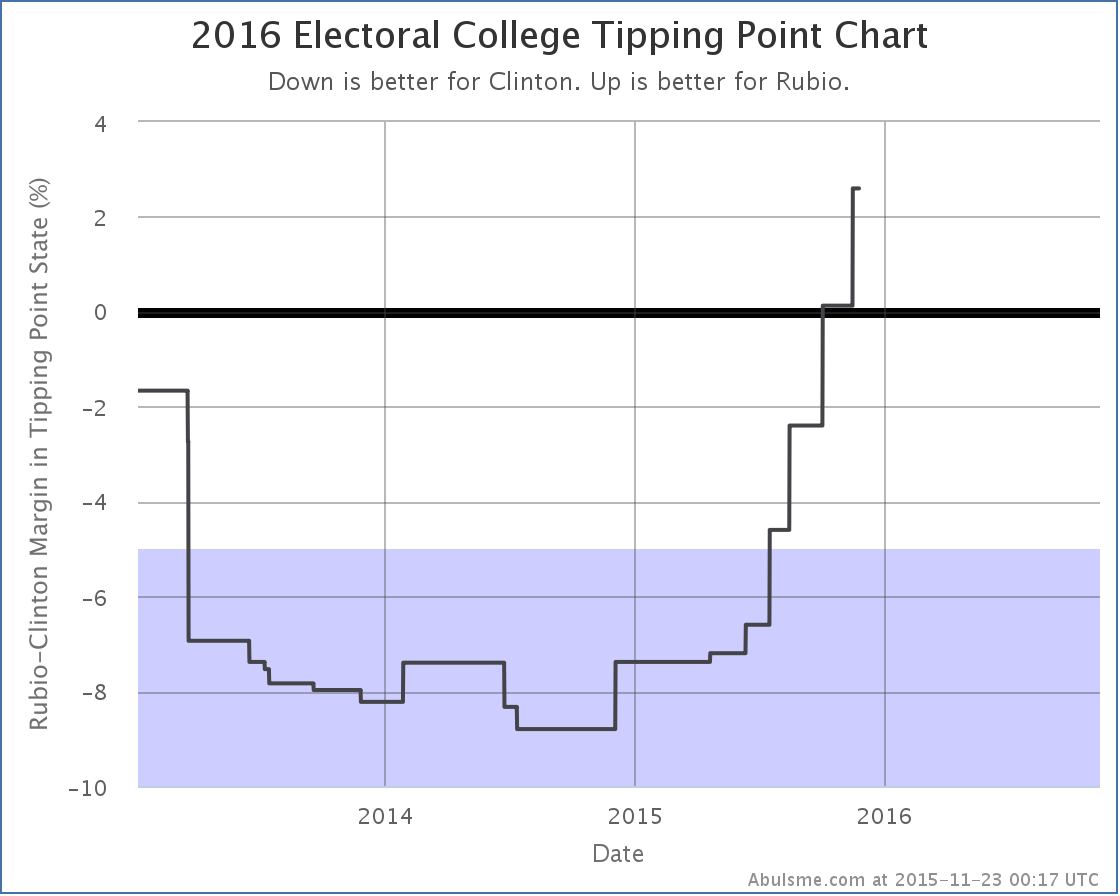
So, Clinton’s best case improves from winning by 68 EV to winning by 126 EV. But at the same time the tipping point moves from Rubio up by 0.1% in Colorado, to Rubio up by 2.6% in Pennsylvania. All in all this is a mixed bag of news, but on balance I’d say Rubio is better off here. So maybe don’t stock up quite yet on that Clinton recovery narrative.
Others
As usual, there are others getting lots of media attention currently that never-the-less have not yet had the sustained polling volume across a lot of close states to get on the “five best polled” according to my metric. This means looking at the results for those candidate pairs is a bit less reliable, but since there is continued interest, here are links to a few of those along with the current “expected” result for each:
- 8th best polled: Sanders vs Rubio – Rubio by 26 EV
- 9th best polled: Clinton vs Trump – Clinton by 68 EV
- 12th best polled: Clinton vs Carson – Clinton by 2 EV
351.9 days until the first general election polls start to close. A lot will change before then. Stay tuned.
Note: This post is an update based on the data on ElectionGraphs.com. All of the charts and graphs seen here are from that site. Graphs, charts and raw data can be found there for the race nationally and in each state for every candidate combination that has been polled at the state level. In addition, comparisons of the best polled candidate combinations both nationally and each in each state are available. All charts above are clickable to go to the current version of the detail page the chart is from, which may contain more up to date information than the snapshots on this page, which were current as of the time of this post. Follow @ElecCollPolls on Twitter for specific poll details as I add them. And like Election Graphs on Facebook!