For election night, this post will have the most recent updates at the top. Scroll down for earlier updates. Times listed for updates are hours and minutes since the first states close all polls at 0 UTC (7 PM Eastern, 4 PM Pacific). Updates will be added as states are called by the major news organizations. If you want to see the data in a more raw fashion, the spreadsheet I am using to track changes as states are called can be found here.
475:29
A few minutes ago Michigan officially certified their results, and immediately afterwards CNN finally called the state based on those results. As expected, Trump won.
Absent faithless electors, that makes the final results of the 2016 election:
Clinton 232 Trump 306 – Trump wins by 74 electoral votes
(UPDATE 2016-12-21 17:56 UTC – There were indeed faithless electors, making the actual final result Trump 304, Clinton 227, Others 7. That is a 77 electoral vote margin for Trump. For details see my “The Actual Presidential Vote” post.)
This was better than this site’s “best case” for Trump of a 66 EV win that we had on election day.
Trump exceeded the most optimistic projection for him based on this site’s methods. And of course our “expected” result was a narrow 8 EV Clinton win.
Despite that, only one other electoral college tracking site seems to have gotten closer to the final electoral college result than this one. So we actually didn’t do that badly. We did about as well as could be done given the underlying data.
I wrote my post-mortem back on November 10th, and it was written assuming a Trump win in Michigan, but since I haven’t looked at it in a couple weeks, I’ll do a last once over of it tonight before posting it. It will basically look at what this site got wrong, and what it got right, in the 2016 cycle and what changes that may suggest for 2020.
362:20
There were a bunch of Michigan counties that reported official results today, but it seems CNN and some other outlets are waiting for it to be fully official before they call the state. Sounds like that might not be until Monday.
244:01
As per @DecisionDeskHQ it looks like we should expect an update on Michigan on Wednesday. Everybody is waiting for canvassing to be done before calling the state. But everybody also agrees there is little to indicate that the fact that Trump is ahead will change.
207:46
Yup, still waiting on Michigan.
168:07
Nope. Still no Michigan. It has now been 7 days since the first states were fully closed. Having hit that milestone, as has been planned for months, I have now turned off Facebook promotion for Election Graphs as a whole, and for this post specifically.
I’ll keep updating this post until Michigan is called, and there will be a handful of additional wrap up posts between now and when the Electoral College votes are official in December, but we’re basically now in “between elections” mode.
139:00
Yup, still waiting for Michigan. There has been speculation that we might be waiting until Michigan actually fully completes their process and certifies the results, which won’t be until close to the end of the month. So still we wait.
95:56
Still waiting for Michigan. If they are waiting for final certification, it may take awhile yet. We have now taken more time to get the last state called than it took in 2012. We have a long way to go until we match 2008 (which took about 15 days).
I won’t publish the final post mortem until Michigan is called, but I talk about a lot of what is in it in the latest episode of Curmudgeon’s Corner. Darryl Holman, who does the electoral college estimates for HorsesAss also joins us to talk about his own analysis. (And we talk about other reactions and ramifications of Trump’s win as well. Unlike the neutral perspective here, fair warning that the podcast is not politically neutral.)
72:52
Yup, still waiting on Michigan. Maybe it will be called sometime this weekend. Or maybe the weekend means there won’t be any updates to its status until Monday. I’m checking a few times a day for updates. :-)
64:20
I was asked on twitter why bother even posting about Michigan if it won’t change the result of the election. The reason is that this site is not just tracking who wins and loses the overall election, but also who wins and loses each state, and what the actual margin is. Right now we know Trump wins, but do not know if Trump wins by 42 electoral votes, or if he wins by 72 electoral votes. So we continue tracking until that is known.
We’ll also be back in December to report on the actual results when the electoral college actually votes and we see how many faithless electors we have (if any). We’ve had a couple Democratic electors promise to be faithless. They can now do so without any fear of tipping the outcome, so they are probably even more likely to do so now than before. Since Trump has a healthy margin at this point, some Republican electors might be tempted to go rogue as well, since they too are unlikely to make a difference. If that happens, we’ll report on the final electoral college tally, whatever it may be, even though it won’t change the winner.
64:04
Still waiting on a call for Michigan. Hoping it is more like 2012, which took about 90 hours (just under 4 days), than 2008, where it took about 477 hours (almost 15 days) to call the last state. My post mortem is done, just waiting for Michigan. I’ve also recorded an episode of the Curmudgeon’s Corner podcast where Ivan and I are joined by Darryl Holman from HorsesAss to talk about (along with other things) poll tracking and prediction and what went right and what went wrong. The new episode will be out tomorrow.
49:23
Still waiting on Michigan. In 2012 it took until about the 90th hour to call the last state. We will see if it is more or less this time.
44:32
I used my lunch hour to finish writing my post mortem on how this site did in 2016, and what lessons it brings for 2020. My post assumes Trump wins Michigan, since he currently leads there, but if Clinton pulls out a surprise and wins the state, I have a handful of sentences to change. Since Michigan still has not been called, that post will stay sitting in my drafts folder just a little bit longer.
Still waiting on CNN to call Michigan. Come on already! :-)
37:14
Still waiting on CNN to call Michigan.
26:03
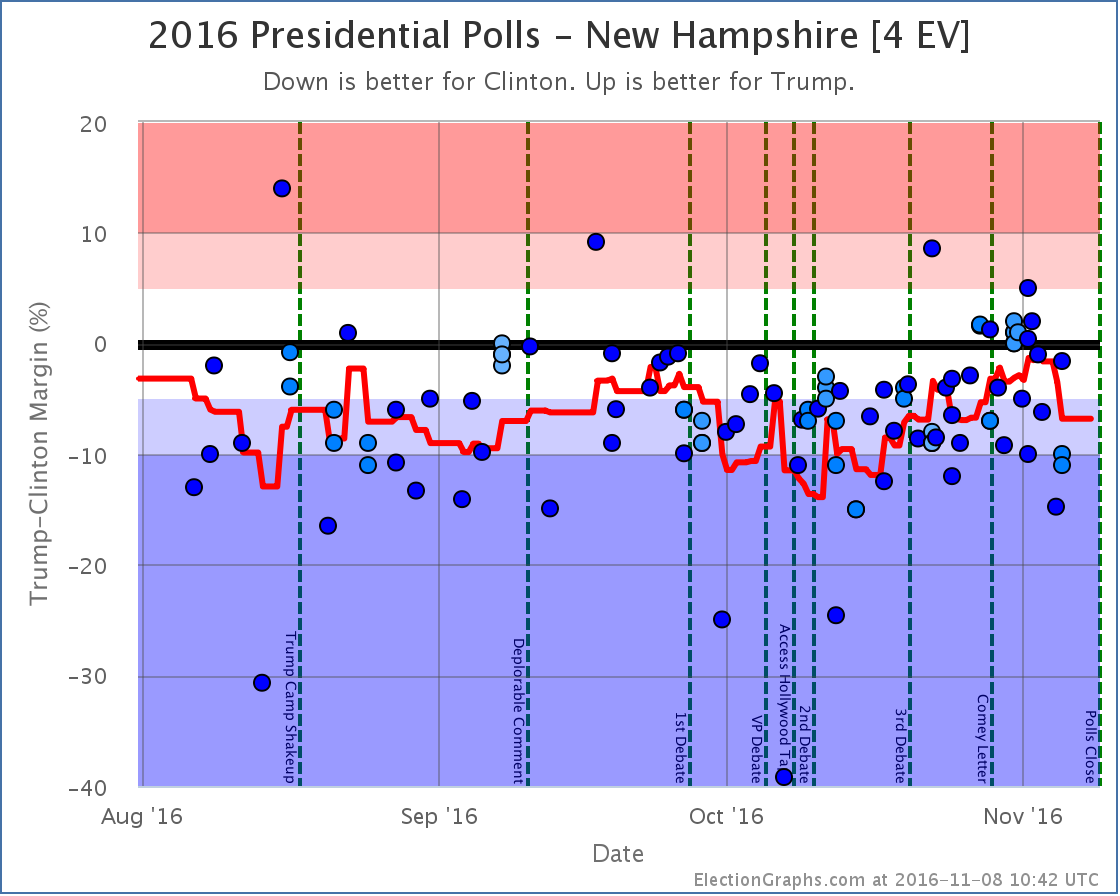
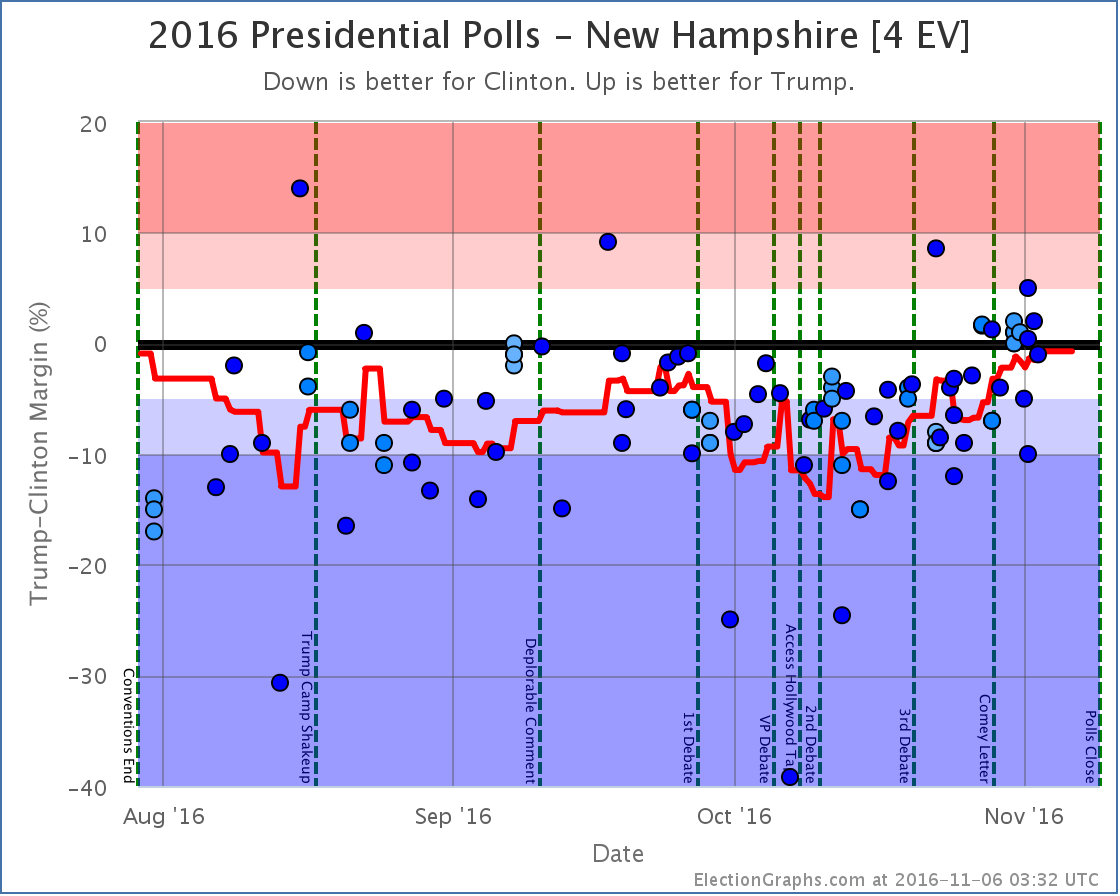
CNN has called New Hampshire for Clinton. Expected. Since New Hampshire was not a “weak” state this does not change the range of outcomes.
- Trump best case: Clinton 232 Trump 306 – Trump wins by 74
- Expected case: Clinton 248 Trump 290 – Trump by 42
- Clinton best case: Clinton 248 Trump 290 – Trump by 42
Only Michigan is outstanding now. Trump leads. So the Trump wins by 74 scenario is expected as of now, but CNN hasn’t called it yet, so presumably they still see some scenario where that might change. So we continue to wait to finalize these results. Absent faithless electors of course. :-)
24:00
24 hours after the first states were fully closed. Still waiting on New Hampshire and Michigan. Both were very close. We may be waiting awhile for things like absentee ballots and such.
20:11
CNN has called Minnesota for Clinton and Nebraska CD2 for Trump. Both expected. Because neither of these were “Weak” states, the range of remaining possibilities does not narrow.
Current stats:
- Trump best case: Clinton 232 Trump 306 – Trump wins by 74
- Expected case: Clinton 248 Trump 290 – Trump by 42
- Clinton best case: Clinton 248 Trump 290 – Trump by 42
Still outstanding with no call by CNN:
- Expected Strong Clinton: New Hampshire
- Expected Weak Clinton: Michigan
19:12
A little sleep and some breakfast later… and CNN has not yet called any more races.
We’ll keep monitoring until all the races are called, then do a quick post mortum on what states we got right, and which we got wrong. So far the averages here had four errors:
- Expected Weak Clinton Maine CD2 went for Trump instead of Clinton
- Expected Weak Clinton Pennsylvania went for Trump instead of Clinton
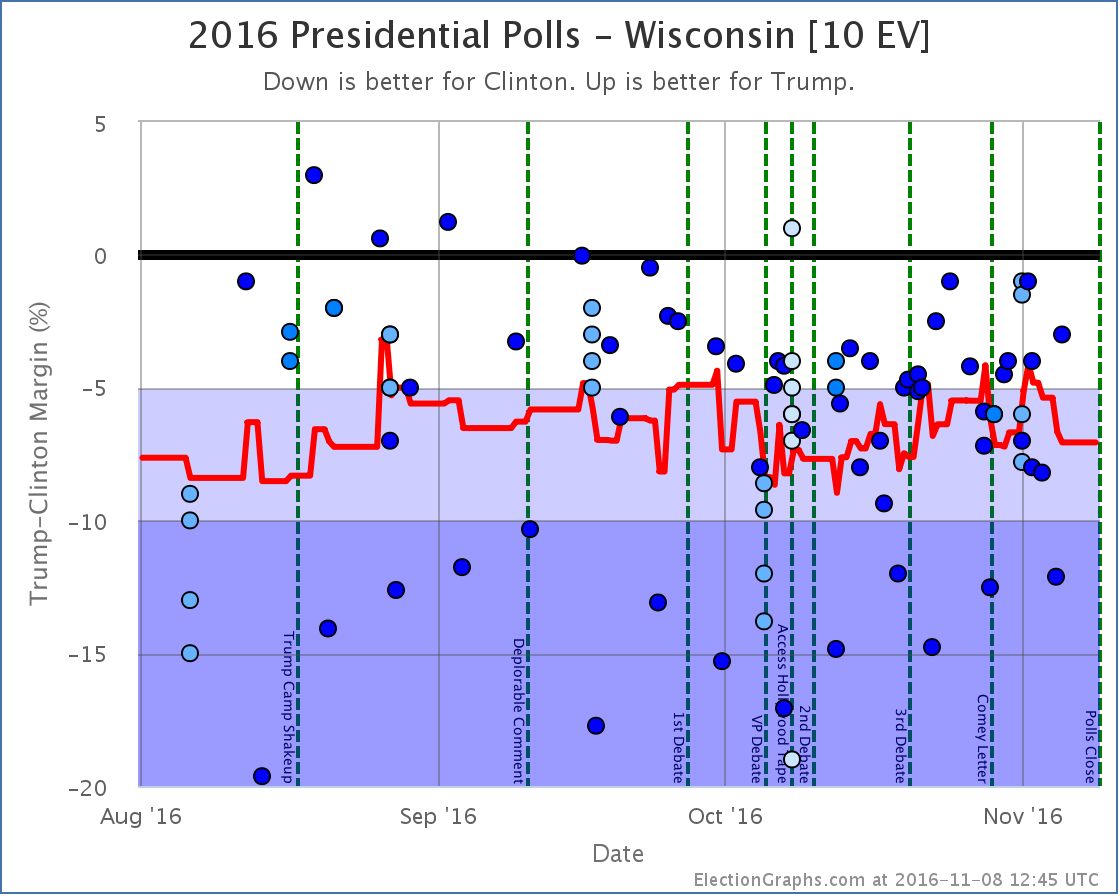
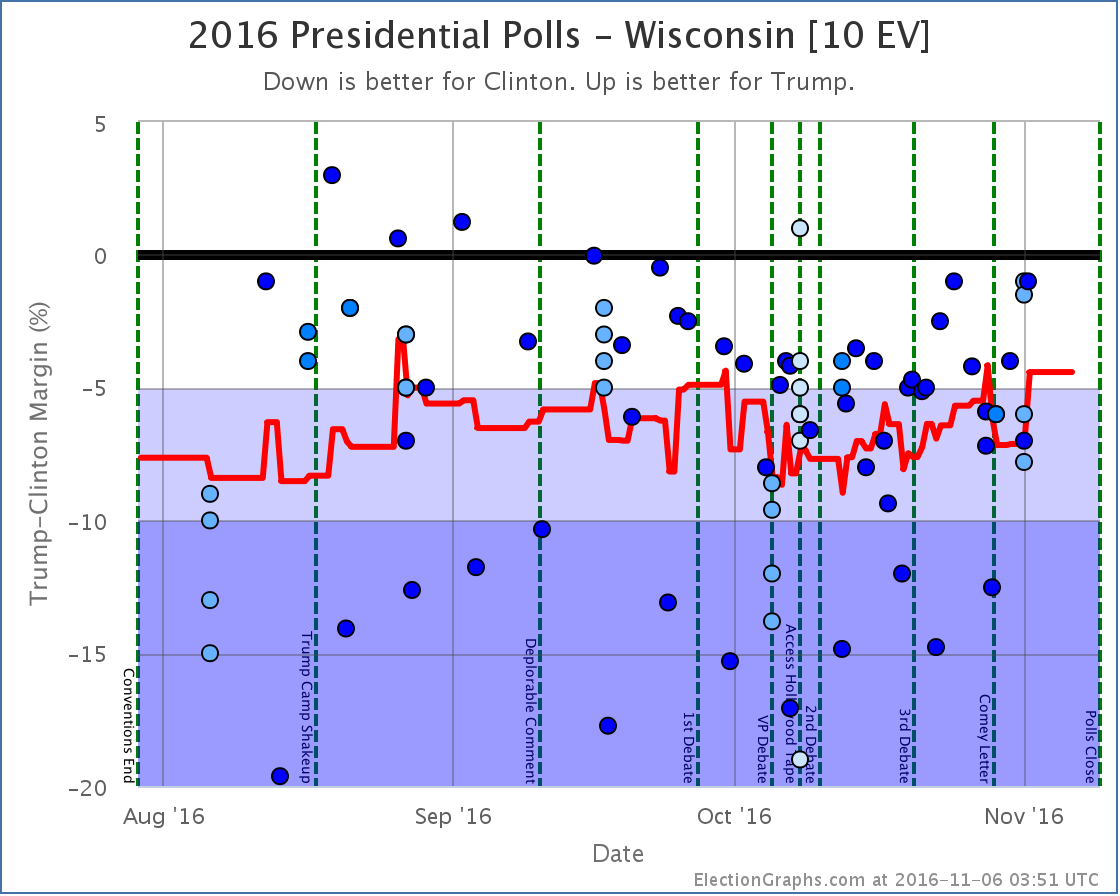
- Expected Strong Clinton Wisconsin went for Trump instead of Clinton
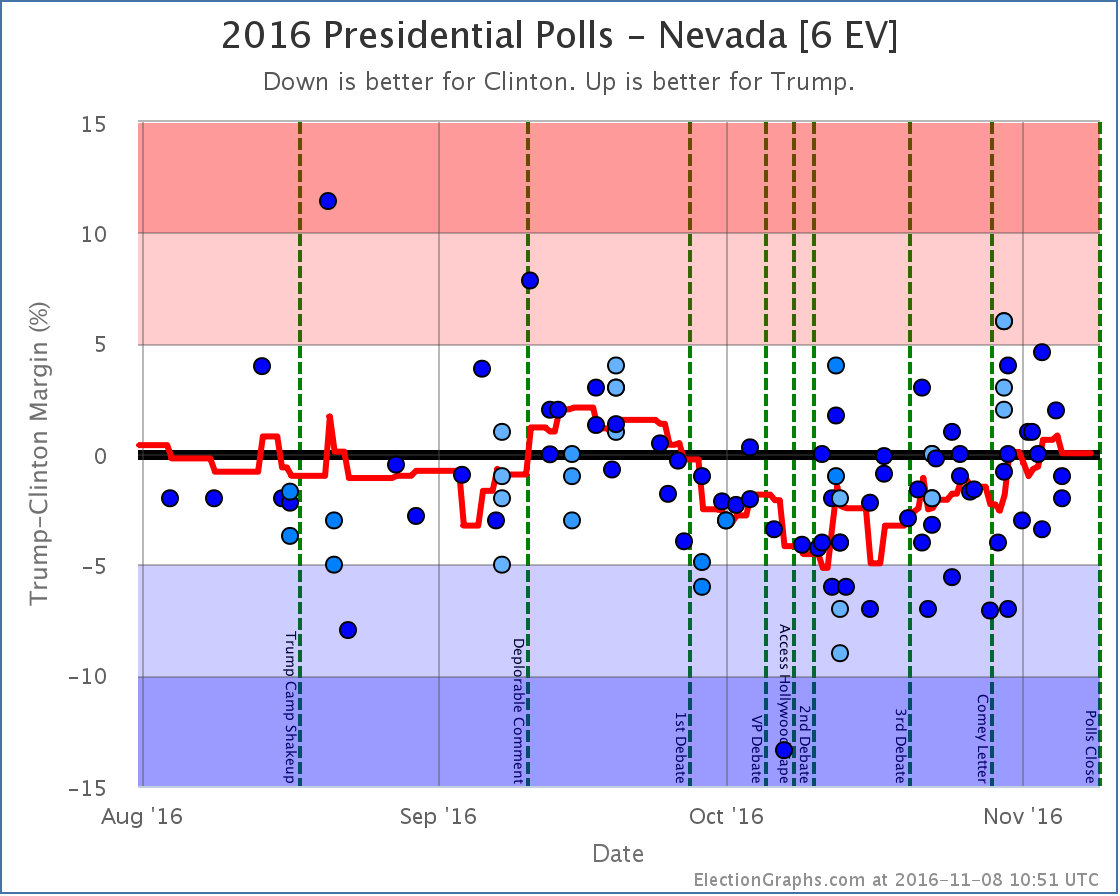
- Expected Weak Trump Nevada went for Clinton instead of Trump
The weak states flipping was not a huge surprise. They were “weak” states anyway. The margins were close. By definition of the category they could all have been expected to go either way.
Of the four above Wisconsin is the big surprise.
We’ve gotten all the other states right so far.
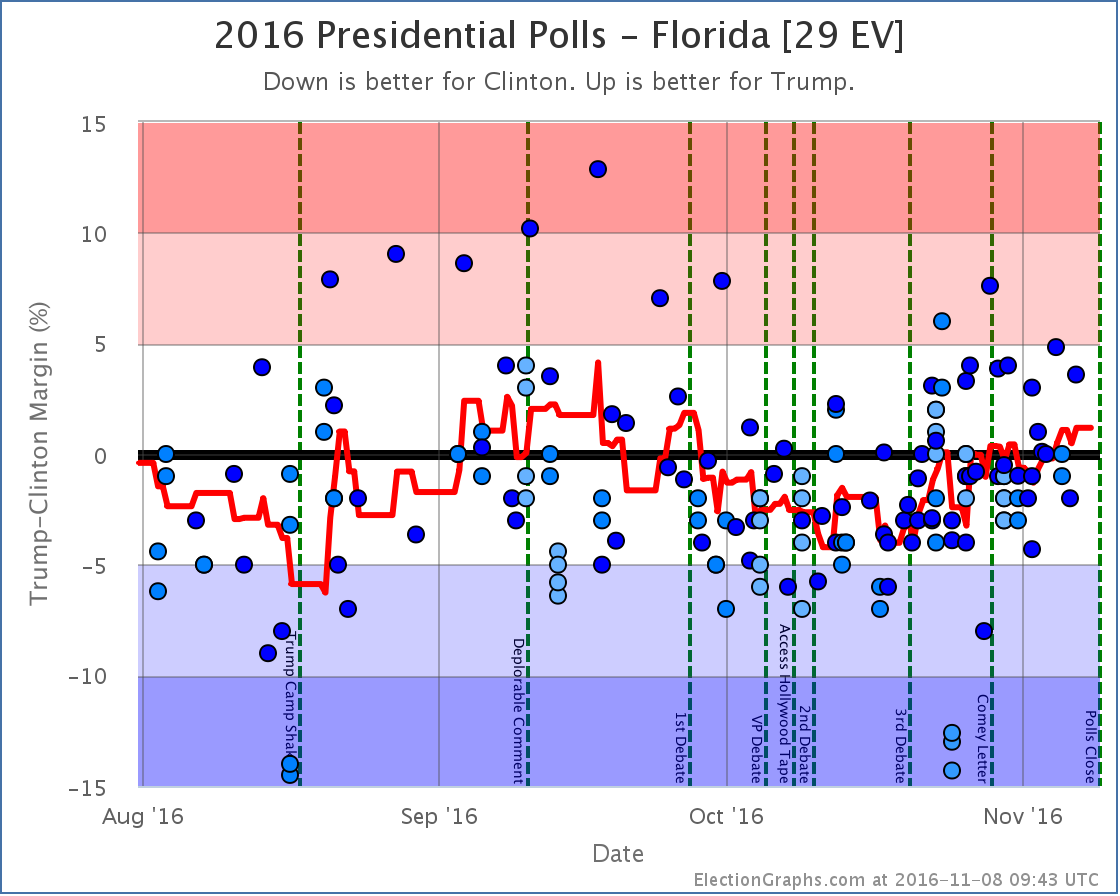
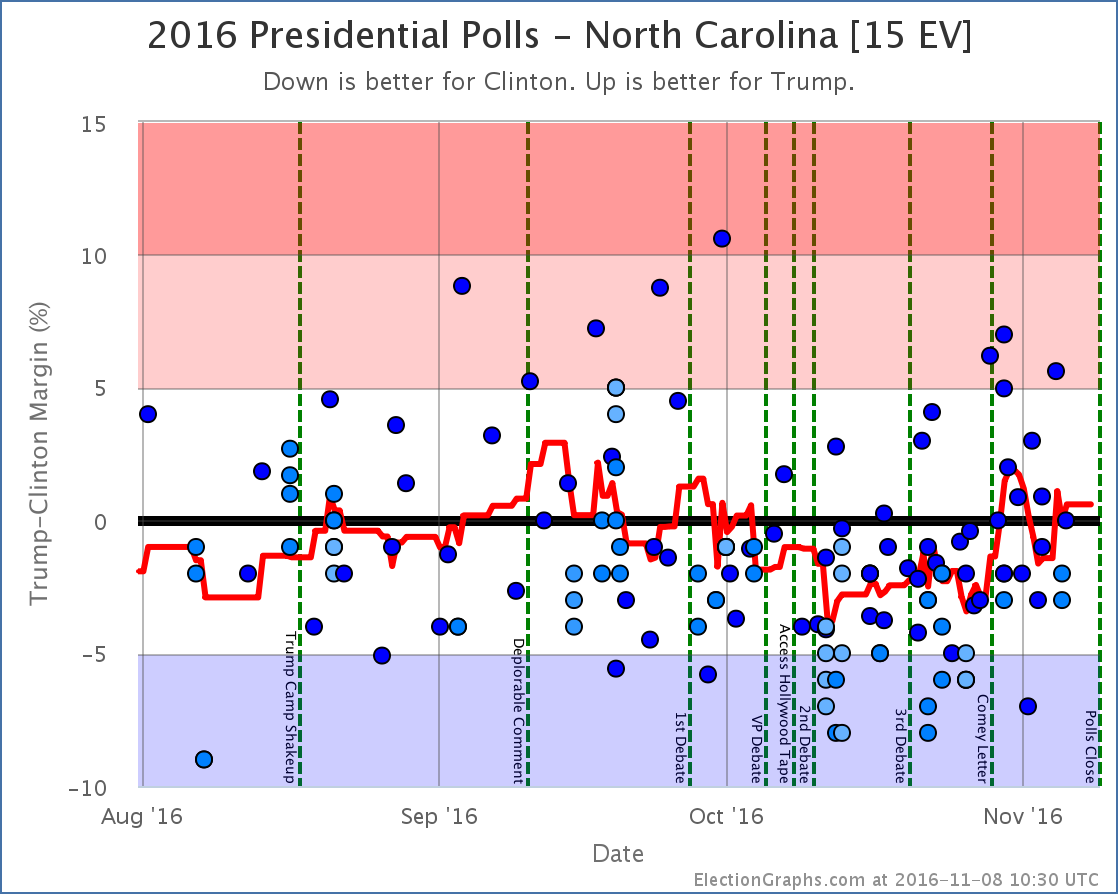
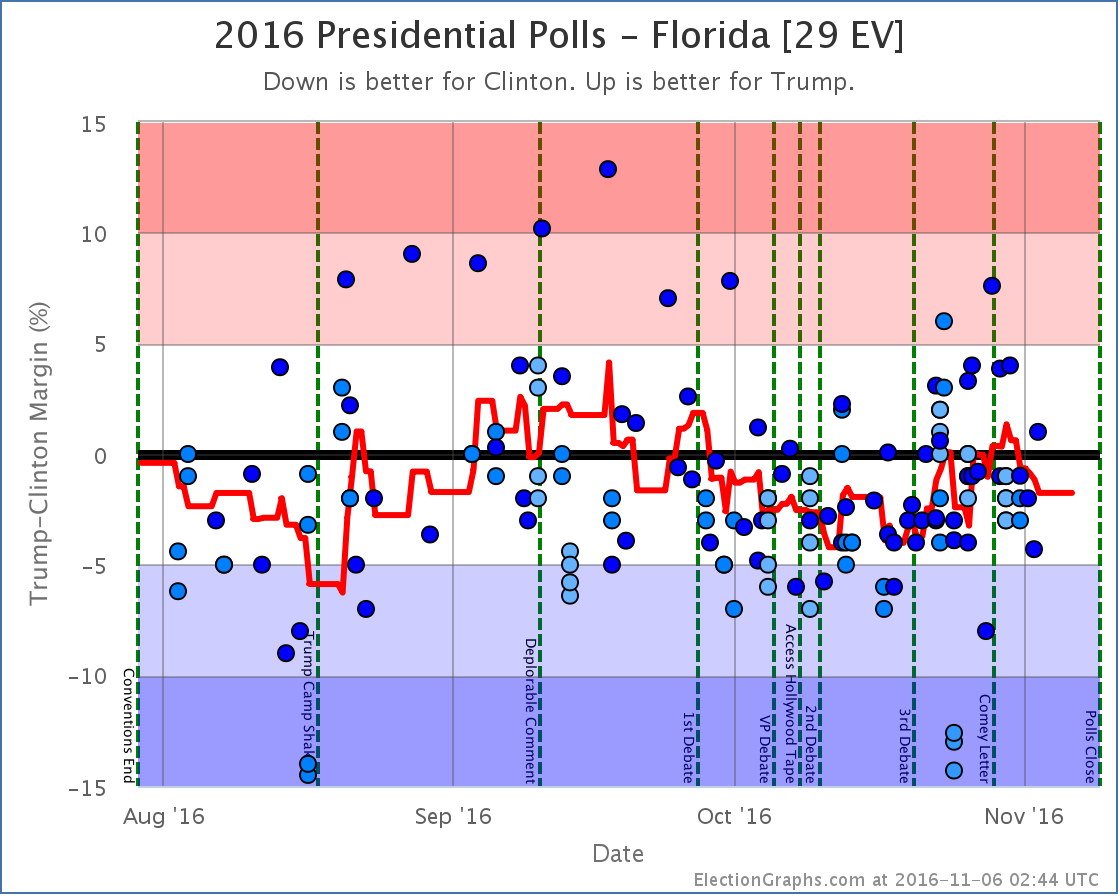
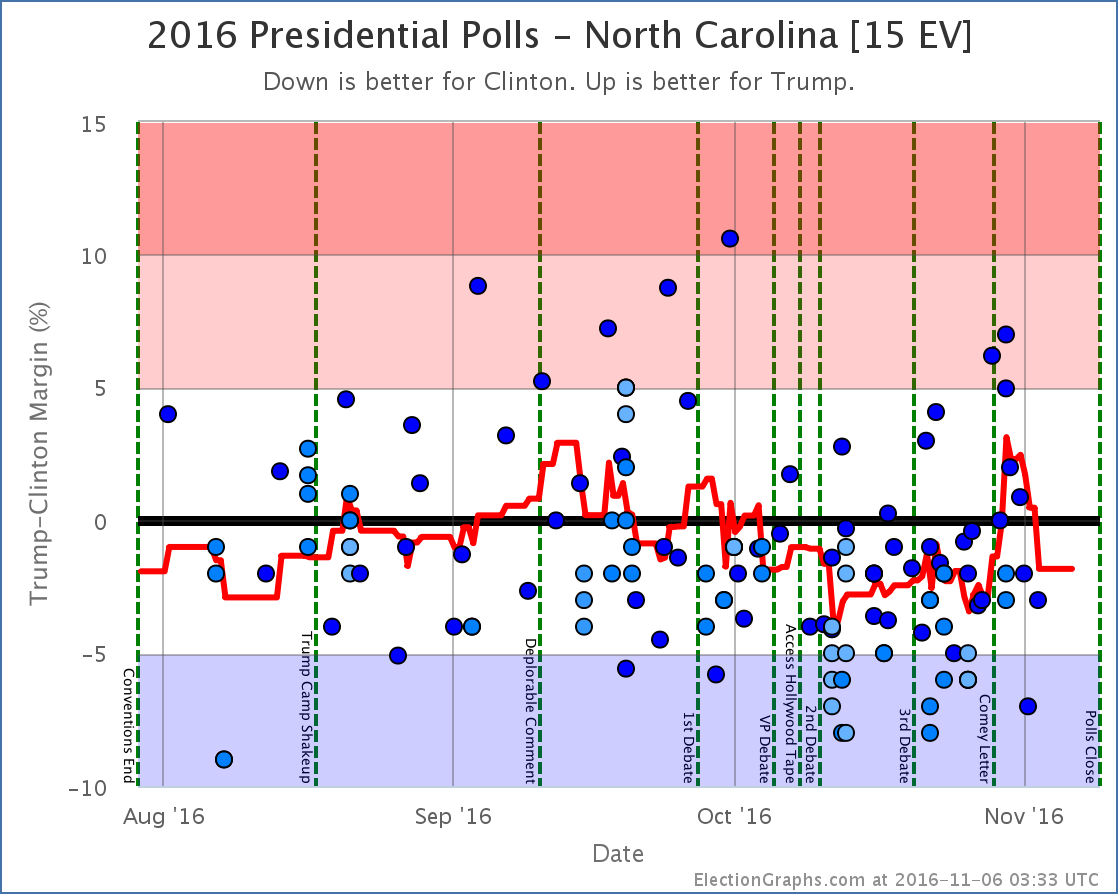
This includes Florida and North Carolina, where I specifically doubted my own numbers, but the averages here got it right in the end where many others got them wrong. (My doubts turned out to be correct on Nevada though.)
Still outstanding with no call by CNN:
- Expected Strong Clinton: New Hampshire, Minnesota
- Expected Weak Clinton: Michigan
- Expected Strong Trump: Nebraska CD2
11:29
Not that it matters in our system, but as of a minute or two ago, it looks like Clinton passed Trump in the national popular vote. But her support was too concentrated in blue states, so that didn’t translate into an electoral victory.
Also, there have been no more calls for a couple hours, and the vote totals in the outstanding states don’t seem to be moving at the moment and I’ve been updating for 12+ hours straight… so I think we’ll wrap it up for a bit. I’ll be back after a few hours and will provide updates on those last remaining states when available.
8:54
CNN calls Maine-All and Maine-CD1 for Clinton, and Maine-CD2 for Trump. CD2 is another “surprise”. The average had been in the red for awhile but slipped back to the blue before the election.
New numbers:
- Trump best case: Clinton 232 Trump 306 – Trump wins by 74
- Expected case: Clinton 248 Trump 290 – Trump by 42
- Clinton best case: Clinton 248 Trump 290 – Trump by 42
Trump’s margin will be somewhere between 43 and 74 depending on the remaining calls.
Still waiting on:
- Strong Clinton: New Hampshire, Minnesota
- Weak Clinton: Michigan,
- Strong Trump: Nebraska CD2
8:17
Looks like McMullin is now in a solid 3rd place in Utah. No longer looking like he might take 2nd.
7:59
I can tell from the little map they have in the corner during the Trump speech that they called Pennsylvania for Trump. Another one that had been leaning Clinton in the poll averages. updated range:
- Trump best case: Clinton 232 Trump 306 – Trump wins by 74
- Expected case: Clinton 249 Trump 289 – Trump by 40
- Clinton best case: Clinton 249 Trump 289 – Trump by 40
With this any non-Trump option officially disappears. Margin could still end up between 40 and 74 depending on how the remaining states go.
Still waiting on calls for the following:
- Solid Clinton: Maine CD1, Maine All
- Strong Clinton: New Hampshire, Minnesota
- Weak Clinton: Michigan, Maine CD2,
- Strong Trump: Nebraska CD2
7:48
CNN calls the election as Trump takes the stage, without specifying which additional states they are calling. Presumably those details will come later.
7:42
Arizona called for Trump. Expected. New status:
- Trump best case: Clinton 232 Trump 306 – Trump wins by 74
- Expected case: Clinton 269 Trump 269 – TIE – Election to the House
- Clinton best case: Clinton 269 Trump 269 – TIE – Election to the House
Now the best Clinton could do is tie. But she would have to win states she is way behind in and will assuredly be called soon. And she has already conceded. Trump to speak soon.
7:40
Clinton called Trump to concede. Done. (We will keep tracking results until all states are called.)
7:39
AP has called the election. CNN waiting on calling one more state.
7:30
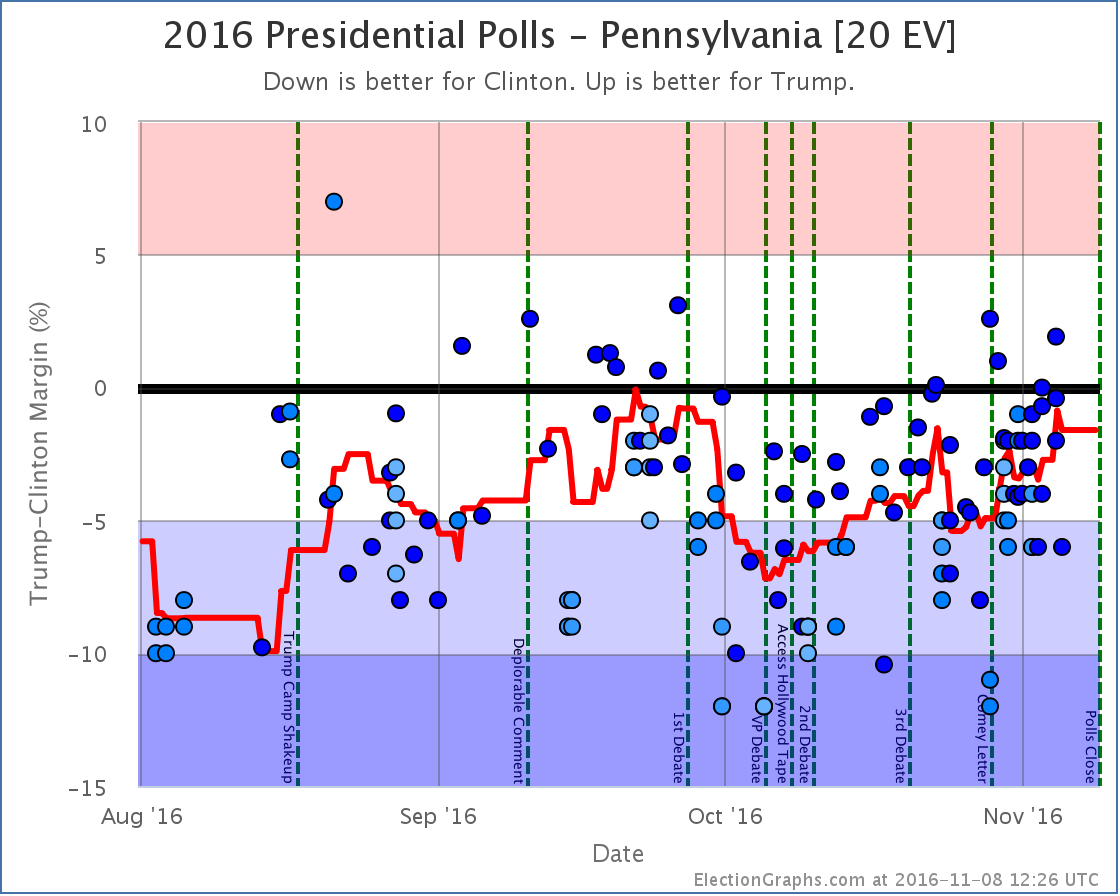
One of the big ones, and one of the big surprises. CNN calls Wisconsin, which the poll average had at a 7.1% Clinton lead, just got called for Trump. This was a state that was supposed to be safe Clinton and not even in play. The new summary:
- Trump best case: Clinton 232 Trump 306 – Trump wins by 74
- Expected case: Clinton 269 Trump 269 – TIE – Election to the House
- Clinton best case: Clinton 280 Trump 258 – Clinton wins by 22
Trump actually improved his best case over the last update because he won a state that wan’t even in play.
To tie Clinton would have to hold Maine CD1, Maine All, New Hampshire, Minnesota, Michigan, Maine CD2, and Pennsylvania.
She is behind in several of those. The scenarios which would have her actually winning would have her do all of the above, plus win Arizona.
Still waiting on calls for these states:
- Solid Clinton: Maine CD1, Maine All
- Strong Clinton: New Hampshire, Minnesota
- Weak Clinton: Michigan, Maine CD2, Pennsylvania
- Weak Trump: Arizona
- Strong Trump: Nebraska CD2
7:17
Still waiting on calls for these states:
- Solid Clinton: Maine CD1, Maine All
- Strong Clinton: New Hampshire, Wisconsin, Minnesota
- Weak Clinton: Michigan, Maine CD2, Pennsylvania
- Weak Trump: Arizona
- Strong Trump: Nebraska CD2
6:41
Alaska called for Trump. Expected. Not one of the anticipated swing states. So no change to the summary:
- Trump best case: Clinton 242 Trump 296 – Trump wins by 54
- Expected case: Clinton 279 Trump 259 – Clinton wins by 20
- Clinton best case: Clinton 290 Trump 248 – Clinton wins by 42
So far this site has only gotten one state wrong, and that was one where Clinton won when she was not expected to. I expect to get several wrong in the other direction when CNN finally gives up and calls some of these last states.
6:30
Note that the two “best cases” assume nobody loses a state that they were leading by more than 5%. It certainly looks possible that Clinton may end up losing a state that she was ahead by more than 5% in. So Trump may end up doing better than his current best case.
6:10
Utah called for Trump. As expected. And not one of the close states. So no change to the summary.
- Trump best case: Clinton 242 Trump 296 – Trump wins by 54
- Expected case: Clinton 279 Trump 259 – Clinton wins by 20
- Clinton best case: Clinton 290 Trump 248 – Clinton wins by 42
6:05
CNN hanging on and not calling MI, NH, PA, WI. But most others are calling at least some of those for Trump. I’ll continue to track CNN until all states are called, but this thing is over. Trump has won the presidency.
5:34
The first “surprise” of the night. This site’s estimate was that Nevada would go for Trump. It was just called for Clinton. Probably not enough. She still has to come back and win in states she is way behind in.
- Trump best case: Clinton 242 Trump 296 – Trump wins by 54
- Expected case: Clinton 279 Trump 259 – Clinton wins by 20
- Clinton best case: Clinton 290 Trump 248 – Clinton wins by 42
5:08
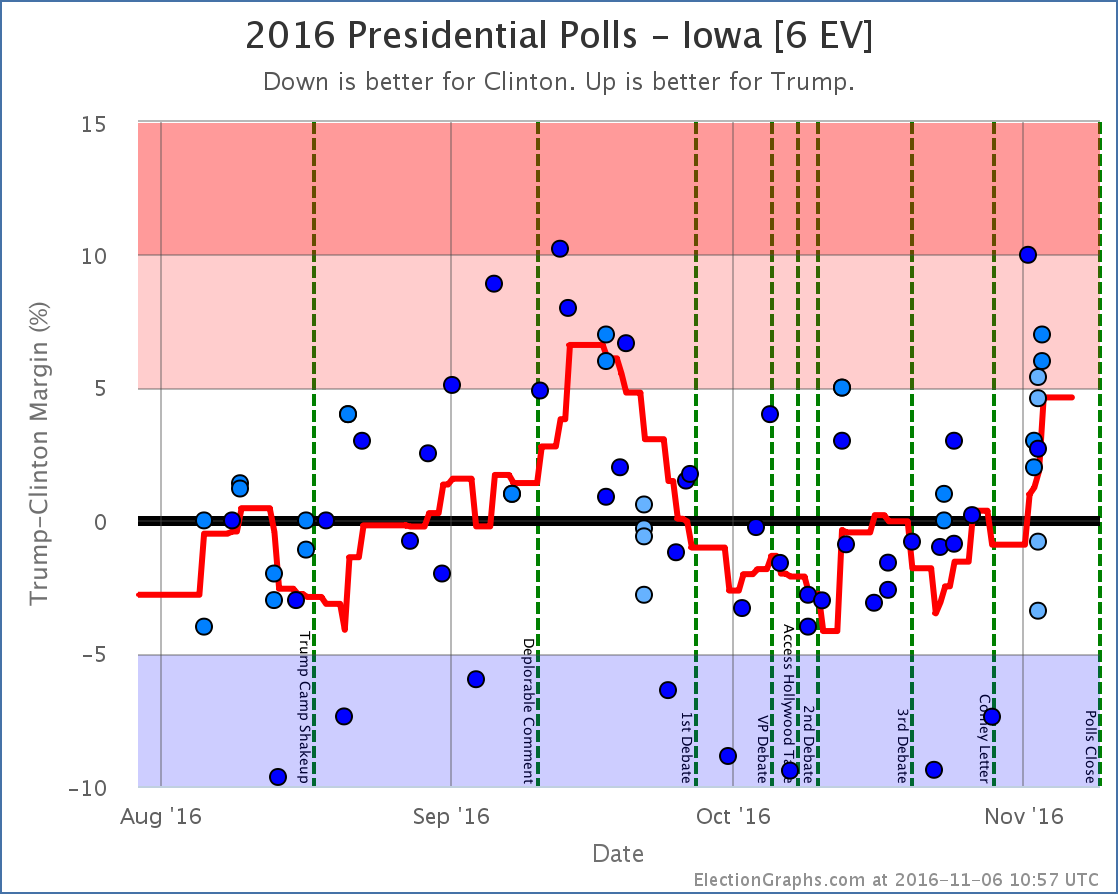
Iowa to Trump. Expected as well. So far every state as expected. But Clinton is behind in states she was expected to be ahead in. Her best case is shrinking fast.
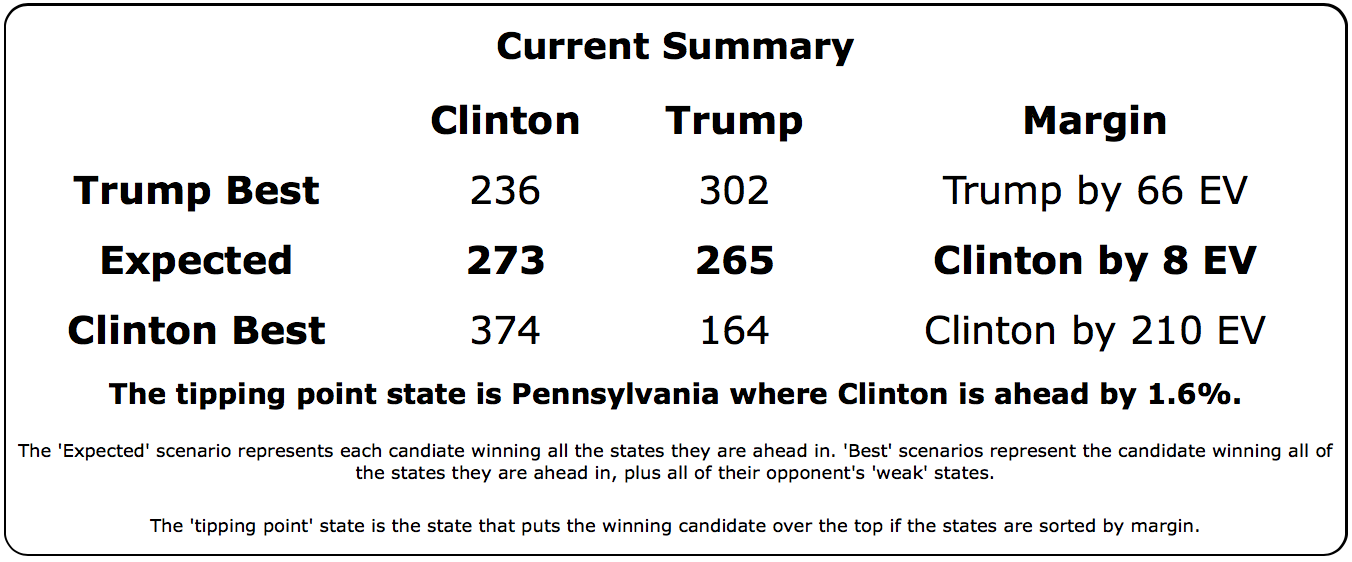
- Trump best case: Clinton 236 Trump 302 – Trump wins by 66
- Expected case: Clinton 273 Trump 265 – Clinton wins by 8
- Clinton best case: Clinton 290 Trump 248 – Clinton wins by 42
4:57
269 to 269 is not out of the question. Which throws it to the house. And probably Trump, but opens doors for shenanigans.
4:53
McMullin very close to 2nd place in Utah.
4:48
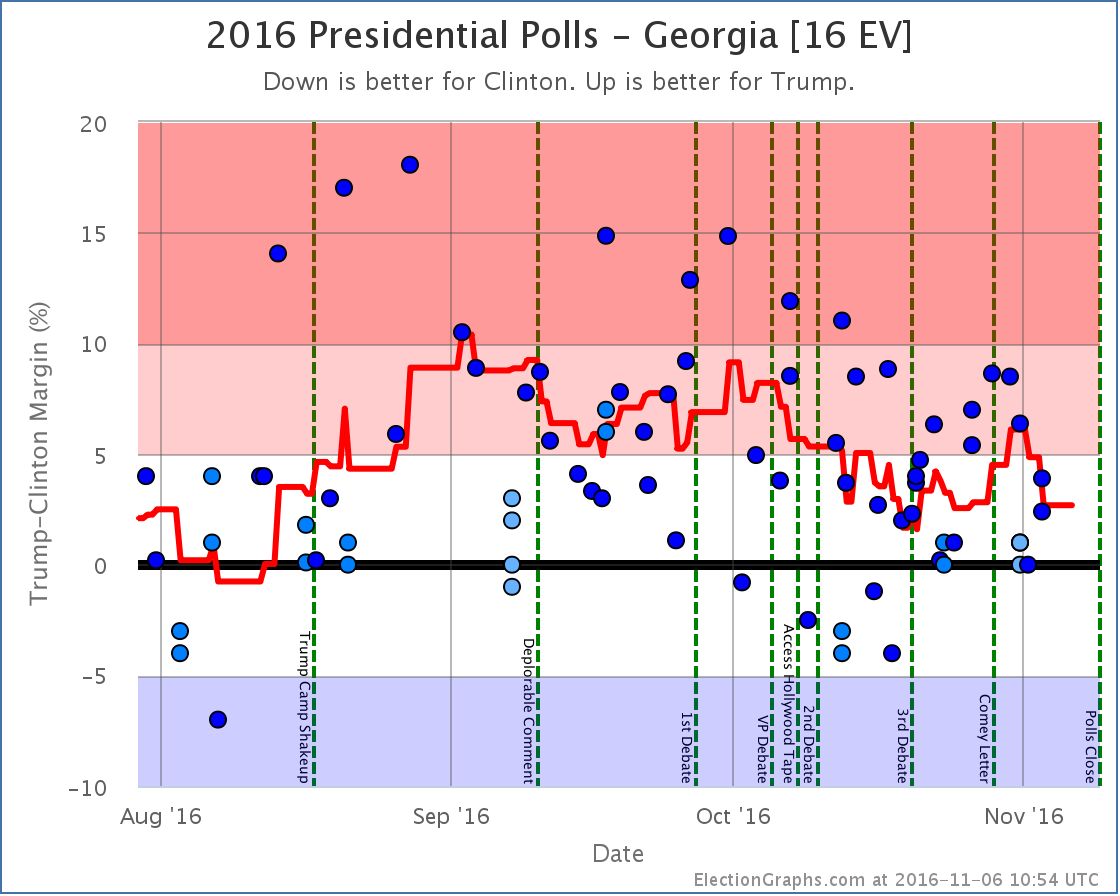
Trump wins Georgia. Expected. Still no surprise states. But several are in the wings. Clinton’s best case reduces further.
- Trump best case: Clinton 236 Trump 302 – Trump wins by 66
- Expected case: Clinton 273 Trump 265 – Clinton wins by 8
- Clinton best case: Clinton 296 Trump 242 – Clinton wins by 54
Clinton is almost done here unless something changes dramatically.
4:41
Washington for Clinton. Expected.
- Trump best case: Clinton 236 Trump 302 – Trump wins by 66
- Expected case: Clinton 273 Trump 265 – Clinton wins by 8
- Clinton best case: Clinton 312 Trump 226 – Clinton wins by 86
4:35
Florida called for Trump. As expected. Still nothing going other than how the states led on this site. But this was another close state, and once again reduces Clinton’s best case. And she is behind in some of the close states. Some places have already called some for Trump. CNN hasn’t yet.
- Trump best case: Clinton 236 Trump 302 – Trump wins by 66
- Expected case: Clinton 273 Trump 265 – Clinton wins by 8
- Clinton best case: Clinton 312 Trump 226 – Clinton wins by 86
Fox has called Wisconsin for Trump. If so, game over. The only question will be Trump’s margin.
4:31
Clinton can afford to lose Maine CD2 if she wins everything else where she led on this site. That is the only thing she can afford to lose. She has to sweep everything else or she is done.
4:17
Oregon to Clinton. Nebraska’s 1st district to Trump. Both expected.
All states have gone as expected on this site so far, but Clinton can’t afford to lose a single state she led in here. Right now that means Pennsylvania, Michigan, Wisconsin, Minnesota, and New Hampshire as the weakest ones. She has to win every single one of them. (Well, losing New Hampshire throws the race to the House, assuming she wins Maine CD2.)
- Trump best case: Clinton 236 Trump 302 – Trump wins by 66
- Expected case: Clinton 273 Trump 265 – Clinton wins by 8
- Clinton best case: Clinton 341 Trump 197 – Clinton wins by 144
And she is behind in several.
4:08
North Carolina called for Trump. That is expected. It is our second close state though, so that takes winning that out of Clinton’s best case. New stats:
- Trump best case: Clinton 236 Trump 302 – Trump wins by 66
- Expected case: Clinton 273 Trump 265 – Clinton wins by 8
- Clinton best case: Clinton 341 Trump 197 – Clinton wins by 144
4:02
California and Hawaii called for Clinton. Both expected. Still waiting on a surprise state, but they must be coming.
- Trump best case: Clinton 236 Trump 302 – Trump wins by 66
- Expected case: Clinton 273 Trump 265 – Clinton wins by 8
- Clinton best case: Clinton 356 Trump 182 – Clinton wins by 174
4:00
California, Washington, Oregon and Idaho now closed. None of them are expected to be remotely close.
3:49
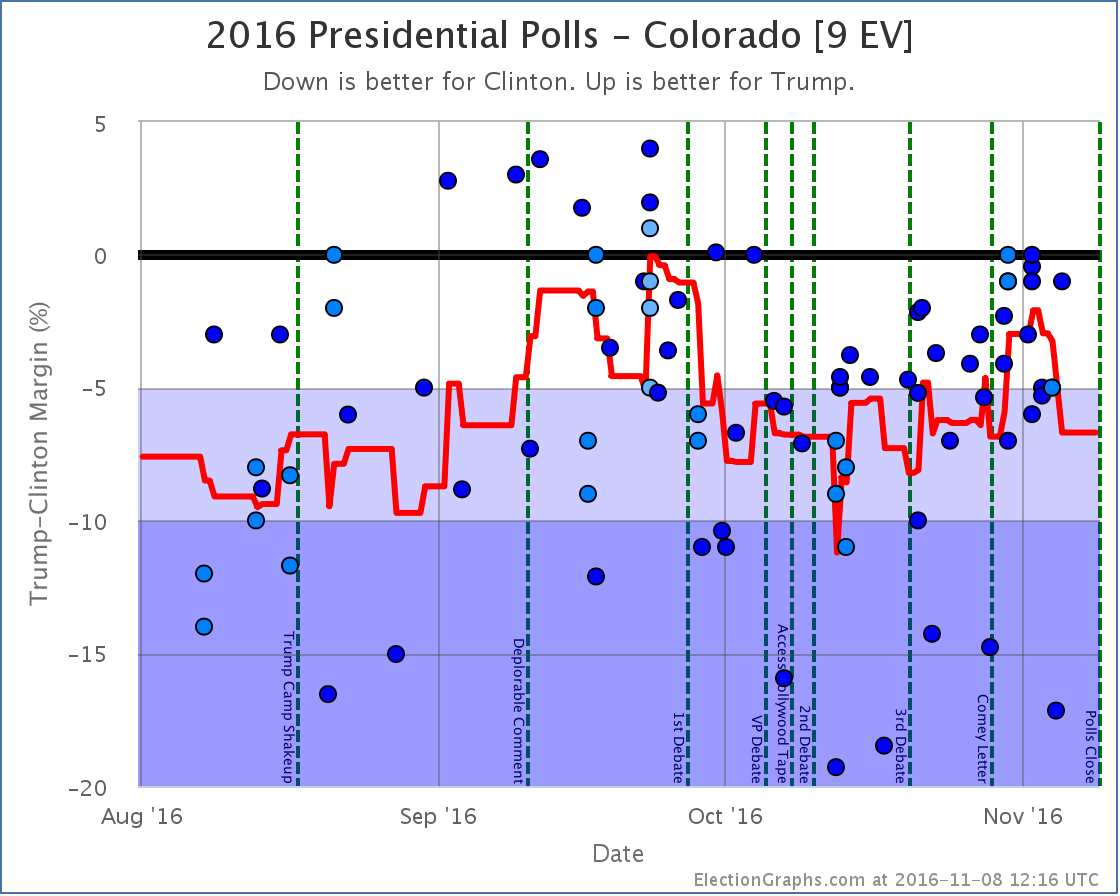
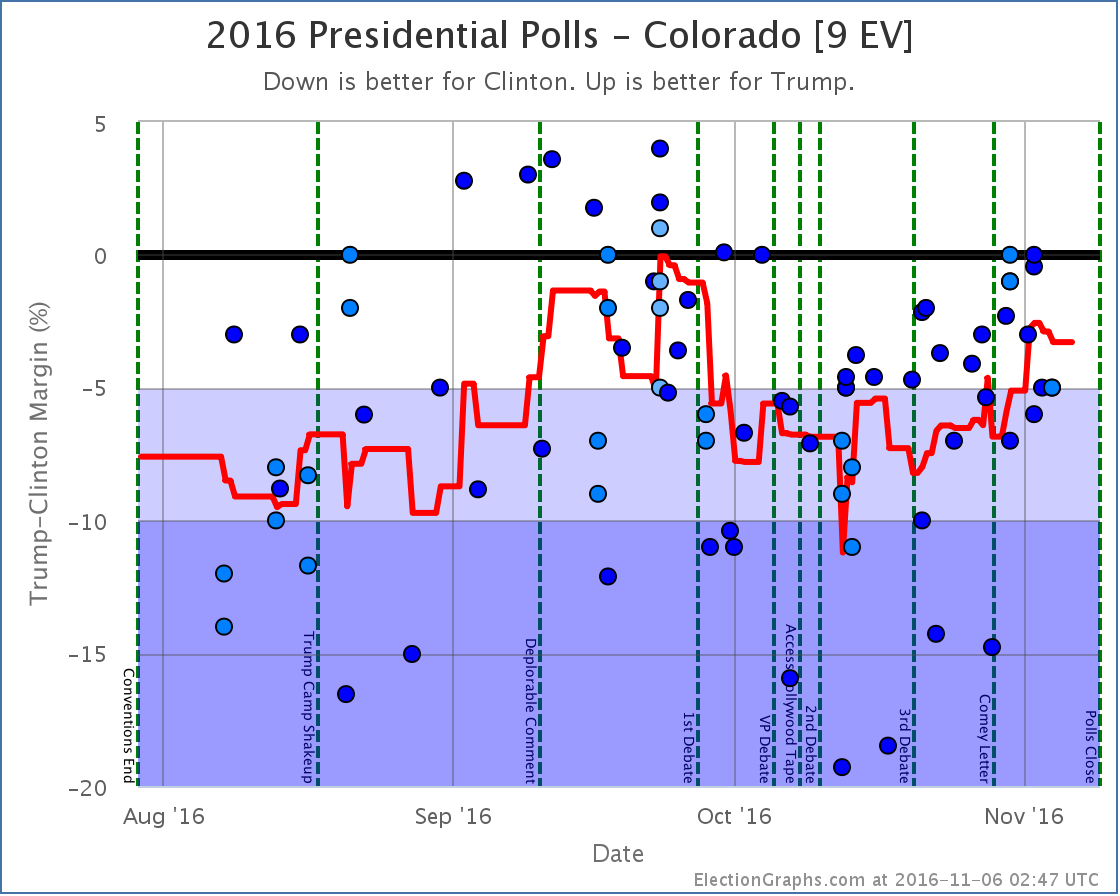
Colorado to Clinton as expected. Still no states actually going opposite the expected direction.
But all the talk is about the close states that have not been called all leaning toward Trump at the moment.
- Trump best case: Clinton 236 Trump 302 – Trump wins by 66
- Expected case: Clinton 273 Trump 265 – Clinton wins by 8
- Clinton best case: Clinton 356 Trump 182 – Clinton wins by 174
3:39
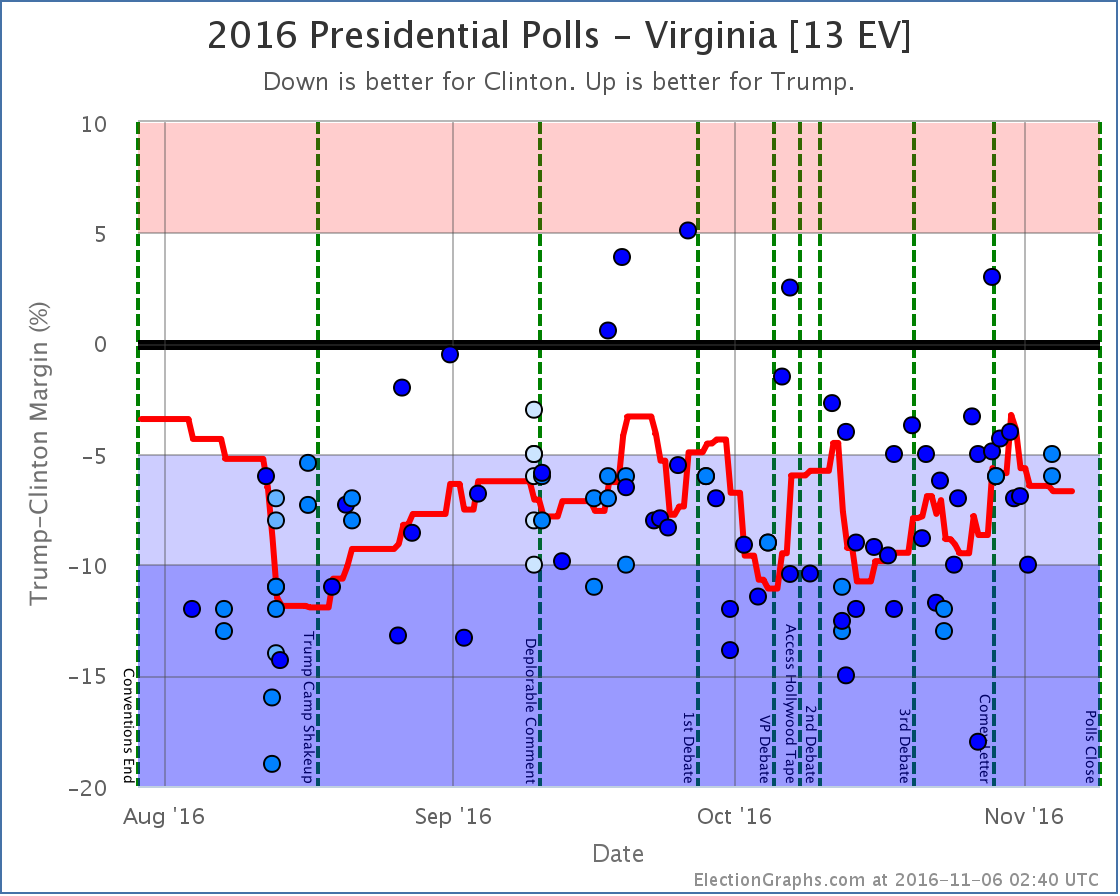
Virginia goes to Clinton as expected. But it was expected to be easy. It wasn’t.
- Trump best case: Clinton 236 Trump 302 – Trump wins by 66
- Expected case: Clinton 273 Trump 265 – Clinton wins by 8
- Clinton best case: Clinton 356 Trump 182 – Clinton wins by 174
3:26
The first close state just got called. Ohio, which went to Trump… as expected. So we still don’t have a surprise state. But this now does reduce Clinton’s best case.
- Trump best case: Clinton 236 Trump 302 – Trump wins by 66
- Expected case: Clinton 273 Trump 265 – Clinton wins by 8
- Clinton best case: Clinton 356 Trump 182 – Clinton wins by 174
3:19
NYT now has Trump at a 79% chance of winning. I said a few weeks ago the main question was not who was going to win, but just how big Clinton’s margin would be. That if Trump came back from where he was at that point it would be the biggest comeback in US presidential history. It is looking more and more like that may happen.
3:15
Missouri for Trump. New Mexico for Clinton.
Still every state as expected, and none of the “weak” states that were expected to be close called yet.
3:09
A while ago the networks all called that the House would stay Republican. That was expected.
- Trump best case: Clinton 236 Trump 302 – Trump wins by 66
- Expected case: Clinton 273 Trump 265 – Clinton wins by 8
- Clinton best case: Clinton 374 Trump 164 – Clinton wins by 210
3:01
Montana called immediately for Trump. Expected. Still no “weak” states called, so the summary of possibilities remains the same:
- Trump best case: Clinton 236 Trump 302 – Trump wins by 66
- Expected case: Clinton 273 Trump 265 – Clinton wins by 8
- Clinton best case: Clinton 374 Trump 164 – Clinton wins by 210
3:00
Nevada, Iowa, Montana, and Utah now closed. Nevada and Iowa both expected to be close.
I said in my last week’s podcast that if there was a Trump win people should be surprised, because he would have beat the odds, but not shocked, because it was within the realm of possibility.
We’ll see.
Given how the rest of the night is going, it will be very interesting to see real McMullin numbers.
2:41
Connecticut and Louisiana both called as expected.
- Trump best case: Clinton 236 Trump 302 – Trump wins by 66
- Expected case: Clinton 273 Trump 265 – Clinton wins by 8
- Clinton best case: Clinton 374 Trump 164 – Clinton wins by 210
Still no surprises in the called states, but many of the uncalled states are surprising people by how close they are. Odds sites are increasing Trump’s odds by the minute.
Weak states outstanding: Georgia (expected Trump), North Carolina (expected Trump), Ohio (expected Trump), Michigan (expected Clinton), Maine CD2 (expected Clinton), Pennsylvania (expected Clinton), Florida (expected Trump), Arizona (expected Trump)
Since Virginia seems like it might be in play, here are the “strong” states still outstanding as well: Virginia (expected Clinton), New Hampshire (expected Clinton), Missouri (expected Trump), Wisconsin (expected Clinton), Colorado (expected Clinton), New Mexico (expected Clinton), Minnesota (expected Clinton), Nebraska CD2 (expected Trump)
2:29
Maybe those last minute poll shifts I was dubious about were real. Certainly looking that way in Florida and North Carolina at the moment.
2:24
If Clinton doesn’t catch up in Virginia, it will look very bad for Clinton, as she was expected to win that state easily and it may indicate shifts elsewhere.
2:13
Texas and Arkansas both called for Trump. Again no surprises.
- Trump best case: Clinton 236 Trump 302 – Trump wins by 66
- Expected case: Clinton 273 Trump 265 – Clinton wins by 8
- Clinton best case: Clinton 374 Trump 164 – Clinton wins by 210
Expected close states we are waiting for: Georgia, North Carolina, Ohio, Michigan, Maine CD2, Pennsylvania, Florida, Arizona
2:02
Instantly called: NY for Clinton, KS, NE-All, SD, ND, WY, NE-CD3. No surprises.
- Trump best case: Clinton 236 Trump 302 – Trump wins by 66
- Expected case: Clinton 273 Trump 265 – Clinton wins by 8
- Clinton best case: Clinton 374 Trump 164 – Clinton wins by 210
2:00
Just closed:
- Solid Clinton: NY
- Strong Clinton: WI, CO, NM, MN
- Weak Trump: AZ
- Strong Trump: NE-CD2, TX
- Solid Trump: KS, NE-All, SD, LA, NE-CD1, ND, WY, NE-CD3
The only one to really watch is AZ.
Interesting VA is still outstanding. Was supposed to be easy Clinton. Although it looks like the heavily Democratic parts of the state are slow counting.
As expected, Trump has taken a lead in Texas. That Clinton lead was never going to last. :-)
1:42
Interesting states we are waiting on: Georgia, North Carolina, Ohio, Michigan, Maine CD2, Pennsylvania, Florida,
States that should be no brainers we are waiting on: Virginia, Maine CD1, Connecticut, Maine All, New Hampshire, Missouri
1:31
South Carolina and Alabama both called for Trump. Both expected.
- Trump best case: Clinton 236 Trump 302 – Trump wins by 66
- Expected case: Clinton 273 Trump 265 – Clinton wins by 8
- Clinton best case: Clinton 374 Trump 164 – Clinton wins by 210
Clinton ahead in Texas with more than 50% counted? That won’t last I don’t think…
1:30
Arkansas just closed. Expect it to be called for Trump near instantly.
1:23
Florida going back and forth in the count. Very close. That may take awhile.
1:11
Interesting CNN hasn’t called South Carolina yet. Other outlets have already called it. I’m sticking with CNN’s non-call for the moment.
No “interesting” states called yet. Longest closed outstanding states are VA/GA/SC. GA expected to be close. VA and SC are not.
1:04
DC, MA, MD, RI, IL, NJ, DE, TN, MS, OK all called instantly. No surprises.
- Trump best case: Clinton 236 Trump 302 – Trump wins by 66
- Expected case: Clinton 273 Trump 265 – Clinton wins by 8
- Clinton best case: Clinton 374 Trump 164 – Clinton wins by 210
Oops, TX doesn’t close until 2:00 due to the panhandle.
1:00
Lots of states closing this hour:
- Solid Clinton: DC, MA, MD, RI, ME-CD1, IL, CT, ME-All, NJ, DE
- Strong Clinton: NH
- Weak Clinton: MI, ME-CD2, PA
- Weak Trump: FL
- Strong Trump: MO, TX
- Solid Trump: TN, MS, OK, AL
The ones to watch are of course the close ones: Michigan, Maine CD2, Pennsylvania, and Florida
0:31
West Virginia called instantly for Trump. Not a surprise.
- Trump best case: Clinton 236 Trump 302 – Trump wins by 66
- Expected case: Clinton 273 Trump 265 – Clinton wins by 8
- Clinton best case: Clinton 374 Trump 164 – Clinton wins by 210
0:30
Now Closed:
- North Carolina (Weak Trump) – some precincts still open
- Ohio (Weak Trump)
- West Virginia (Solid Trump)
West Virginia should be called quickly.
0:01
Called instantly: Indiana and Kentucky for Trump, Vermont for Clinton.
No surprises. Picture remains the same:
- Trump best case: Clinton 236 Trump 302 – Trump wins by 66
- Expected case: Clinton 273 Trump 265 – Clinton wins by 8
- Clinton best case: Clinton 374 Trump 164 – Clinton wins by 210
0:00
Now closed:
- Vermont (Solid Clinton)
- Virginia (Strong Clinton)
- Georgia (Weak Trump)
- South Carolina (Strong Trump)
- Indiana (Solid Trump)
- Kentucky (Solid Trump)
Only Georgia is expected to be close. The rest should be called relatively quickly.
I will be following the state calls on CNN primarily, although if other outlets are calling a state and CNN is delaying, I may consider the call if most places seem to think it should be called.
-1:00
Polls are now closed in parts of Indiana and Kentucky (as well as the three small towns in New Hampshire), but we shouldn’t get any calls for another hour until full states start to close. So just a quick reminder of where we start the night:
- Trump best case: Clinton 236 Trump 302 – Trump wins by 66
- Expected case: Clinton 273 Trump 265 – Clinton wins by 8
- Clinton best case: Clinton 374 Trump 164 – Clinton wins by 210
Closing in an hour: Vermont, Virginia, Georgia, South Carolina, Indiana, and Kentucky. Georgia is the only one of those that is expected to be close.
Final Forecast on Election Day
After the last full update there were poll results added in Arizona, California, Nevada, and Washington. While these slightly changed the poll averages in those states, none changed the categorization of those states, or the tipping point. At 20 UTC on election day (3 PM Eastern, Noon Pacific) Election Graphs shut our books. If any straggler polls come in at this point, it is too late.
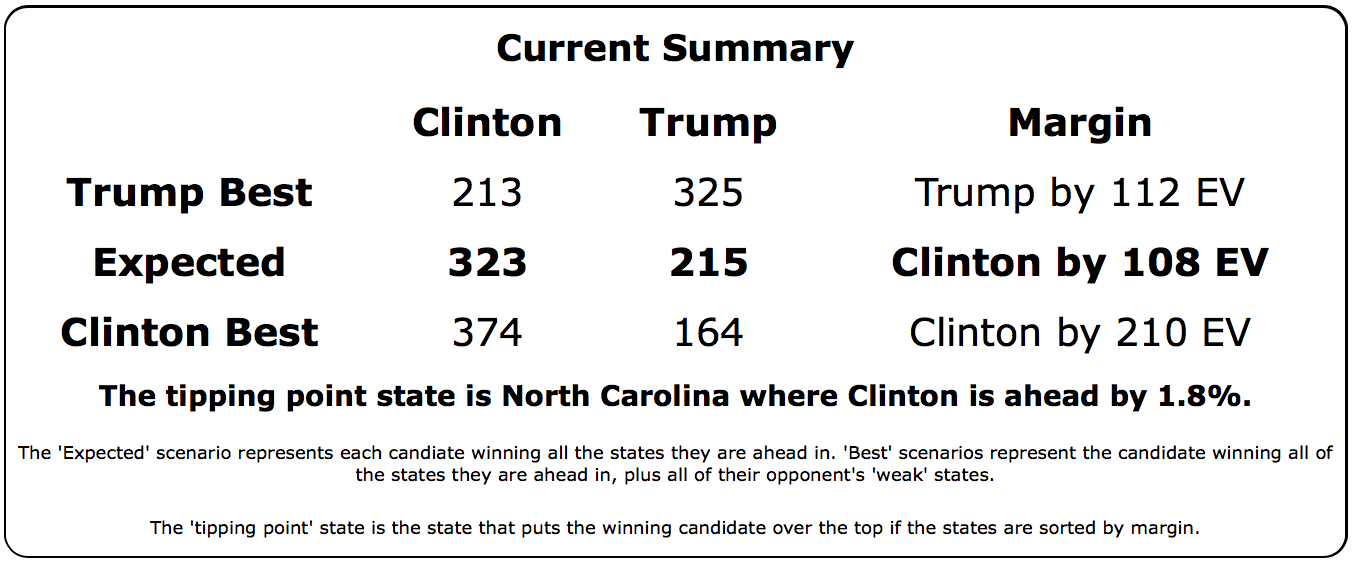
Final summary
As a point of personal privilege, I will note that I believe this site’s estimates on Sunday, when we had an expected case of Clinton 323 to Trump 215, a 108 electoral vote win for Clinton, were probably a better estimate. This is because the last minute polls that came in Monday and early Tuesday contained some results that seem like outliers and seem to contradict early polling data that has been coming in so far. With the Tuesday update Florida, North Carolina, and Nevada flipped from blue to red. I’m not so sure those three changes are reflective of reality on the ground.
My gut is also that if we do see one candidate or another outperform the polling average above, it is more likely to be Clinton due to strong ground game and early voting efforts.
But the final polls “count” and this site’s official predictions have to abide by the methodology used through the whole campaign season.
We have what we have. We will see very soon where reality falls.
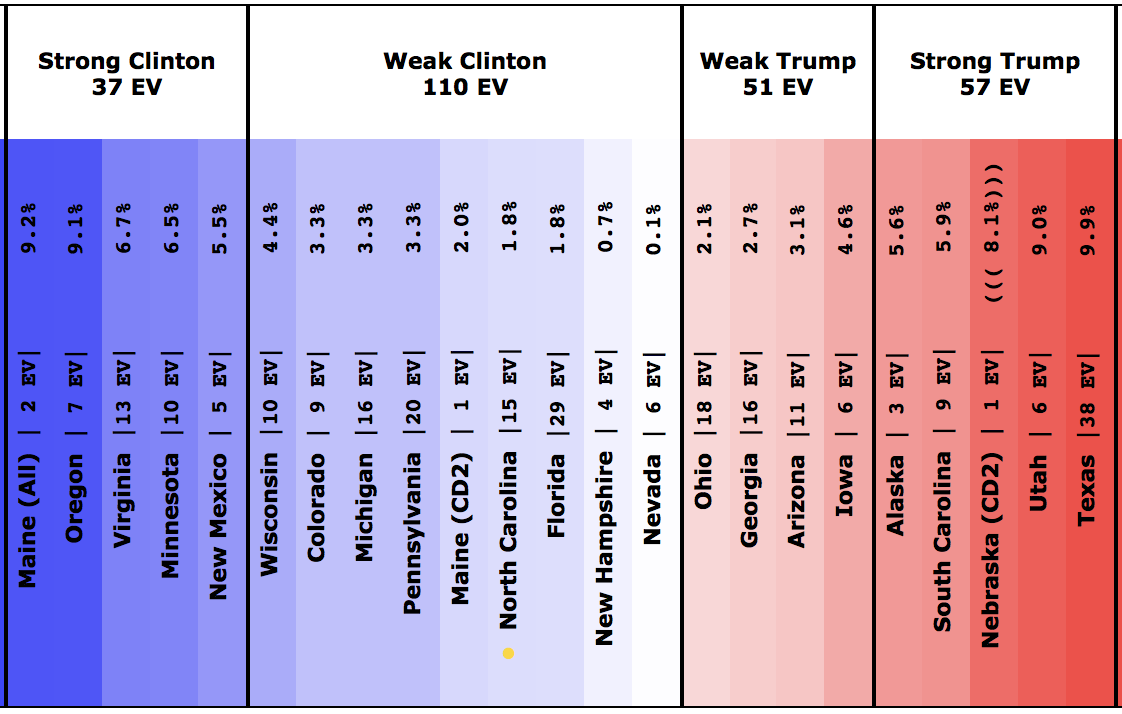
Spectrum of Close States
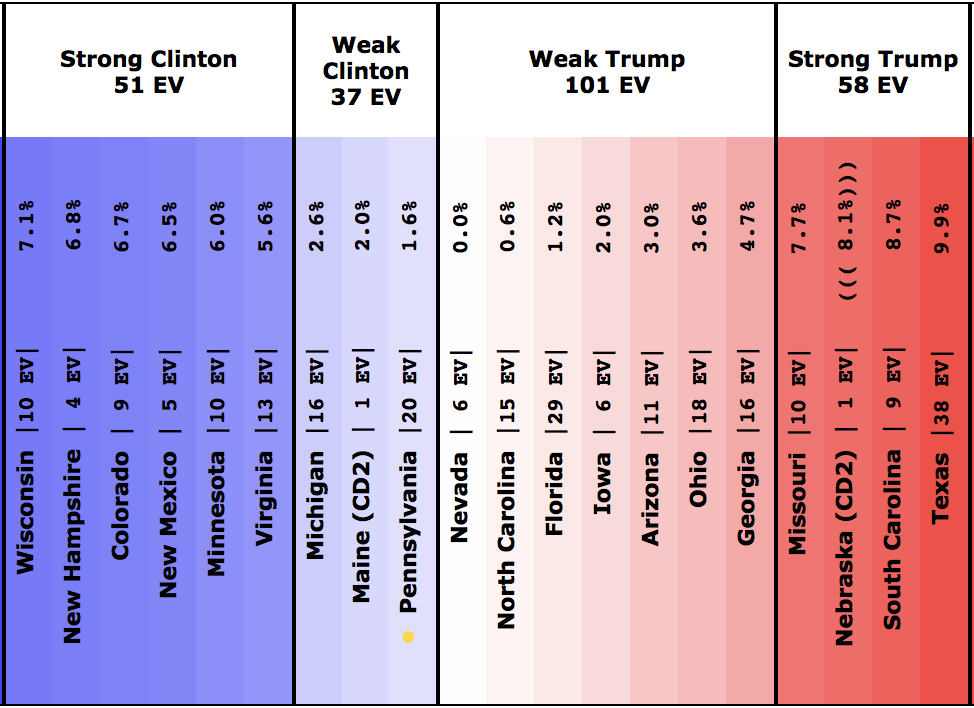
When watching election results come in tonight, these states are the only ones that you really need to pay attention to, and really only the ones labeled “Weak”. Those have a decent chance of flipping to the other side of the center line.
Obviously the smaller the margin, the higher the likelihood the state will end up on the other side of the center line. States very near zero are very likely to flip, those near 5% are actually pretty unlikely to switch.
Chances of the states labeled “strong” above going to the other candidate are very low, but it could potentially happen if one candidate or the other is having a very good night and therefore is significantly exceeding expectations.
Chances of any of the “solid” states not listed above not going as expected are essentially zero. Wyoming and Alabama are red. DC and Vermont are blue. They will not unexpectedly do anything different. :-)
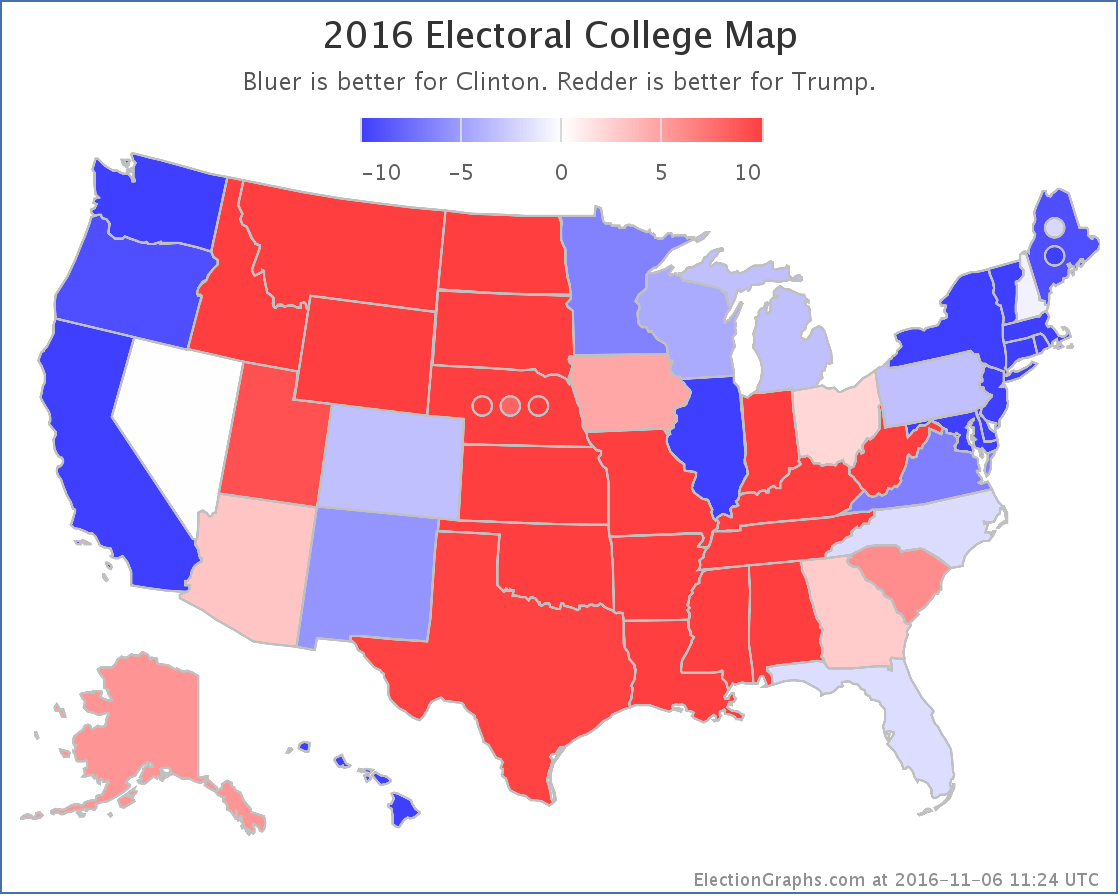
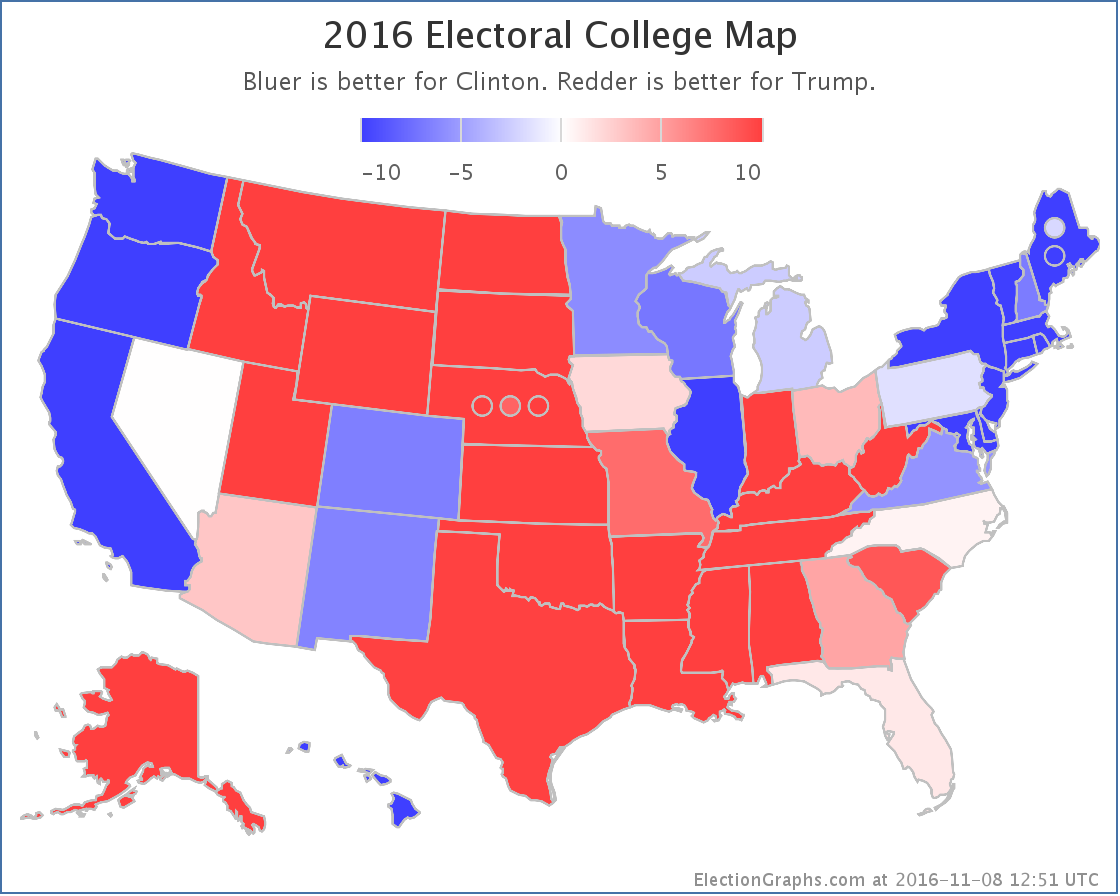
Closing Map
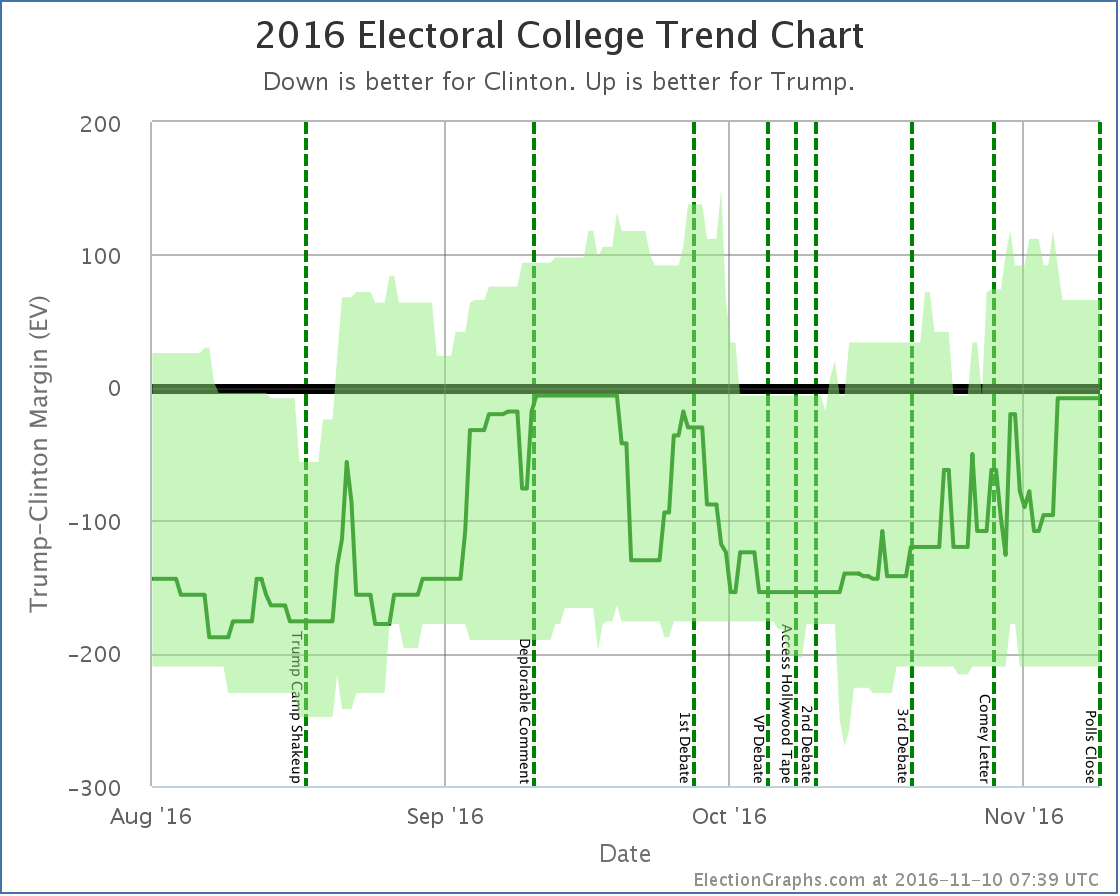
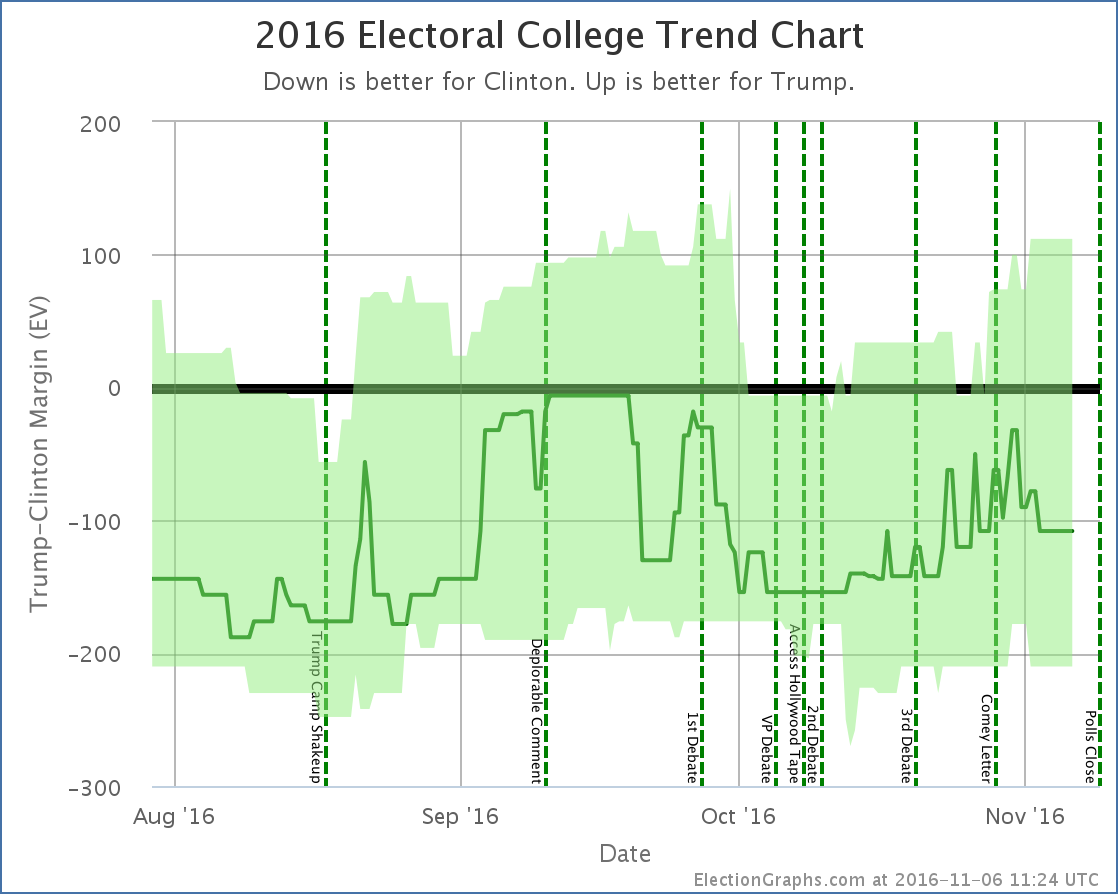
Electoral College Trend
This chart shows the “expected” electoral college margin between the two candidates as the dark green center line. The “bubble” represents the absolute extremes of plausible outcomes. The closer to the edge of the bubble, the less likely an outcome is.

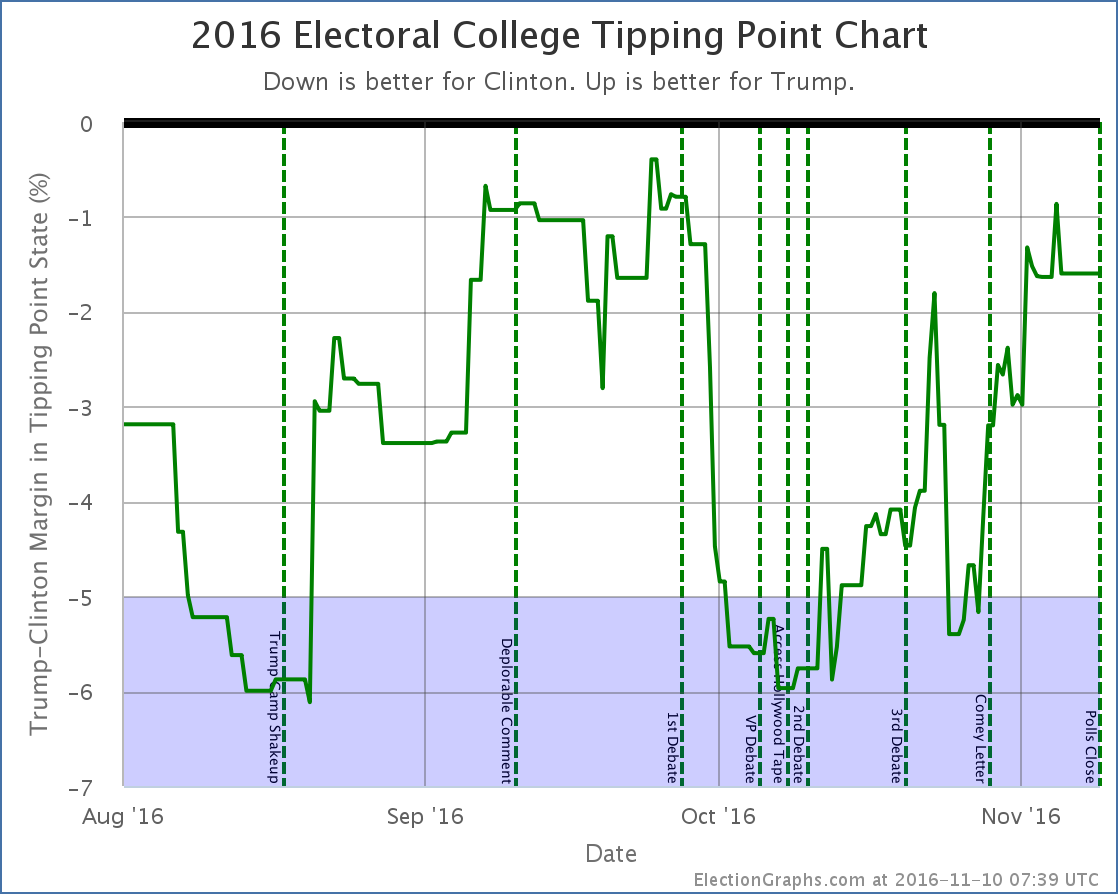
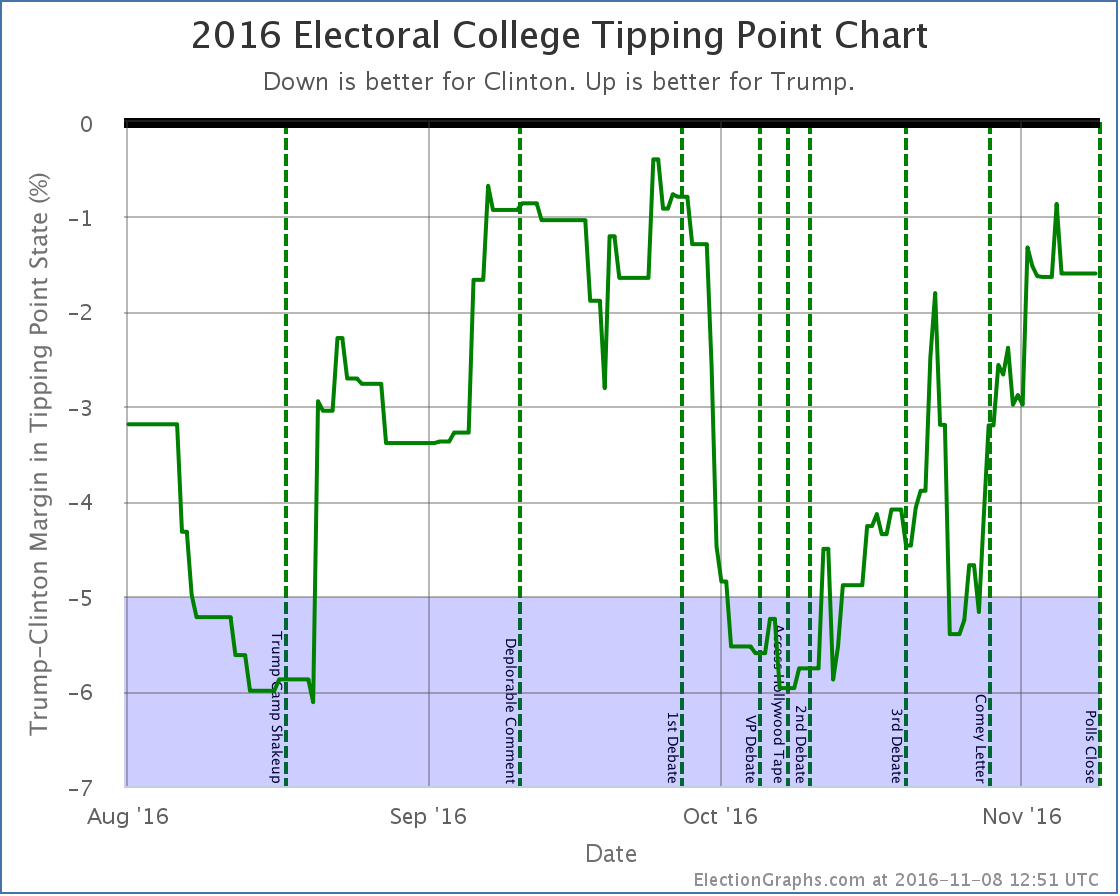
Tipping Point Trend
The “tipping point” is the margin the losing candidate would have to make up in all states to flip the outcome.
At the End
That summarizes the state of the race as of the end of the campaign.
As I type this there are less than 4 hours until the first full states close and we start to get called races. (Parts of some states close an hour earlier, and of course the three small towns in New Hampshire voted last night.)
We are at the end. Congratulations everyone, you made it.
For more information…
This post is an update based on the data on ElectionGraphs.com. Election Graphs tracks a state poll based estimate of the Electoral College. All of the charts and graphs seen in this post are from that site. Additional graphs, charts and raw data can be found there. Follow @ElectionGraphs on Twitter or like Election Graphs on Facebook to see announcements of updates or to join the conversation. For those interested in individual general election poll updates, follow @ElecCollPolls on Twitter for all the polls as they are added. If you find the information in these posts interesting or useful, please consider visiting the tip jar.