States with new poll data since the last update: New Hampshire, Alabama, Illinois, Alaska, Arkansas, Arizona, California, Colorado, Connecticut, DC, District of Columbia, Delaware, Florida, Georgia, Hawaii, Iowa, Idaho, Indiana, Kansas, Kentucky, Louisiana, Massachusetts, Maryland, Maine, Michigan, Minnesota, Missouri, Mississippi, Montana, North Carolina, North Dakota, Nebraska, New Jersey, New Mexico, Nevada, New York, Ohio, Oklahoma, Oregon, Pennsylvania, Rhode Island, South Carolina, South Dakota, Tennessee, Texas, Utah, Virginia, Vermont, Washington, Wisconsin, West Virginia, Wyoming.
In addition to a handful of new polls, this batch of updates includes two sets of 50 states plus DC data from Morning Consult, one released in April covering January through March (with multiple candidate pairs), and another released in July covering April through June (covering only Clinton vs Trump). These span really long time periods and use a slightly different methodology than other polls, so I had initially not included them. But I was convinced by @hominidviews that I actually should include them, so they are now folded into the data.
In most cases, since the middates of the polling periods are fairly far in the past at this point, the addition of these polls only jiggled the lines around in the past rather than changing the situation as of today. Even in the sparsely polled states where these polls did change the average, categories did not generally change.
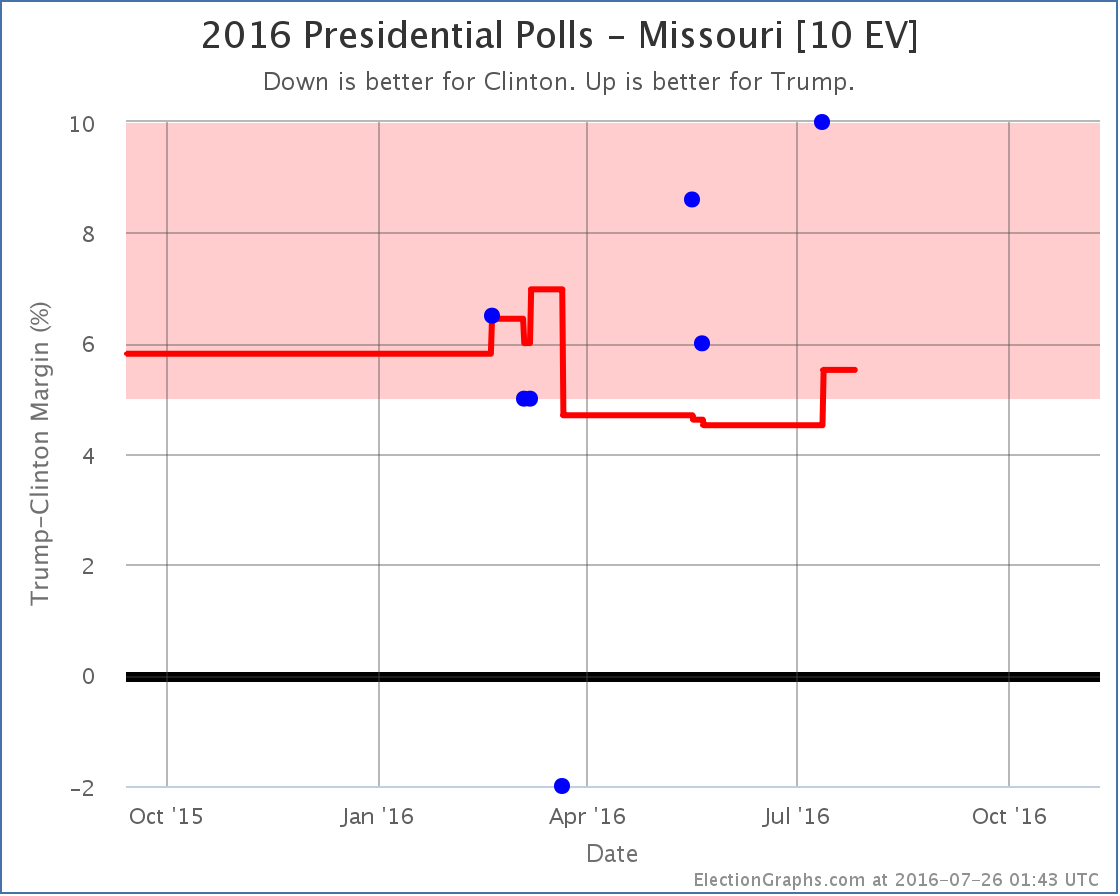
With the new Morning Consult poll centered in May added, the July PPP poll was enough to end Missouri’s time as a close state that was caused by a March DFM poll that now looks like a pretty clear outlier. So Missouri moves from “Weak Trump” to “Strong Trump” and it is therefore no longer listed as a possible pickup for Clinton.
Back in the past, you can see a few new features added by the Morning Consult polls… a dip in the expected line for a little while in May where Clinton briefly was in the lead in Georgia, and a spike in Clinton’s best case where she got within 5% in Texas… for one day.
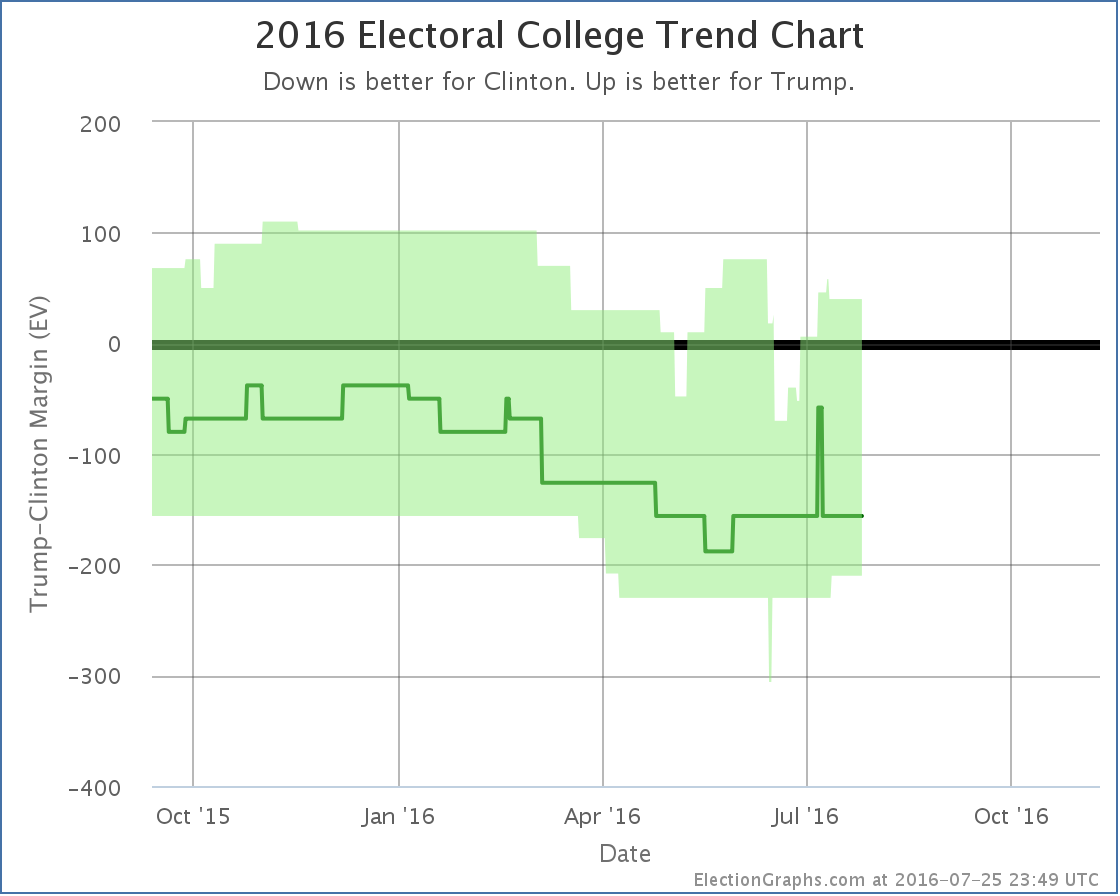
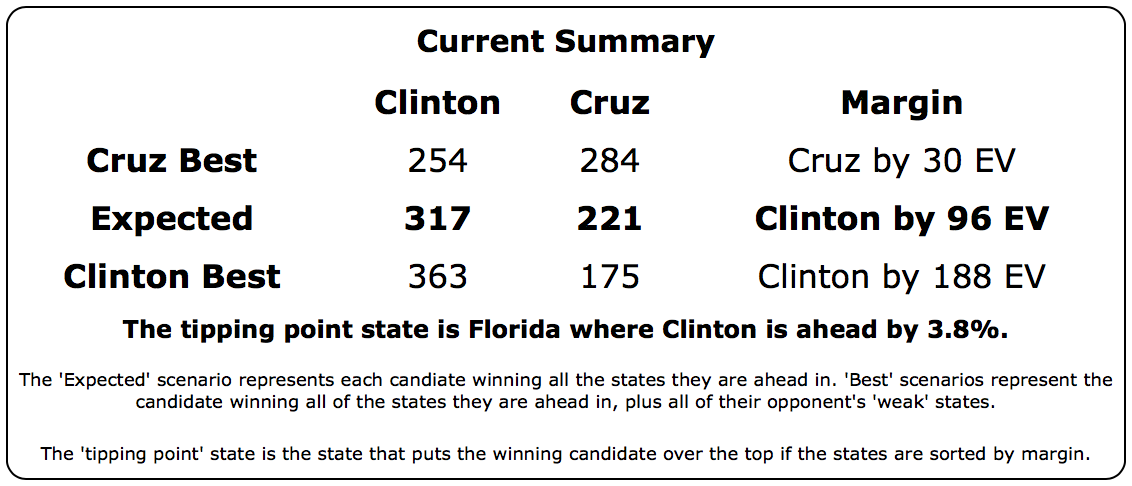
The only change that hasn’t already come and gone is the change in Missouri. Clinton’s best case goes from winning by 230 electoral votes down to winning by 210.
Note this is not part of any “convention bump”. This change is due to poll information from before the convention. There should be new polls added soon that will tell us more about the impact of the conventions. This is not that.
Oh, and the Morning Consult data had some Clinton vs Cruz information as well. Since that combination is still one of the five best polled combinations, even though Cruz lost, I’ll note the changes: Kentucky went from Strong Cruz to Weak Cruz, and Minnesota went from Strong Clinton to Weak Clinton. So Clinton’s best case moved from winning by 188 to winning by 204, and Cruz’s best case went from winning by 30 to winning by 50.
Note: This post is an update based on the data on ElectionGraphs.com. Election Graphs tracks both a poll based estimate of the Electoral College and a numbers based look at the Delegate Races. All of the charts and graphs seen in this post are from that site. Additional graphs, charts and raw data can be found there. Follow @ElectionGraphs on Twitter or like Election Graphs on Facebook to see announcements of updates or to join the conversation. For those interested in individual general election poll updates, follow @ElecCollPolls on Twitter for all the polls as they are added. If you find the information in these posts interesting or useful, please consider visiting the tip jar.
On this week’s Curmudgeon’s Corner, Sam and Ivan do a Republican National Convention mega show, talking about each night of the convention in detail. But a lot of other things happened this week, so before even starting on the convention they cover Nice and Munich and Syria and Baton Rouge and Miami and Turkey and Roger Ailes and the VP announcements and more. It was a very very busy news week. To top it off, Sam also interviews an actual attendee at the convention. It is a big show. Over three and a half hours this time. Our longest ever. Enjoy!
Click below to listen or subscribe… then let us know your own thoughts!
Recorded 2016-07-23
Length this week – 3:40:00
1-Click Subscribe in iTunes View Podcast in iTunes View Raw Podcast Feed Download MP3 File Follow the podcast on Facebook
Show Details:
(0:00:10-0:06:55) Introduction
Big News Week
Election Graphs vs Curmudgeon’s Corner
(0:07:58-0:32:56) Everything Else Part 1
Nice Attack
Munich Attack
Alex Interlude
US Drone Strike in Syria
Baton Rogue Police Killing
North Miami Shooting
(0:33:09-0:52:39) Everything Else Part 2
Ivan’s Staplers
Attempted Coup in Turkey
Roger Ailes
(0:53:24-1:22:06) Everything Else Part 3
Mike Pence VP Rollout
Republican Rules Committee
Trump and Russia
Leaked DNC docs
Tim Kaine VP Announcement
(1:22:44-1:41:22) Republican National Convention Day 1
Expectations
Rules Vote
Minor Speakers
Melania Speech
(1:42:25-1:57:07) Republican National Convention Day 2
Official Roll Call Vote
Giuliani Speech
Christie Mock Trial
Duck Song
Don Jr Speech
(1:57:55-2:21:15) Republican National Convention Day 3
Cruz Speech
Pence Speech
Trump NYT Interview
(2:21:54-2:56:01) Republican National Convention Day 4
Ivanka Speech
Trump Speech
Trump vs Clinton
(2:57:09-3:35:50) Interview with Marcus the RNC Alternate
Self-Introduction
Political Origins
Primary Support
Unification
Electability
Demographics
NeverTrump efforts
Convention Experience
Protests
Final thoughts
(3:37:10-3:39:40) Wrap up
Note: Timestamps are accurate, but many audio players are not very precise on the timestamps they show, especially when scanning forwards and backwards, so depending on your player, if you scan to a specific time, you may not get exactly what is shown above and may have to scan back or forward a bit to get what is expected.
The Curmudgeon’s Corner theme music is generously provided by Ray Lynch.
On this week’s Curmudgeon’s Corner Ivan and Sam spend most of the show on Election 2016 again. On the Democratic side they talk about how after a short moment when it looked like he was embracing the inevitable, Sanders is once again fighting on against the odds. On the Republican side they discuss Trump’s victory, how we got to this point, how the Republican establishment will react, and what it all means for the general election. In addition to all that, there is also talk of the White House Correspondent’s Dinner, a county Democratic convention, Ivan’s travel… oh, and Sam’s 6 year old son Alex has some questions for the listeners.
Click below to listen or subscribe… then let us know your own thoughts!
Recorded 2016-05-04
Length this week – 1:42:04
1-Click Subscribe in iTunes View Podcast in iTunes View Raw Podcast Feed Download MP3 File Follow the podcast on Facebook
Show Details:
(0:00:10-0:12:20) But First
Ivan’s Flights
Alex’s Questions
Agenda
Delegate Confusion
(0:13:00-0:27:15) Election 2016: Democrats
Indiana Results
Sanders still fighting!
Annoying the superdelegates
Ways Clinton is Winning
Contested Convention?
Over Over Over
(0:28:35-1:03:29) Election 2016: Republicans
Indiana Results
Trump Ascendant
Cruz Drops Out
No Rules Changes
Last Trump/Cruz attacks
Trump is the Nominee
How did it happen?
How will elected Republicans respond?
Predicting November
Trump Win Scenarios
How big a Clinton win?
(1:04:32-1:18:55) White House Correspondents Dinner
Obama’s Routine
Boehner and House Divisions
Differences in Trump/Clinton surrogates
Potential Trump VPs
Wilmore’s Routine
(1:20:10-1:41:44) Snohomish County Democratic Convention
This was the last stand of the anti-Trumps. Cruz announced he was dropping out shortly after the state was called for Trump. Kasich is still in it, but hasn’t shown any delegate gathering ability that would indicate he could make a difference.
Even with a loss in Indiana, Trump would almost certainly have won in the end. That has been clear for a couple weeks now. But he didn’t lose Indiana, he shut everyone else out completely.
Trump hasn’t wrapped things up quite yet, he still has to collect a few more delegates. But something unexpected and dramatic would have to happen to stop him from getting there.
The Republican race is now in the same state as the Democratic race has been for awhile. The outcome is known, and we’re just watching the winner mop up the last few delegates they need.
So time to look at the graphs:
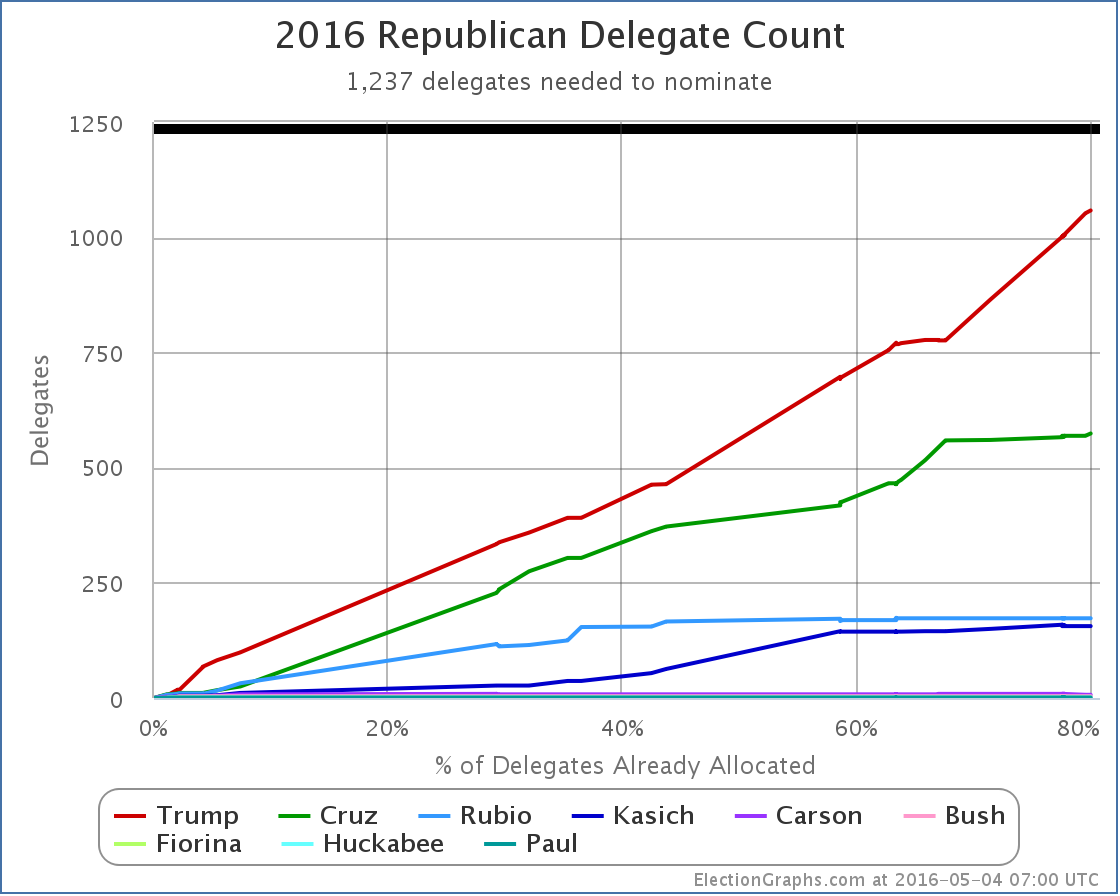
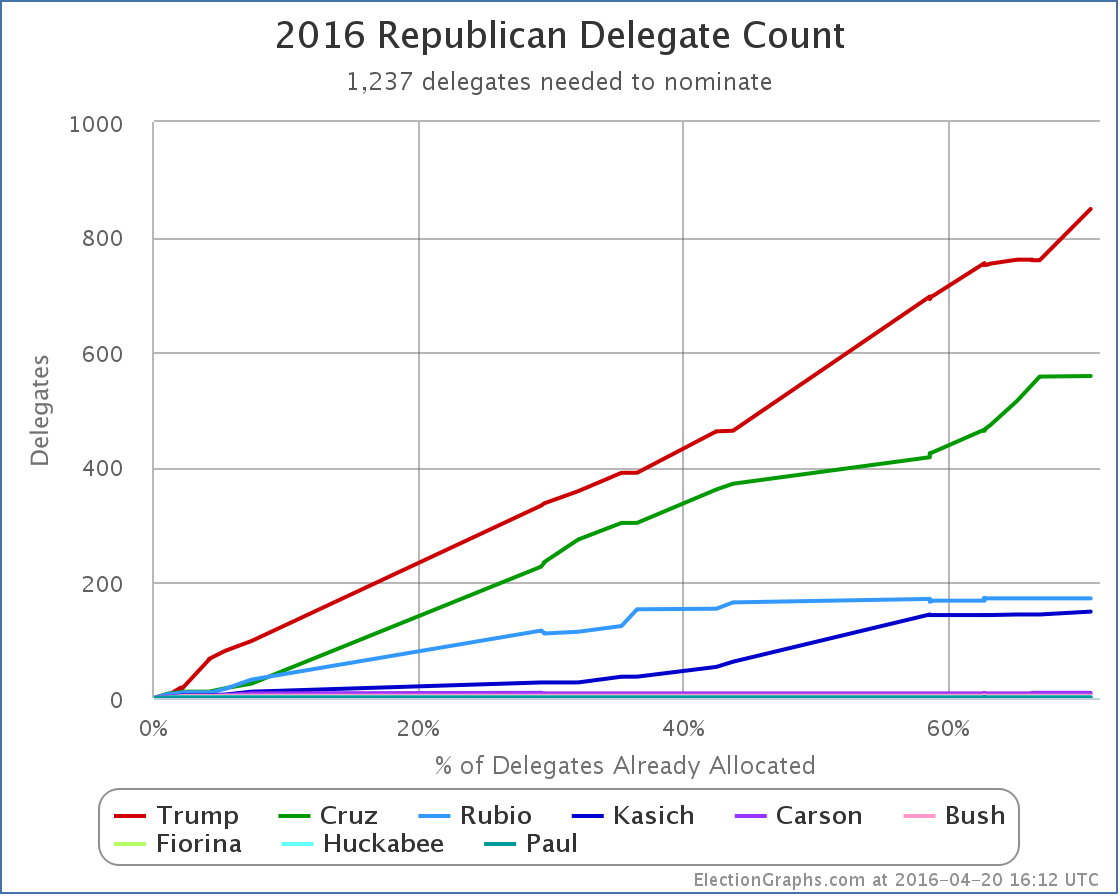
My best estimates of the delegate totals (including preferences of officially uncommitted delegates) is now:
Trump 1058, Cruz 574, Rubio 173, Kasich 156, Carson 7, Bush 4, Fiorina 1, Huckabee 1, Paul 1.
(In addition to the 57 delegates from Indiana for Trump, this includes adjustments since last week that total: Cruz +6, Kasich -2, Carson -2, Trump -3.)
This means Trump now needs 179 of the remaining 497 delegates to wrap this up.
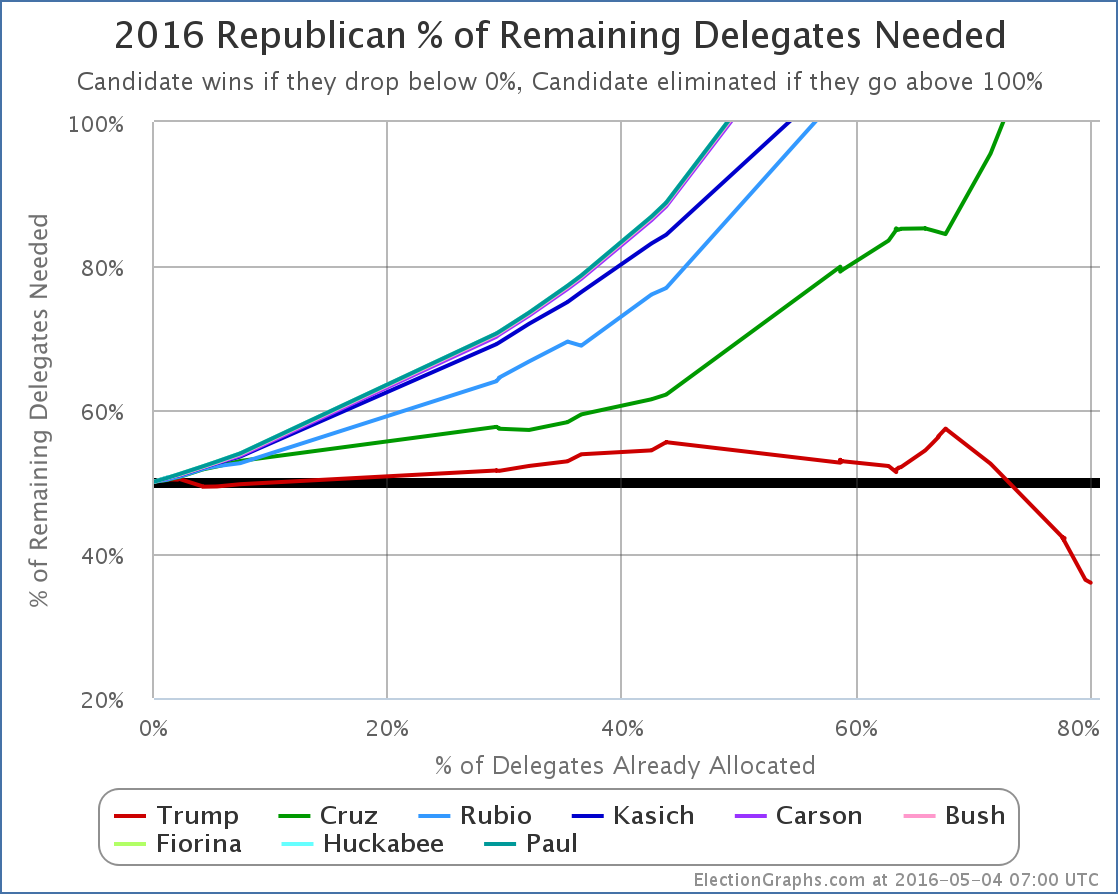
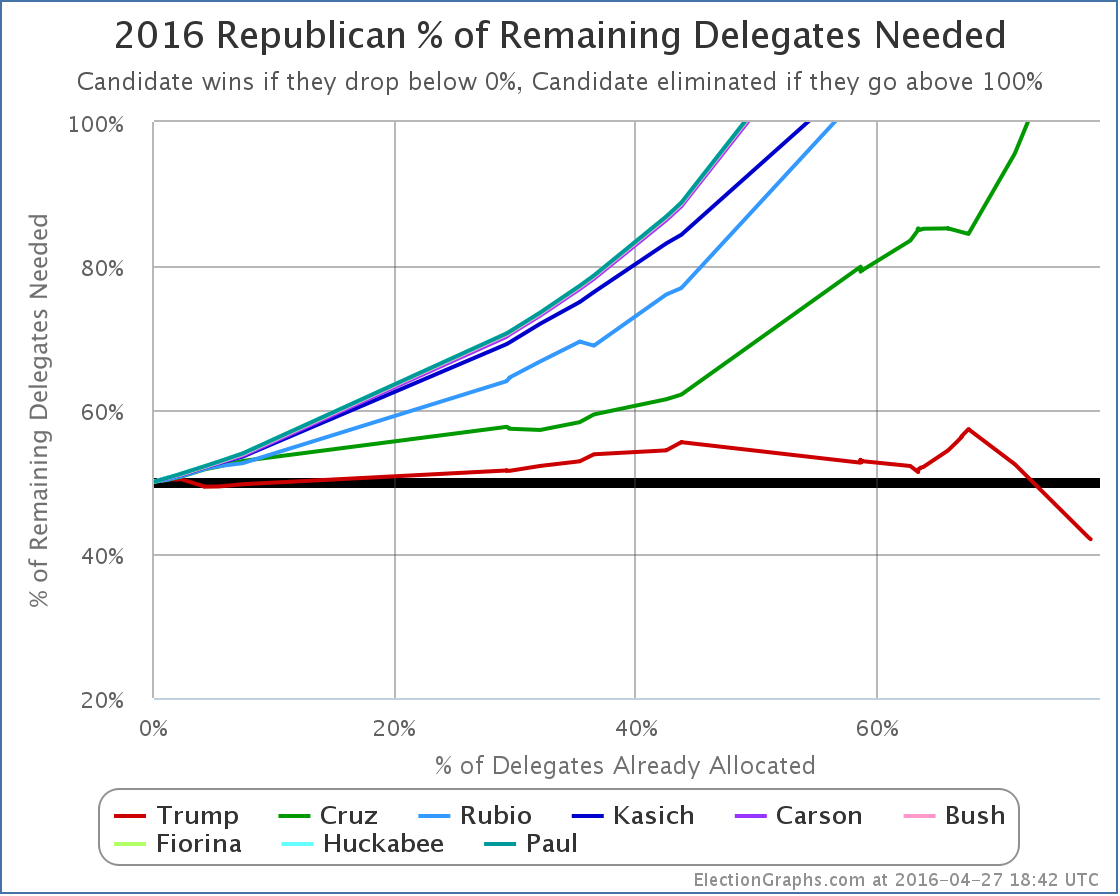
Which brings us to the % needed chart:
Trump now needs 36.02% of the remaining delegates to get to the magic number of 1237.
The remaining contests are essentially now just Trump vs Kasich. Unless you believe Kasich is suddenly going to start winning delegates in every remaining state by 64% to 36% margins despite getting less than 8% of the delegates so far, Trump will do what he needs to do. He will probably do much better than he needs to do.
So he will win, and he will win outright. No contested convention, just an outright win.
If there had been enough “Shadow anti-Trump” delegates… those that were pledged to Trump, but really supported someone else, then there may have been the ability to change the rules to unbind the delegates, opening up a back door for someone else to win even if Trump had the nominal majority. The fact that Cruz dropped out after Indiana indicates that those numbers just were not there…
And so we’re essentially done.
ElectionGraphs.com will continue to document this process, but now it is just a matter of watching Trump gather up the remaining delegates needed. There is no question any more how this will play out.
Unless a metaphorical meteor (or a literal one I guess) hits Clinton or Trump, we have our nominees. The general election is lined up. We are going to be watching Clinton vs Trump.
Update 2016-05-11 06:32 UTC – Adjustments from American Samoa’s uncommitted delegates, and Louisiana’s uncommitted delegates as well as Louisiana’s now free Rubio delegates. Net result: Trump +14, Cruz -3, Rubio -5.
Note: This post is an update based on the data on ElectionGraphs.com. Election Graphs tracks both a poll based estimate of the Electoral College and a numbers based look at the Delegate Races. All of the charts and graphs seen in this post are from that site. Additional graphs, charts and raw data can be found there. All charts above are clickable to go to the current version of the detail page the chart is from, which may contain more up to date information than the snapshots on this page, which were current as of the time of this post. Follow @ElectionGraphs on Twitter or like Election Graphs on Facebook to see announcements of updates or to join the conversation. For those interested in individual general election poll updates, follow @ElecCollPolls on Twitter for all the polls as they are added.
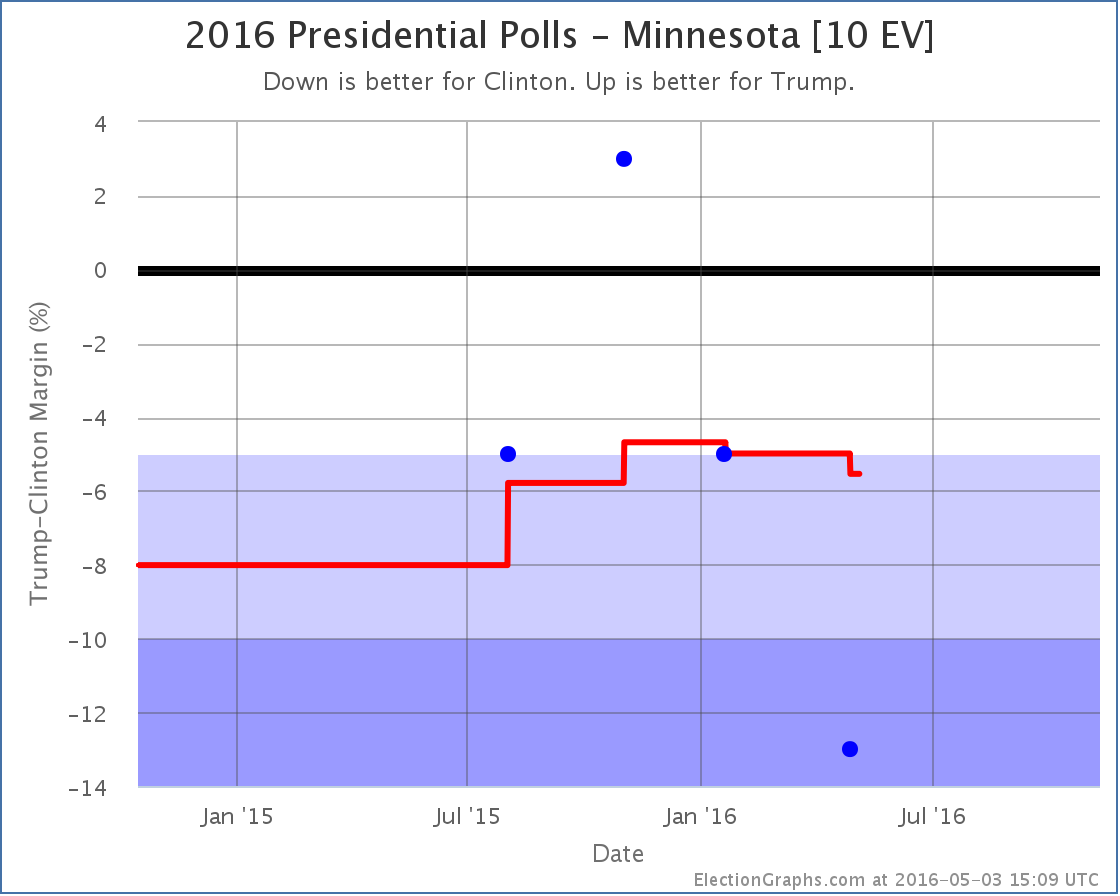
It has only been a few days since the last Electoral College update but there have already been polls added for Ohio, Indiana, California, Florida and Minnesota. A couple of these made differences to the ElectionGraphs.com models, so lets take a look…
Clinton vs Trump
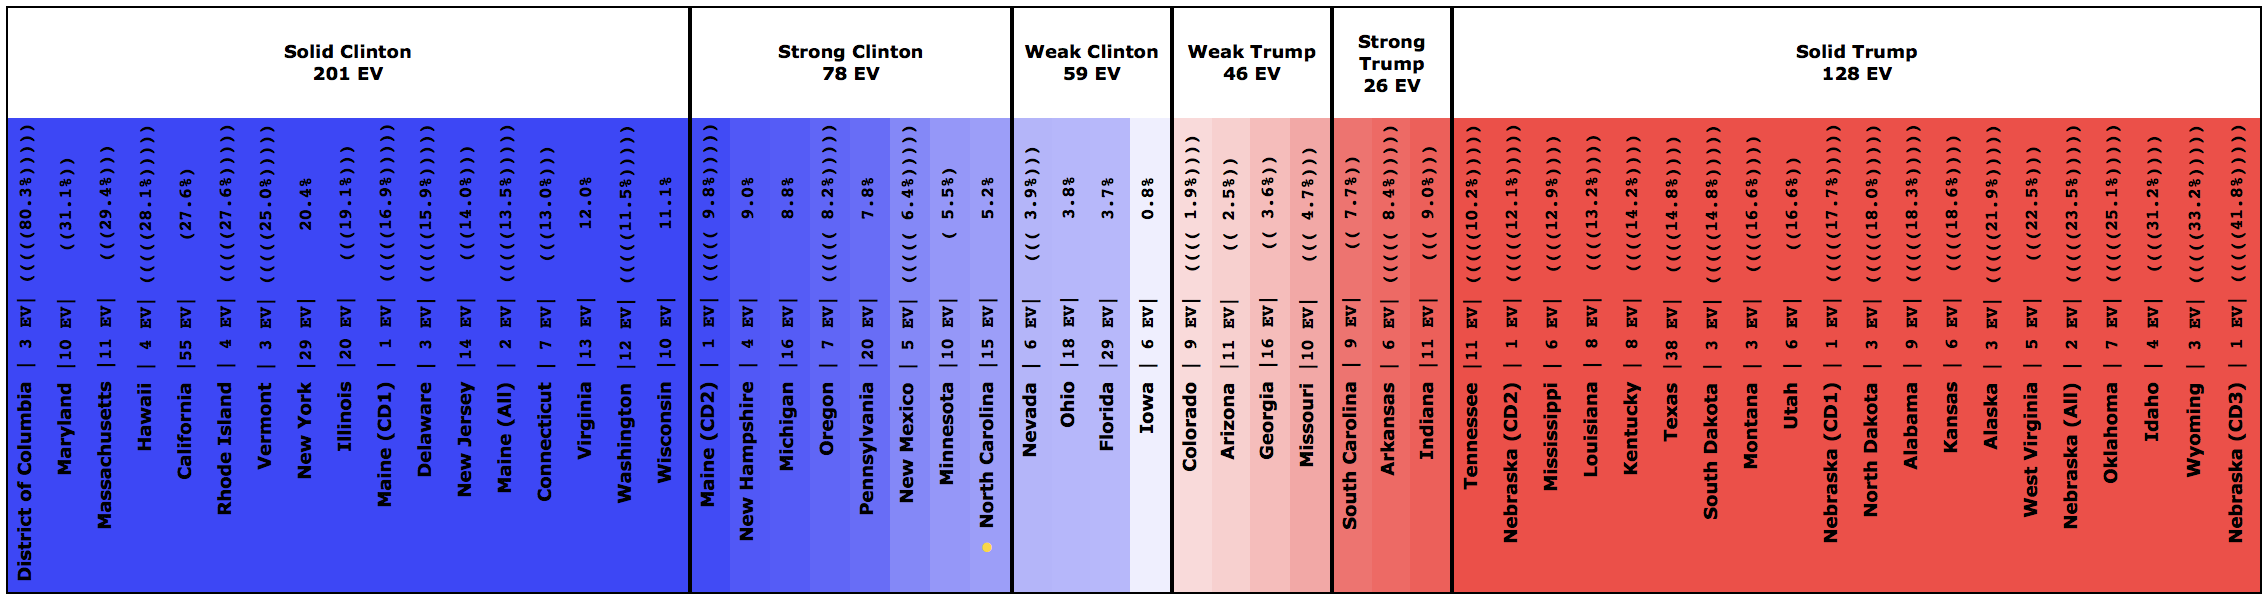
Minnesota has been lightly polled. The average still is padded with the 2012 election results. But with this addition, Clinton’s lead is now 5.5%, which puts the state out of the “Weak Clinton” category and into “Strong Clinton”. For the ElectionGraphs.com model that means for now we now assume that even in a very favorable case, Trump will not win Minnesota.
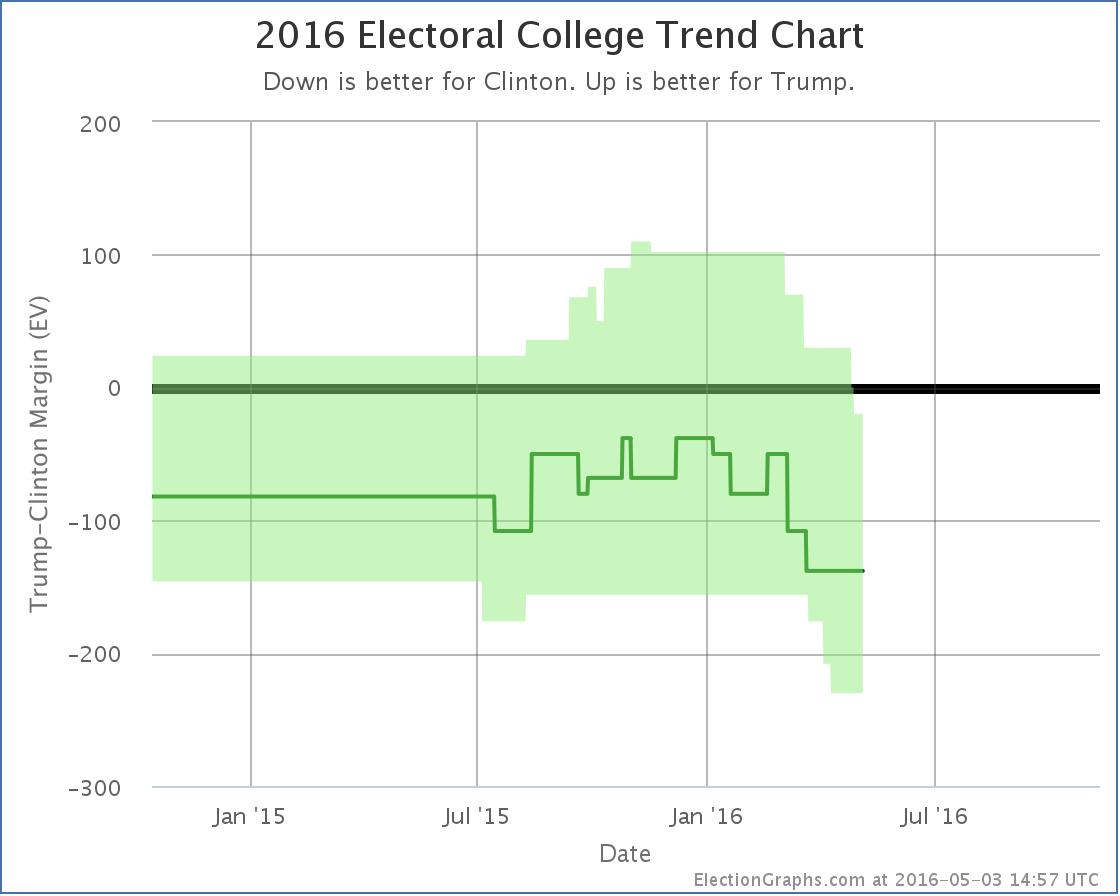
In the last update Trump’s best case was already an electoral college tie. So, with Minnesota out of the picture…
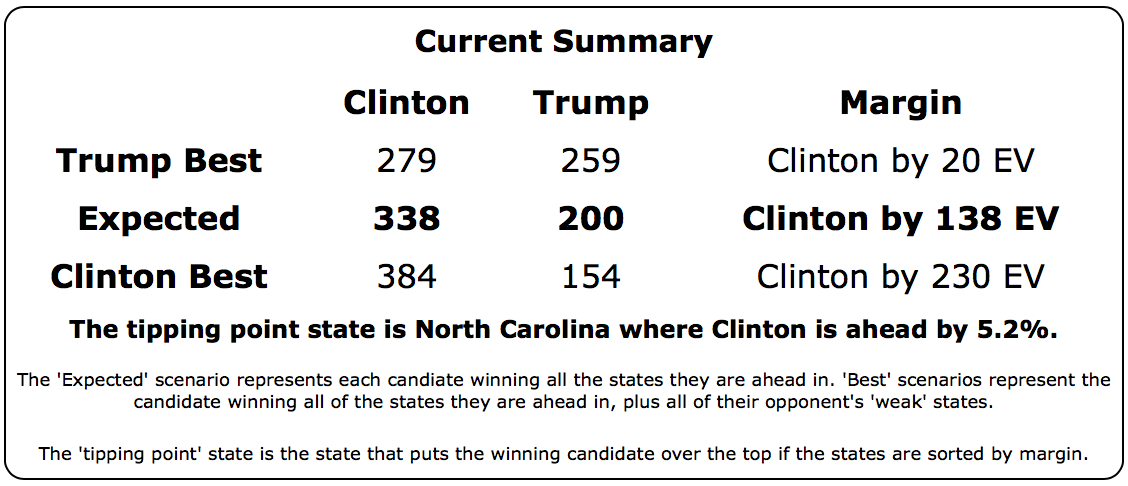
So yes. Trump’s best case… winning all the states where he leads in the polls, plus all the states where Clinton leads by less than 5%, is now to lose to Clinton by 20 electoral votes.
Now, it is important to mention that even though I call this Trump’s “best case”, it is the best case as of right now, with the polls we have today. It is May. We have months to go before the general election. A lot can change. So this doesn’t mean Trump can’t win. It just means that if today’s polling averages held, he couldn’t win.
The tipping point (the percentage you would have to move all the state polls to flip the winner) also moved toward Clinton:
All this together means that Trump is now very far behind Clinton. She has the clear advantage. A big advantage. Trump has a lot of work to do if he wants to catch up and be in a winning position by November. It is not impossible, but it will require changing a lot of minds.
Clinton vs Cruz
Oh yeah, Cruz is still in it too Cruz was still in it when this last batch of polls was taken, and he did badly as well. The latest poll in Florida didn’t change the categorization of Florida, but since Florida was the tipping point state it moved the tipping point:
Given the state of the nomination races though any combination other than Clinton vs Trump appears to be completely academic now, absent some catastrophic unexpected event.
188.8 days until polls close on election day 2016.
Note: This post is an update based on the data on ElectionGraphs.com. Election Graphs tracks both a poll based estimate of the Electoral College and a numbers based look at the Delegate Races. All of the charts and graphs seen in this post are from that site. Additional graphs, charts and raw data can be found there. All charts above are clickable to go to the current version of the detail page the chart is from, which may contain more up to date information than the snapshots on this page, which were current as of the time of this post. Follow @ElectionGraphs on Twitter or like Election Graphs on Facebook to see announcements of updates or to join the conversation. For those interested in individual general election poll updates, follow @ElecCollPolls on Twitter for all the polls as they are added.
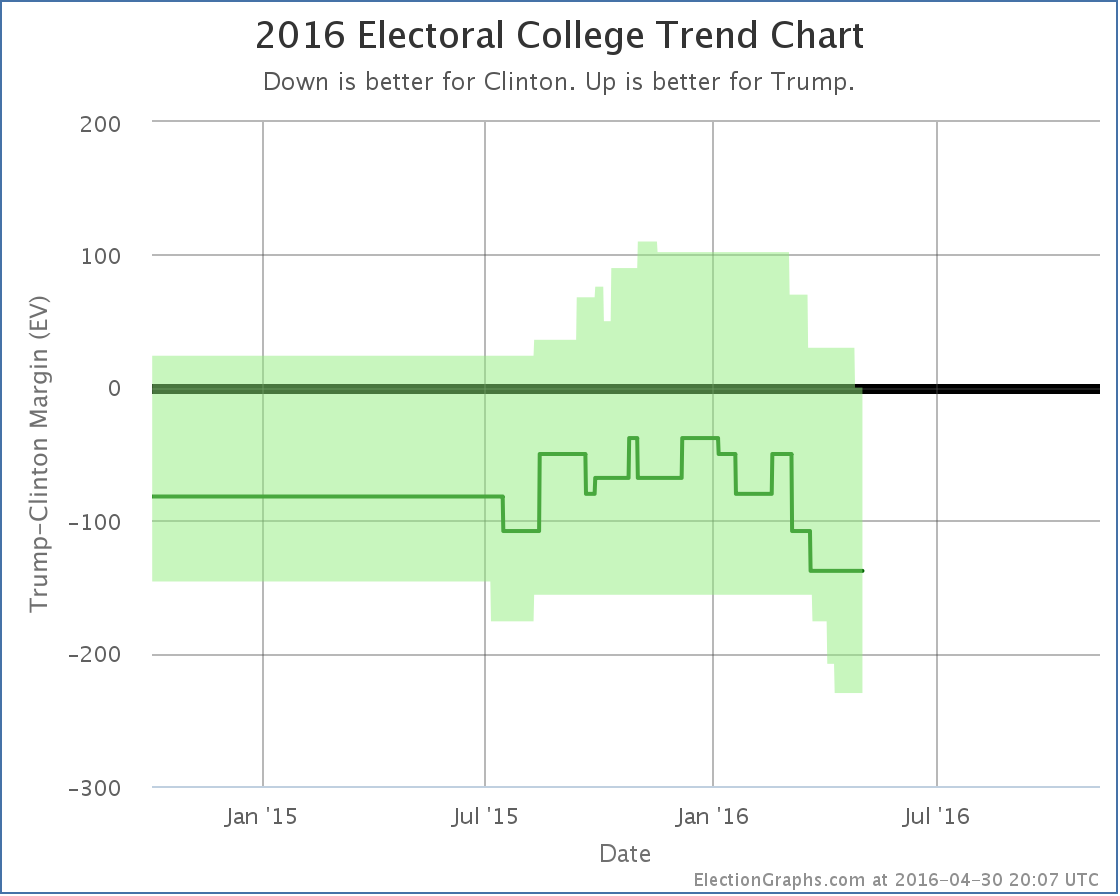
Since the last post here on the Electoral College back on April 19th there have been new polls in Maryland, Wisconsin, North Carolina (x3), Pennsylvania, New Hampshire, Indiana, and Arizona. Today the latest in Arizona and North Carolina make a difference to the ElectionGraphs.com estimates. There are two state category changes for Clinton vs Trump and one for Clinton vs Cruz. All three of these changes favor Clinton.
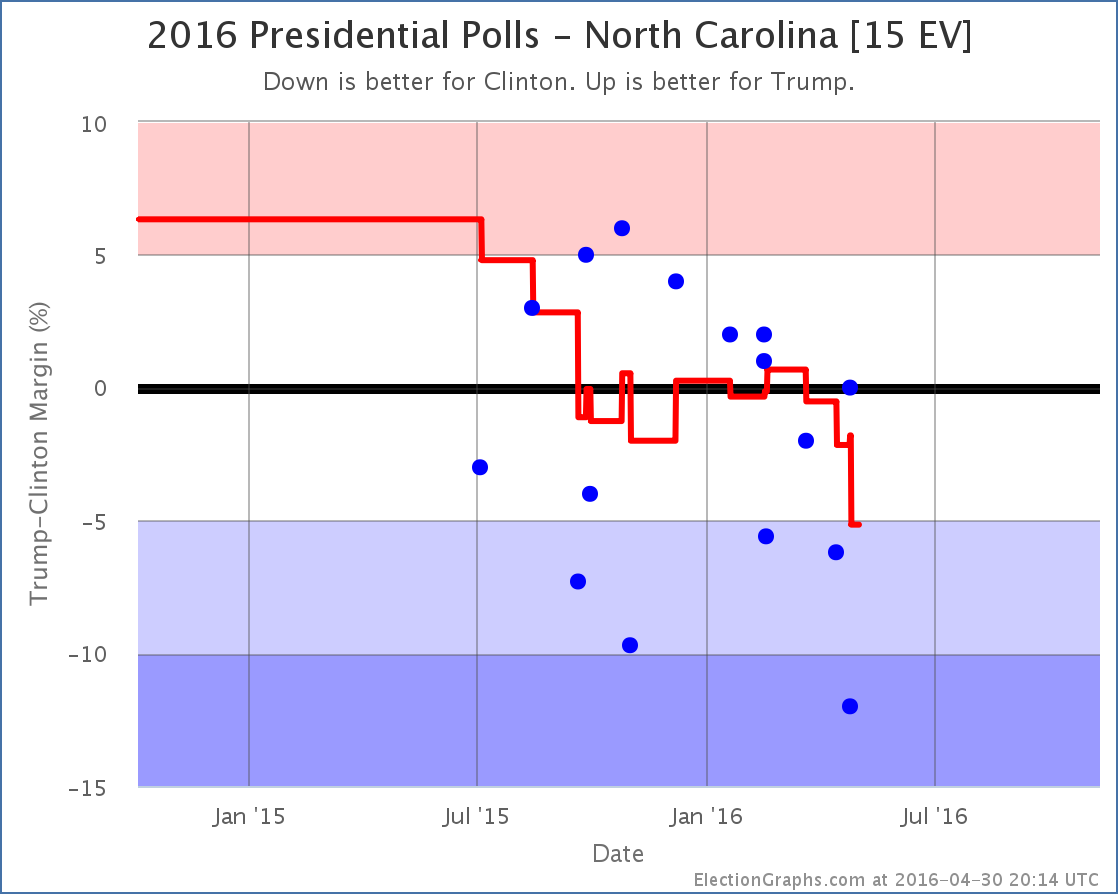
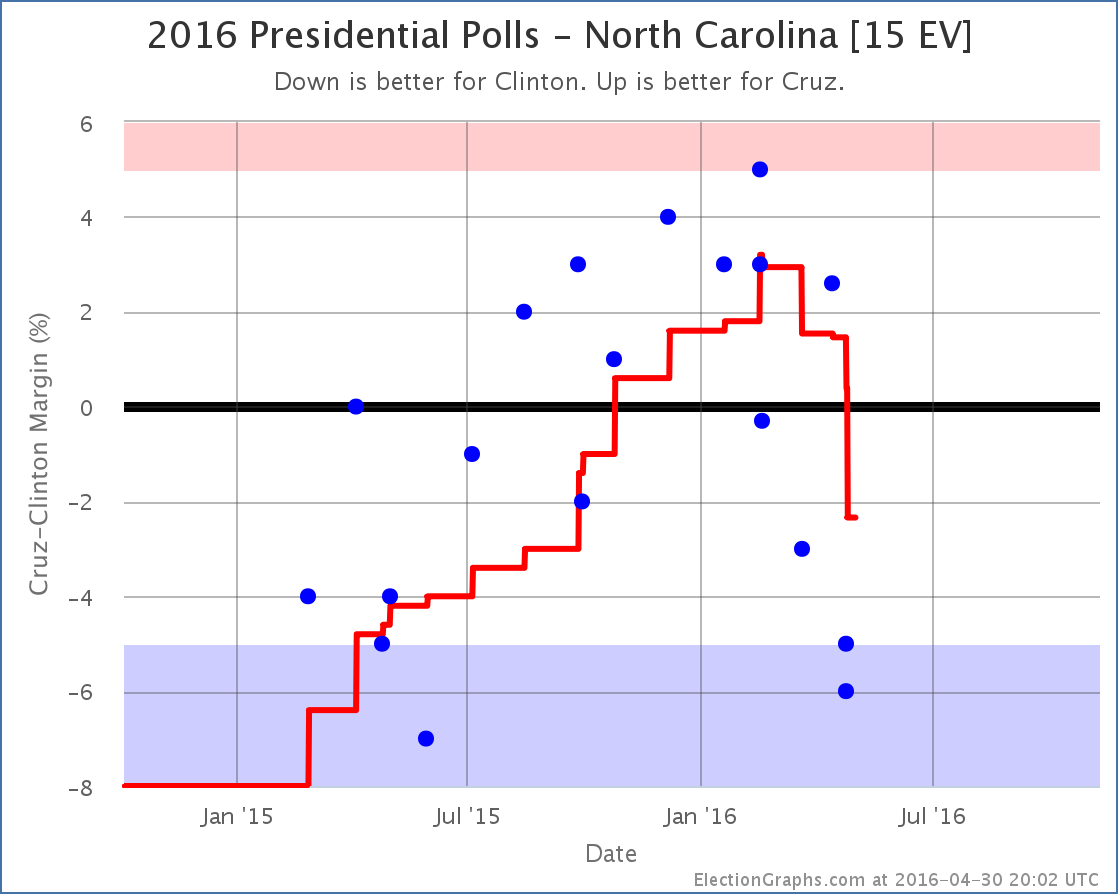
For quite a few months, the Clinton vs Trump poll average in North Carolina just bounced back and forth between Clinton and Trump. But as of now, the best Trump has done in the five most recent polls is a tie. The average has been trending downward since mid-March. The average is now a 5.2% Clinton lead. With that, North Carolina moves from “Weak Clinton” to “Strong Clinton”. This makes North Carolina blue enough that it isn’t considered a possible Trump pick up in the model any more.
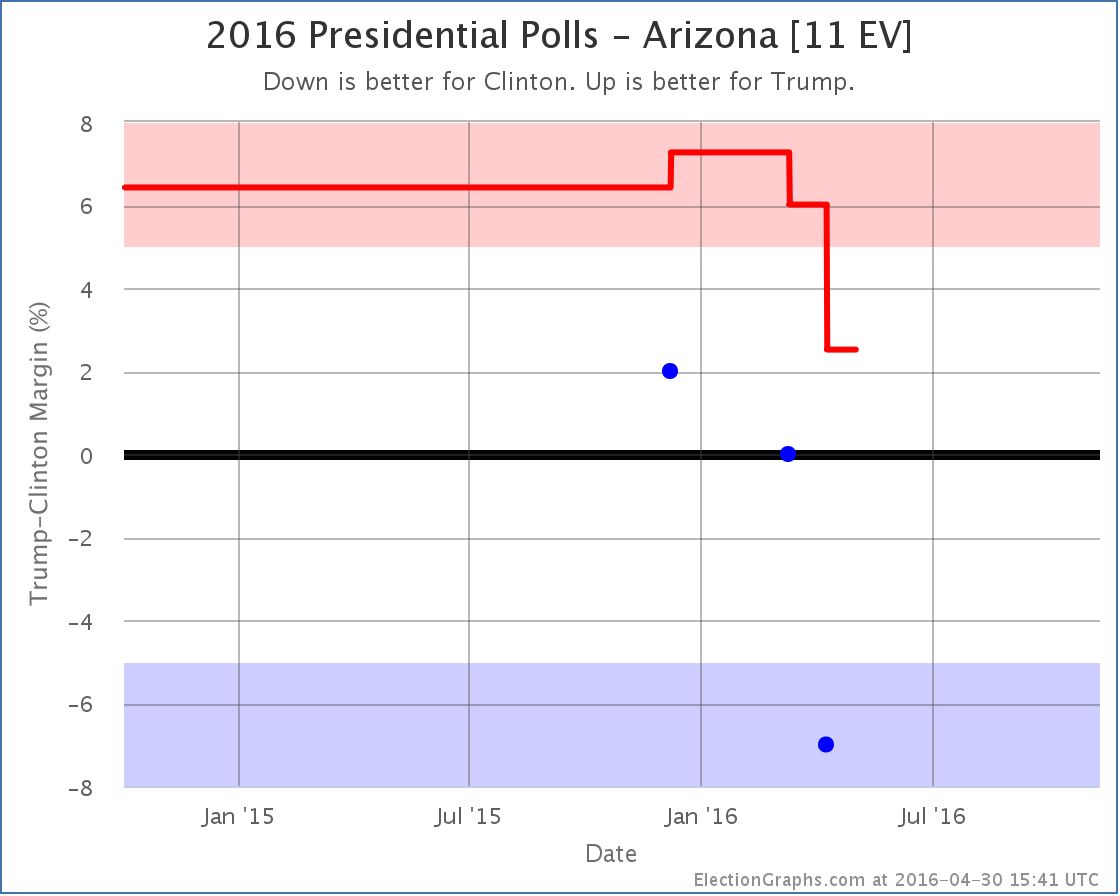
Arizona has been very lightly polled. There have only been three polls of Clinton vs Trump so far. So the average still includes the 2008 and 2012 election results. Each of the polls so far has been worse than the last for Trump though. The average now is only a 2.5% lead for Trump. With that, it is a “Weak Trump” state that is within reach for Clinton.
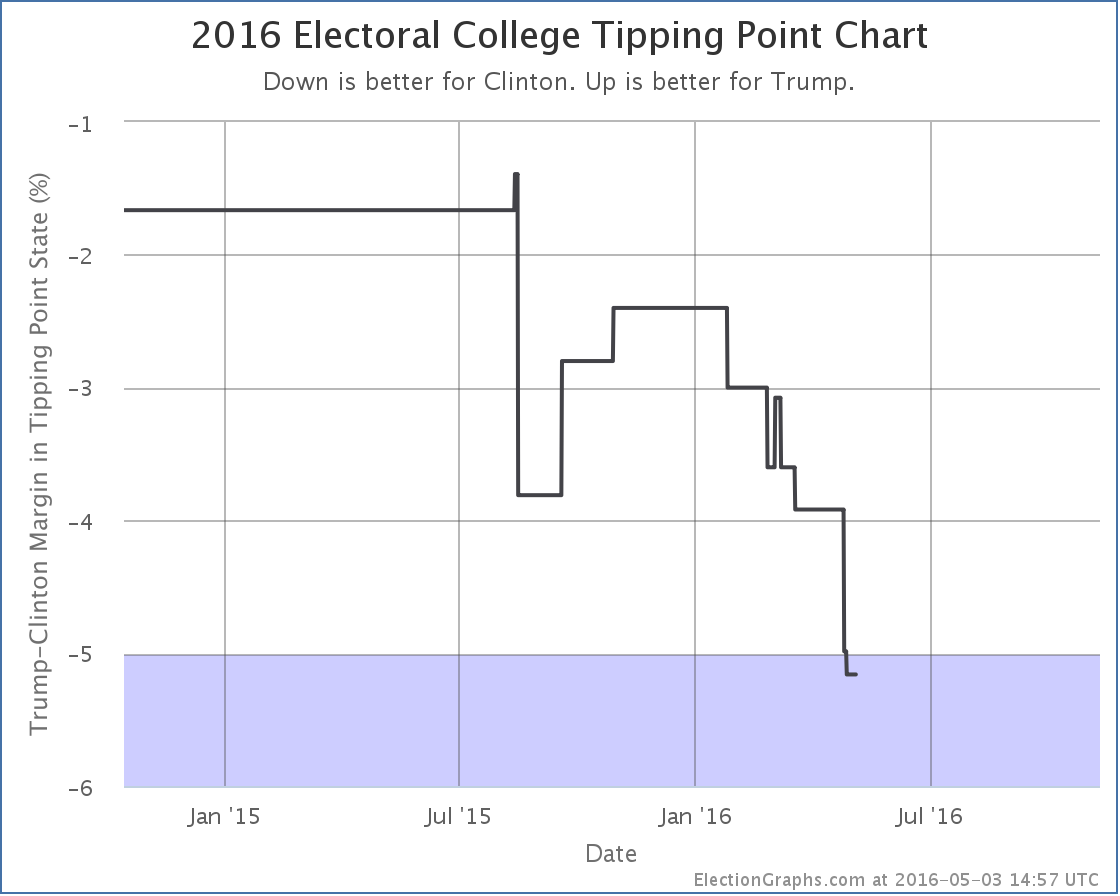
With these two changes, the overall trend in the expected range of possibilities looks like this:
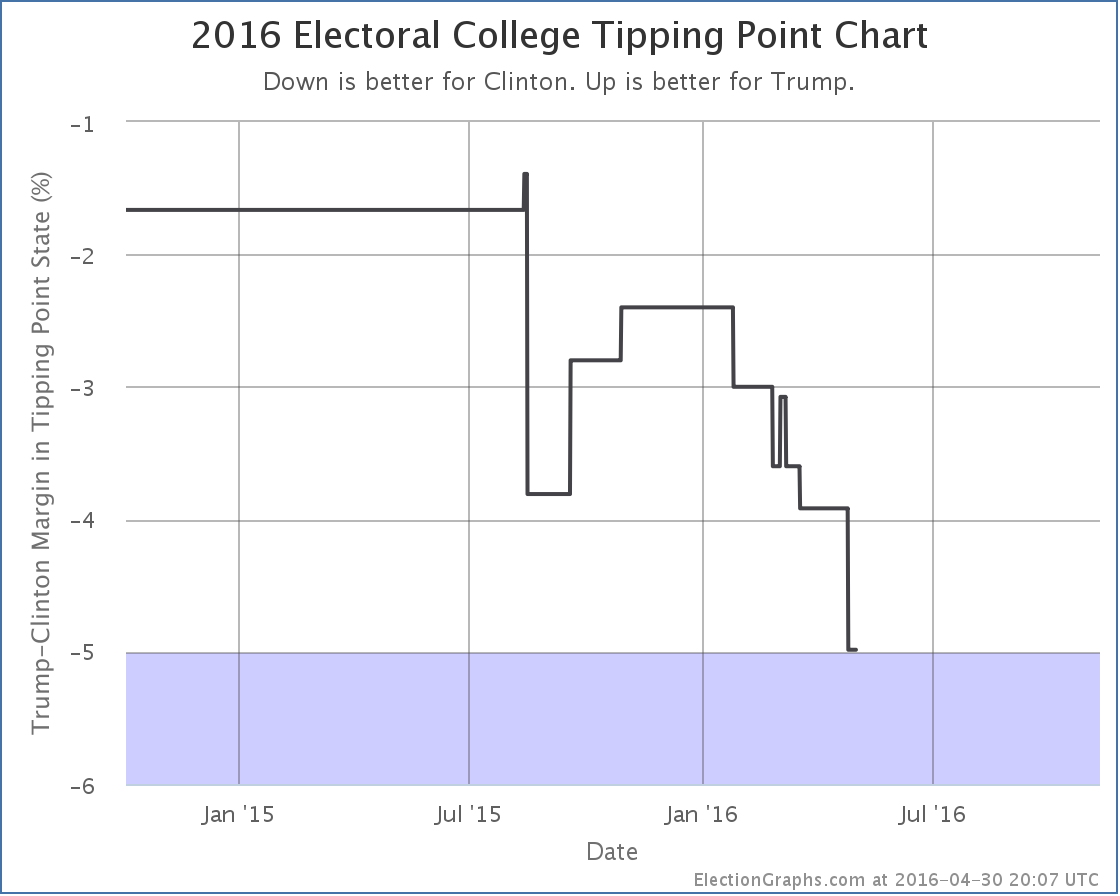
With North Carolina’s movement, the tipping point moved in Clinton’s direction as well:
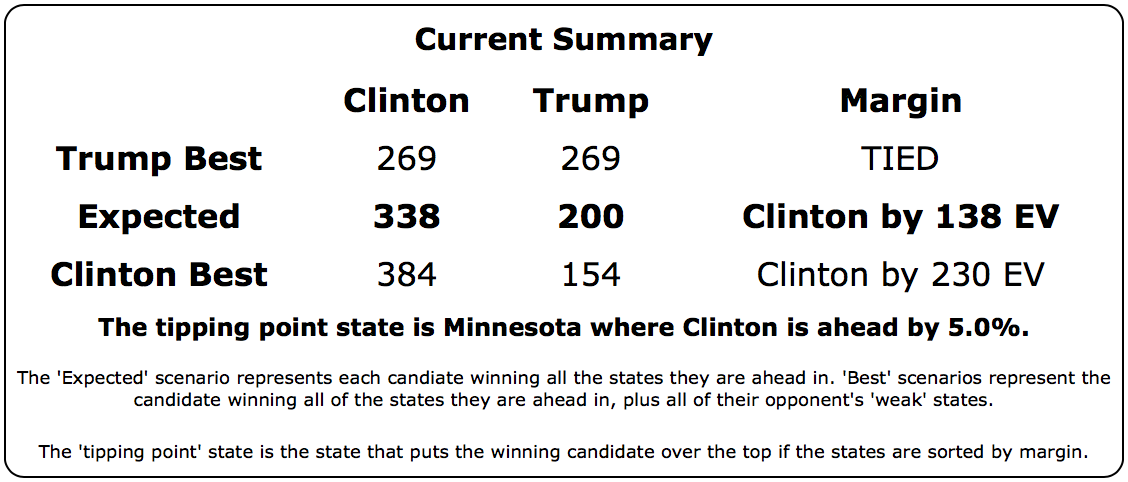
The downward trend that started around the New Year for Trump is continuing. The current summary now looks like this:
Yes, Clinton’s best case is better than it was with Arizona as a possible pickup.
But look at Trump’s current best case.
It is a 269 to 269 electoral college tie.
Can you even imagine a Clinton vs Trump race thrown into the House of Representatives? Wow.
Of course that won’t happen. But just like a contested convention, an electoral college tie is the kind of thing that gets political junkies excited. :-)
The bottom line on Clinton vs Trump is that after peaking around the New Year, Trump has been declining ever since. He is now at the point where if you give him not only all the states he is ahead in, but also the ones where Clinton is ahead by less than 5%, he only gets to a tie.
Things will undoubtedly change as both parties transition from primary mode to general election mode. The primary season has been very bad for Trump in terms of general election polling. The types of things he has been saying and doing that are winning him the Republican nomination are at the same time souring the general election voter against him.
The question is if he can turn that around once he is the official nominee. (Assuming nothing surprising happens to stop that of course.)
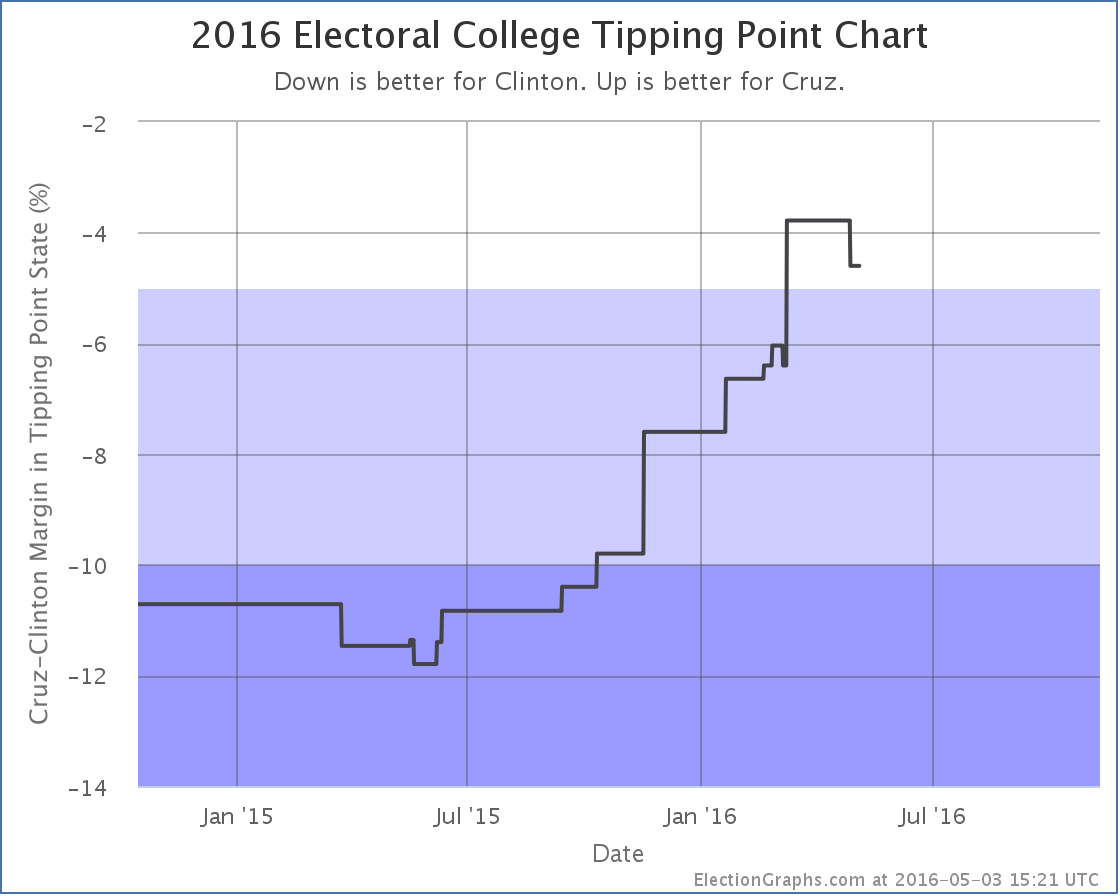
Clinton vs Cruz
Oh yeah, Cruz is still in this too.
Cruz had been doing better and better in North Carolina. Until mid-March. Since then things have been moving against him. With this update, the lead in the state flips back to Clinton. This moves Cruz’s “expected case”:
The new summary looks like this:
Notice that in all four of the key metrics, the expected case, the two best cases, and the tipping point, Cruz is doing better than Trump against Clinton.
Of course, Trump is on track to be the nominee and Cruz is not, absent some sort of coup at the convention via a rules change, a last minute Trump implosion, or something like that. Republican voters do not seem to be prioritizing “electability” this time around.
191.8 days until polls start closing on election day though. A lot will change between now and then. So we shall see…
Note: This post is an update based on the data on ElectionGraphs.com. Election Graphs tracks both a poll based estimate of the Electoral College and a numbers based look at the Delegate Races. All of the charts and graphs seen in this post are from that site. Additional graphs, charts and raw data can be found there. All charts above are clickable to go to the current version of the detail page the chart is from, which may contain more up to date information than the snapshots on this page, which were current as of the time of this post. Follow @ElectionGraphs on Twitter or like Election Graphs on Facebook to see announcements of updates or to join the conversation. For those interested in individual general election poll updates, follow @ElecCollPolls on Twitter for all the polls as they are added.
[Update 04:10 UTC to add the “Maybe everything is going Trump’s way…” sentence.]
[Update 04:52 UTC to add in some inexplicably missing words where a sentence stopped before it was complete.]
This week on the Curmudgeon’s Corner podcast Sam and Ivan spend most of the show on Election 2016. On the Republican side they discuss how recent results and the polls of upcoming states seem to be closing the door on the possibility of a contested convention and pointing to a straight up Trump nomination, as well as discussing Cruz/Fiorina, and what might make Trump worse than Cruz. On the Democratic side the discussion is on how Sanders seems to be finally admitting defeat, and on the veepstakes! Finally, they wrap it up with a lightning round covering all sorts of other issues they haven’t gotten around to lately.
Click below to listen or subscribe… then let us know your own thoughts!
Recorded 2016-04-28
Length this week – 1:40:24
1-Click Subscribe in iTunes View Podcast in iTunes View Raw Podcast Feed Download MP3 File Follow the podcast on Facebook
In pledged delegates the results were Trump 110, Kasich 5, Cruz 3.
That is a crushing win, but that is not why I say everything is falling into place. Trump did a little better than expected in pledged delegates, but a massive Trump win had been expected for awhile. This was not a surprise, and was already baked into people’s projections for the rest of the race.
Even with this built into the expectations, as of my post last week we were looking at odds between about 40% on the low side and 64% on the high side for Trump actually getting to 1237 delegates and having an outright majority before the convention. A week later, several things change that and make an outright Trump win look far more likely, and a multi-ballot convention much less likely. If it isn’t the pledged delegate results from last night, then what is it?
The first thing is the officially uncommitted delegates from Pennsylvania. In past contests Trump has done a horrible job getting his loyalists into the slots that are nominally uncommitted, or for that matter even into the slots that are bound to him on the first ballot. It was plausible to expect that Trump would do similarly poorly with Pennsylvania’s uncommitted delegates which are elected by name on the ballot… without any indication on the ballot of who they support.
But Trump appears to have gotten his act together, making sure delegate slates were available to Trump supporters and such. Between delegates that explicitly said they support Trump, and those who said they would vote the way their district went (and all of them went for Trump), Trump ends up with 45 of the 54 uncommitted delegates by my estimates. There is some ambiguity in the statements made by some of these uncommitted delegates and some otherfolks have estimated the number of Trump votes slightly lower. But all the estimates have Trump winning most of these delegates.
This was unexpected, and also gives more confidence of Trump’s delegate wrangling abilities going forward. (Although Pennsylvania was the biggest pot of uncommitted delegates.)
Add in the uncommitted delegates that have expressed a preference (45 Trump, 3 Cruz, 3 Kasich, 3 TBD) and 2 additional uncommitted Cruz delegates from North Dakota that I logged in the last week, and the net change since New York ends up as:
Trump +155, Cruz +8, Kasich +8.
The new raw totals look like this:
The finish line is in sight. Trump only needs 233 delegates to win this thing directly. No multi-ballot convention, just a straight up win on the first ballot.
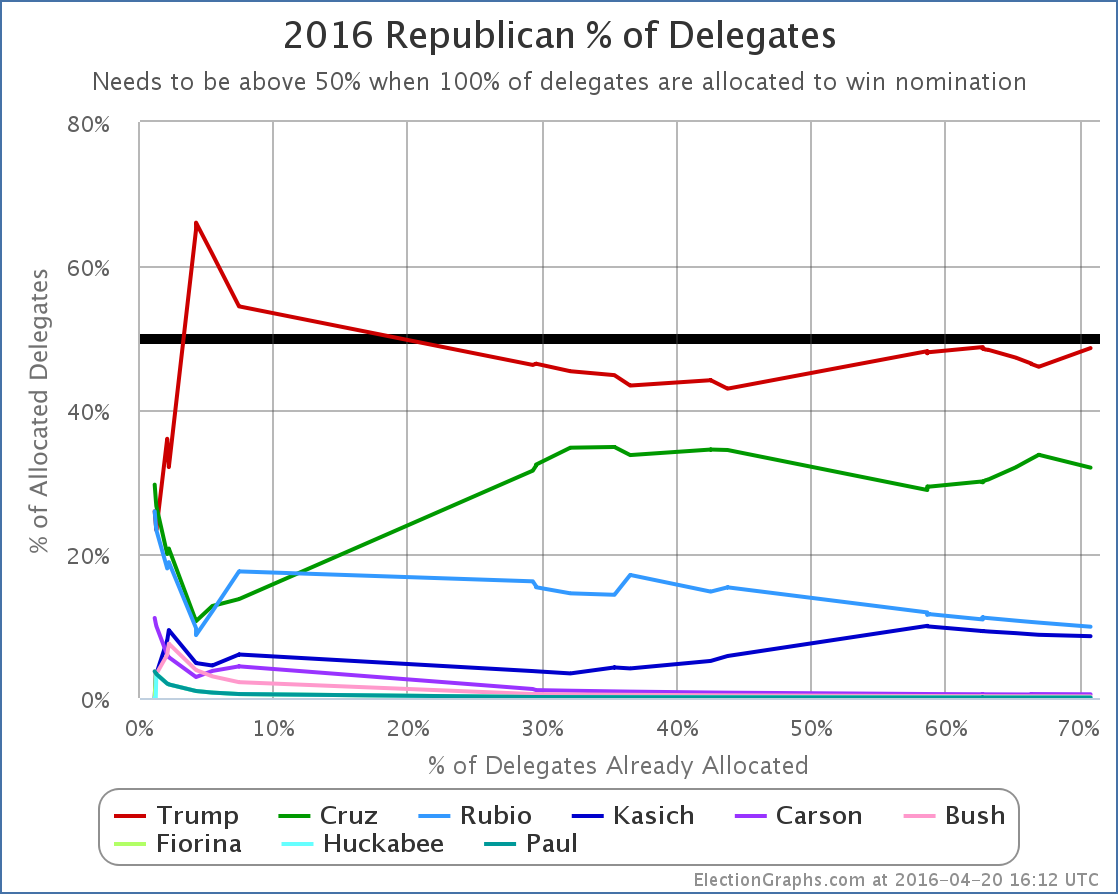
For the first time since Super Tuesday at the beginning of March, Trump also actually has a majority of the delegates so far… 52.32% of the delegates.
But what does it take to keep that? Time for the “% of remaining delegates needed” graph:
First note that with yesterday’s results Cruz has been mathematically eliminated from the possibility of a first ballot victory. Trump is now the ONLY candidate that can win on a first ballot. Everybody else is done unless there is a brokered convention… or I suppose unless Trump drops out or something crazy like that.
Looking directly at Trump’s line… Trump needed 53.52% of the delegates to improve his position. Since New York he actually got 90.64% of the delegates. This obviously means his position improved a lot. He now only needs 42.06% of the remaining delegates to win.
That means he could do 20% worse at delegate gathering in all the remaining contests than he has so far and still win.
If the Republicans allocated delegates proportionately everywhere like the Democrats do, this would clearly be over. It would be Trump’s nomination, and we’d be done.
Because of how so many Republican states tilt the delegate results to the winner though, if the anti-Trump’s were strong, there would still be a path to block Trump.
The anti-Trump scenarios that gave us odds of a multi-ballot convention relied on three things.
The first we mentioned above… Trump’s failure to win delegates when they were selected individually instead of being bound to primary results. Trump dispensed with that in Pennsylvania.
The second was Indiana. Until the last week, Indiana had not been polled. The anti-Trump contested convention scenarios all relied on Trump losing Indiana. Well, last week Indiana was finally polled. Three times. The results? The RCP average has Trump +6.3%. Given Indiana’s delegate rules, a win like that would get Trump most of Indiana’s 57 delegates… possibly all of them. Oops. And Trump now only needs to be getting 42% of the delegates to be on pace to win.
The third was California. Trump has been ahead in the polls in California forever. But the anti-Trump folks were hoping to keep him from winning by too much and to hold down his delegate total. But in the last week of polling, Cruz has been falling and Trump has been rising, so Trump’s margins have just been growing. RCP now has a 17.4% Trump lead in their California average. Assuming Trump wins Indiana and some of the other remaining states, Trump will very likely only need 30% or less of the delegates in California in order to wrap things up. If he is winning by almost 20%, that is going to be very easy to achieve.
The simulator at The Upshot using default assumptions now shows an almost certain Trump win.
The FiveThirtyEight simulator “follow the experts” model shows Trump 27 votes short of the magic number… but they don’t include ANY of the officially uncommitted delegates that have said they support Trump. Add those in… there are just under 50 of them now depending how you count… and you are easily over 1237.
We are no longer on a knife’s edge between a contested convention and an outright Trump win.
#NeverTrump is now hanging on by a thread. They maybe aren’t quite as far gone as Sanders is on the Democratic side, but it is getting close. Their last hope is to try to start turning things around with a surprise win in Indiana. Even with that though, Trump’s odds look very good.
Between yesterday’s results, polls in Indiana, and polls in California, this now looks like an almost certain outright Trump win.
This is now Trump’s to lose. Given everything he has done so far that pundits thought would sink him but in fact only strengthened him, it is hard to see how exactly that would happen.
So… time to start paying more attention to Clinton vs Trump. Right now that looks like Clinton 338 to Trump 200, a 138 electoral vote win for Clinton. But things are still early, and that will change…
Update 2016-05-02 17:52 UTC: Uncommitted delegate update plus adjustment in Rhode Island. Net change: Trump +1, Cruz -2.
Update 2016-05-03 03:53 UTC: Uncommitted delegate update checking multiple sources. Net change: Cruz +2, Kasich -2, Trump -4. (See my wiki for my current best estimates of uncommitted delegate preferences.)
Update 2016-05-04 08:11 UTC: Updates (including uncommitted) in Nevada, Wyoming and North Dakota. Net change: Cruz +6, Carson -2.
Note: This post is an update based on the data on ElectionGraphs.com. Election Graphs tracks both a poll based estimate of the Electoral College and a numbers based look at the Delegate Races. All of the charts and graphs seen in this post are from that site. Additional graphs, charts and raw data can be found there. All charts above are clickable to go to the current version of the detail page the chart is from, which may contain more up to date information than the snapshots on this page, which were current as of the time of this post. Follow @ElectionGraphs on Twitter or like Election Graphs on Facebook to see announcements of updates or to join the conversation. For those interested in individual general election poll updates, follow @ElecCollPolls on Twitter for all the polls as they are added.
Trump won New York 90 to 5. Those 5 delegates went to Kasich.
If there was any surprise here, it was that Trump got a few more delegates than expected. I didn’t track it in detail, but my impression was that most people expected a result in the 80’s.
In addition, since Wyoming there was an update to the delegate count in Georgia that moved one delegate from Trump to Cruz. So the net change since Wyoming was Trump +89, Kasich+5, Cruz +1.
So Trump got 93.68% of the delegates since Wyoming. He only needed 58.17% of the delegates. He easily cruised past this bar. So where does this put things?
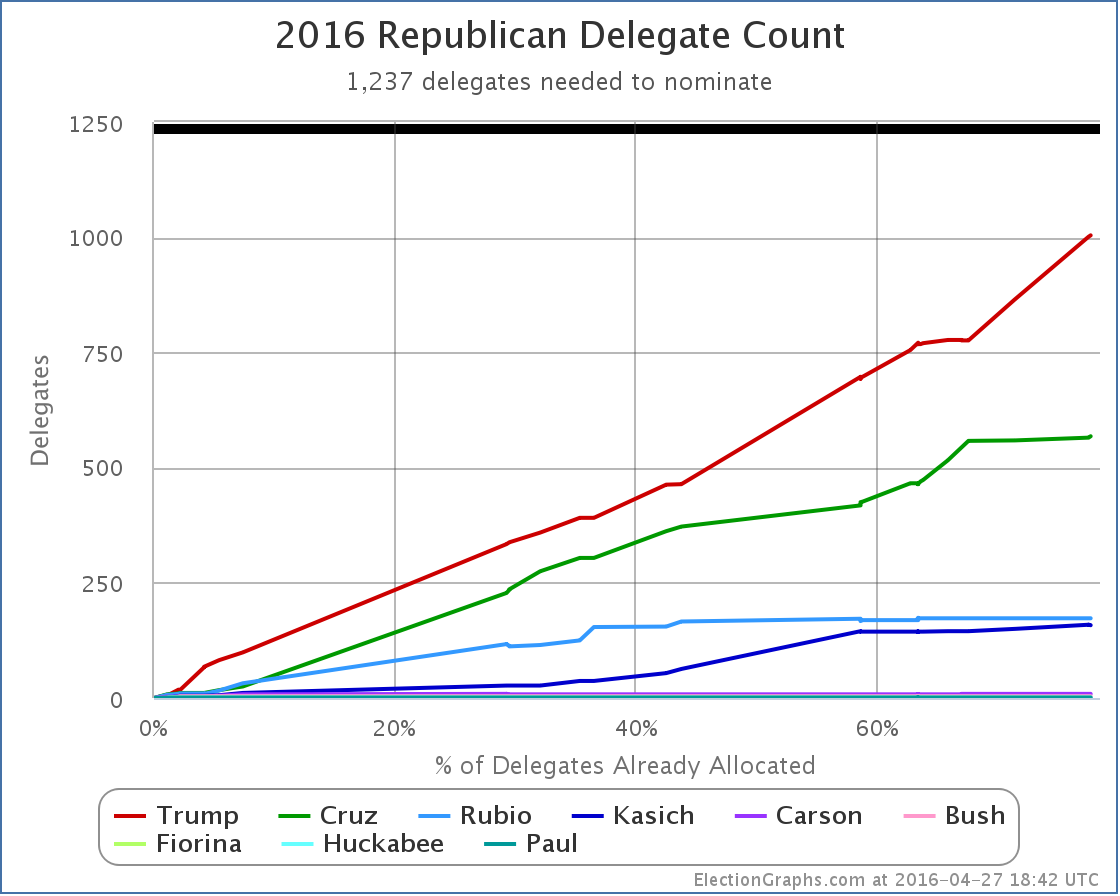
In raw delegates we now have Trump 849, Cruz 559, Rubio 173, Kasich 150, Carson 9, Bush 4, Fiorina 1, Huckabee 1, Paul 1. We have 725 delegates still outstanding or uncommitted. 1237 delegates are needed to win.
In percentage terms Trump now has 48.60% of the delegates determined so far. He is very very close to the magical 50% mark, but not quite there.
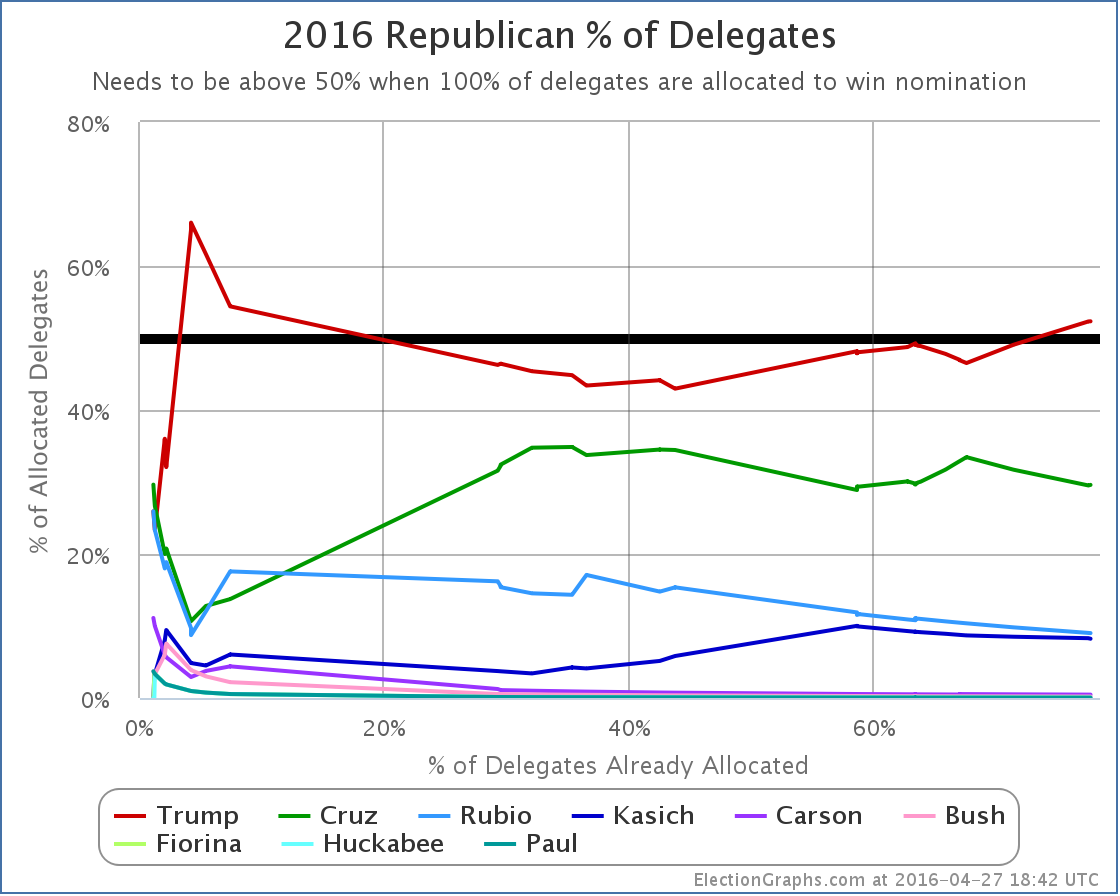
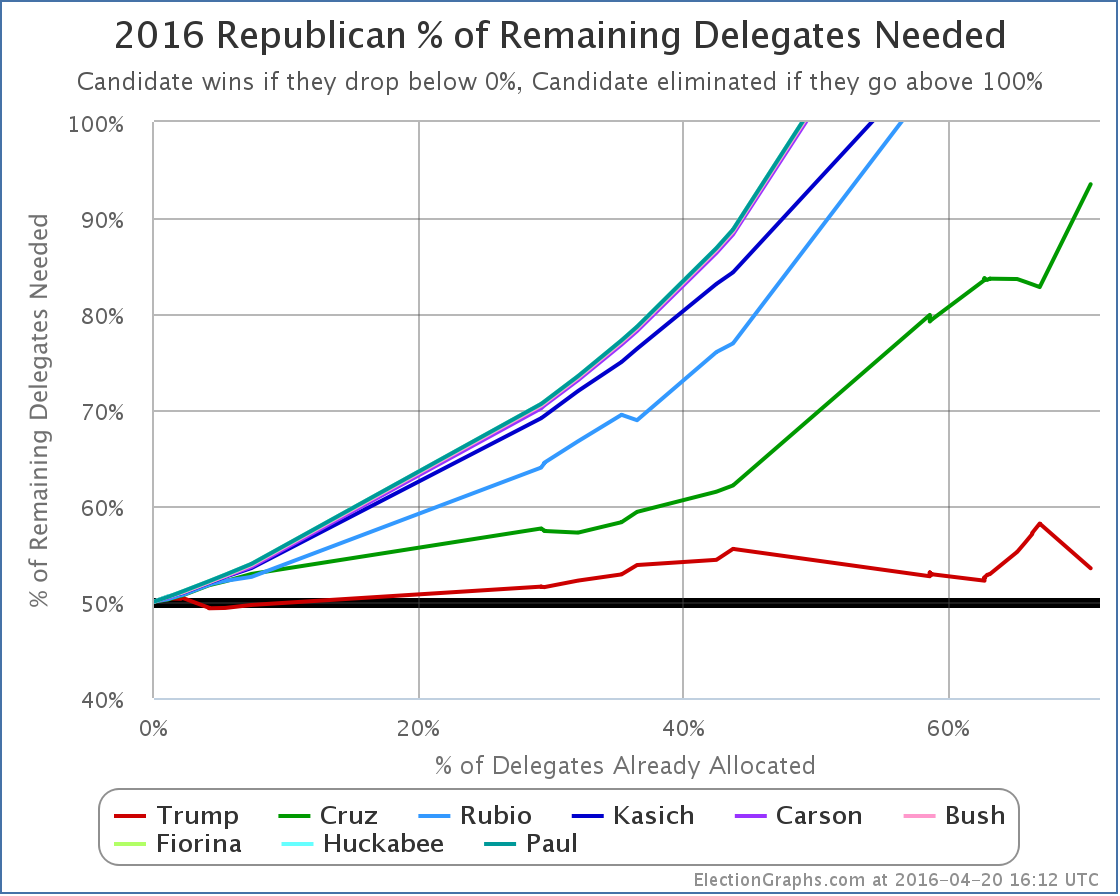
So time to look at the all important “% of remaining delegates needed” graph. As mentioned in the post here about Wyoming: If Trump did as well as was expected, he would undo most, but not all, of the damage done by Cruz’s recent series of wins, and that is exactly what played out.
Trump was down to 52.22% before his series of losses. After those losses he was up to 58.17%. Now he is back down to 53.52%.
Trump needs to get at least 53.52% of the remaining delegates… including officially uncommitted delegates… to get to 1237 and win this thing outright. Even one delegate short of that, and we’re in the multi-ballot convention zone.
The next few states are all very favorable for Trump. Next Tuesday we have Pennsylvania, Maryland, Connecticut, Rhode Island, and Delaware. Trump is expected to win all of them, by significant delegate margins. It is very possible that he will be over 50% of the delegates allocated so far at that point.
But then he has to keep it. Trump will still be right on the edge. He does a little worse, we have a multi-ballot convention, he does a little better, he wins on the first ballot.
So what are Trump’s odds of getting to 1237? This is unclear. But what is clear is that we are not yet at the point where we can say that either the path to an outright Trump win, or the path to a multi-ballot convention is undeniably the likeliest outcome.
Trump can still get an outright majority of delegates. This is very plausible. It is a reasonable possibility, not just a fantasy.
Some people (including me) have characterized this as a narrow path that Trump has to get nearly perfectly. That would seem to imply relatively low odds of this outcome. Maybe 10% or 20%. (Although I gave 40% as my odds in my podcast.)
On the other extreme, you have Sam Wang putting Trump’s odds of getting to 1237 at 64%. (That was before New York, but New York played out as good or better than Wang expected, so if anything that is now low.)
Looking at the simulators at The Upshot and FiveThirtyEight you see that it is still very easy to get Trump to the magic number. You usually have to use uncommitted delegates though. Trump will need to convince some more of them to come his way.
So maybe Trump is at 30% to win outright, or maybe he is at 64%. Either way, these are odds where either outcome would not be surprising. We’re basically still in the tossup zone. We are STILL right on the edge between Trump and a multi-ballot convention. And we might stay right on that edge straight through the end of the primaries and caucuses in June… or even all the way to the convention if the uncommitted delegates don’t start letting us know what their true preferences are.
Unlike the Democratic side, where Clinton has just been slowly but surely grinding out a win, here on the Republican side we have real drama. None of the others running can realistically win outright, but they CAN still stop Trump from winning outright and force a contested convention.
And so it continues…
[Update 2016-04-27 17:28 UTC: Updated uncommitted numbers from North Dakota. Net Cruz +2.]
Note: This post is an update based on the data on ElectionGraphs.com. Election Graphs tracks both a poll based estimate of the Electoral College and a numbers based look at the Delegate Races. All of the charts and graphs seen in this post are from that site. Additional graphs, charts and raw data can be found there. All charts above are clickable to go to the current version of the detail page the chart is from, which may contain more up to date information than the snapshots on this page, which were current as of the time of this post. Follow @ElectionGraphs on Twitter or like Election Graphs on Facebook to see announcements of updates or to join the conversation. For those interested in individual general election poll updates, follow @ElecCollPolls on Twitter for all the polls as they are added.
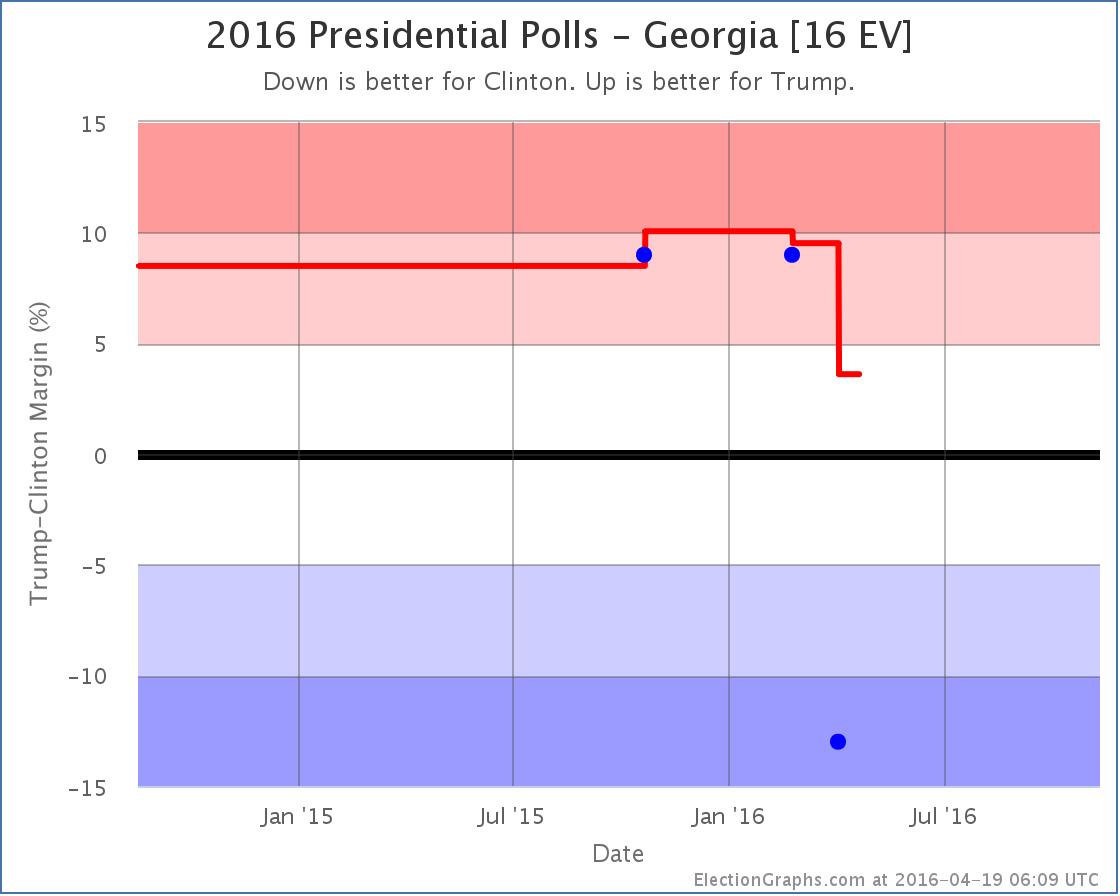
Since the last update on the Electoral College picture there have been polls in Wisconsin, California (x2), Mississippi, Virginia, Pennsylvania (x2), Maryland (x2), New York (x5), Connecticut, Massachusetts, New Jersey, Utah, and Georgia. The only one of these that resulted in a change in the overall 2016 electoral college summary was the poll in Georgia.
That poll was bad news for both Trump and Cruz. It showed both of them losing to Clinton. We don’t pay attention to individual polls of course, we look at the averages. But in both cases adding in this new poll drops the Republican lead in Georgia to less than 5%, which means that Georgia may be in play for Clinton this year. Georgia hasn’t been blue since 24 years ago when it voted for another Clinton in 1992.
Lets look specifically at the two match-ups here:
Clinton vs Trump
Georgia has been sparsely polled. It was not particularly expected to be a swing state. For Clinton vs Trump we only have three polls and so are still using the 2012 and 2008 election results to fill in the poll average. This new poll represents a really large move from the others as well, so there is a potential that future polls will show it to be an outlier.
But with those caveats, we now only have a 3.6% lead for Trump, which is close enough that we include picking up Georgia in Clinton’s “best case”.
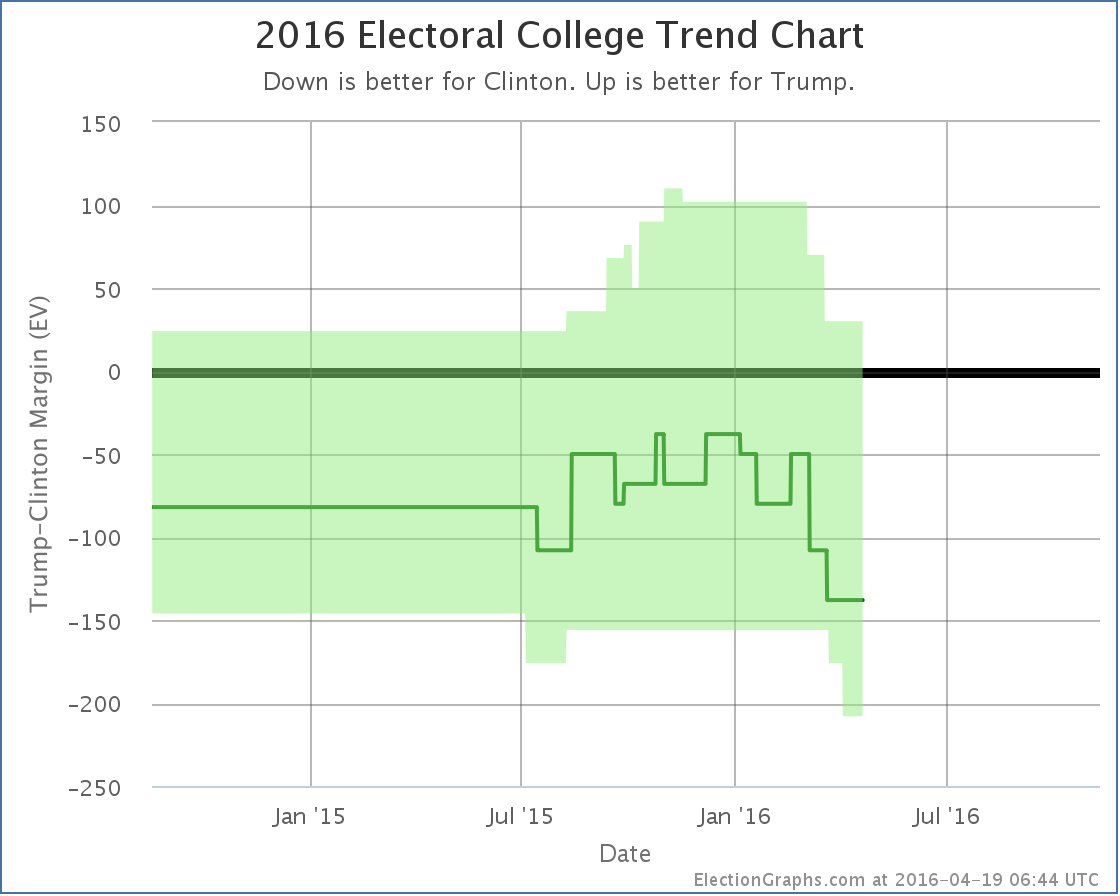
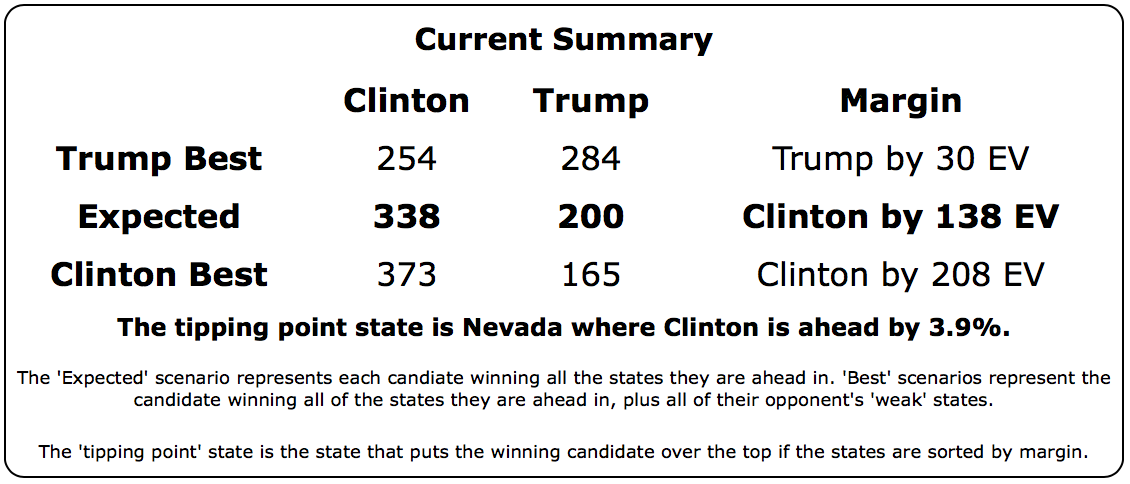
Clinton’s best case, where she wins not only the states she is ahead in, but also picks up the states where she is currently less than 5% behind… that would currently be Colorado (1.9% Trump lead), Georgia (3.6% Trump lead), and Missouri (4.7% Trump lead)… is now a 208 electoral vote win. The last time the margin was that large was when Bill Clinton beat Bob Dole with a 220 electoral vote margin in 1996.
Keep in mind however that this is Clinton’s best case. The “expected” result is a narrower 138 electoral vote win. That is in between Obama’s win in 2012 (126 electoral votes) and his win in 2008 (192 electoral votes).
Trump’s best case, where he picks up all six of the weak Clinton states (North Carolina, Iowa, Florida, Ohio, Nevada, and Minnesota) is still to pull out a 30 electoral vote win.
The downward trend in Trump’s general election polling that started in January continues. The questions are “How far does he fall before he bottoms?” and “Can Trump rebound after that?”.
Assuming he is the nominee of course.
Time to look at the other contender:
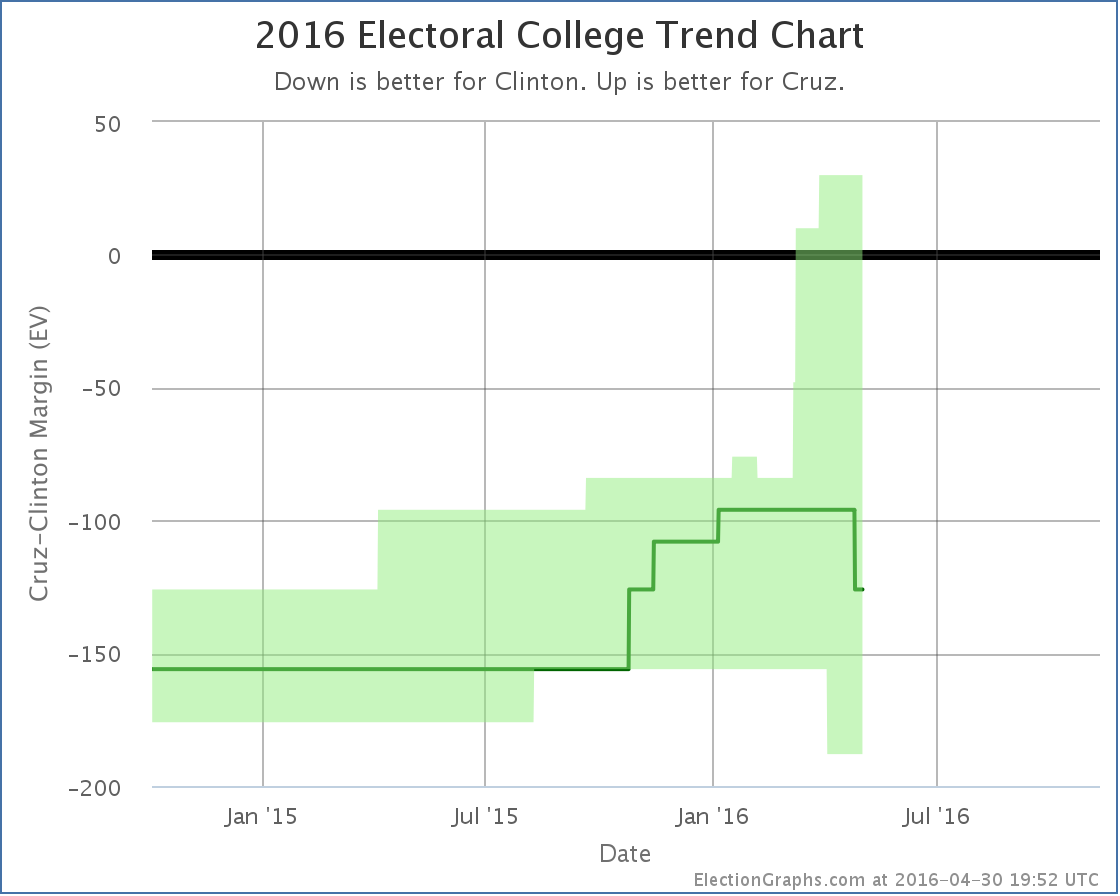
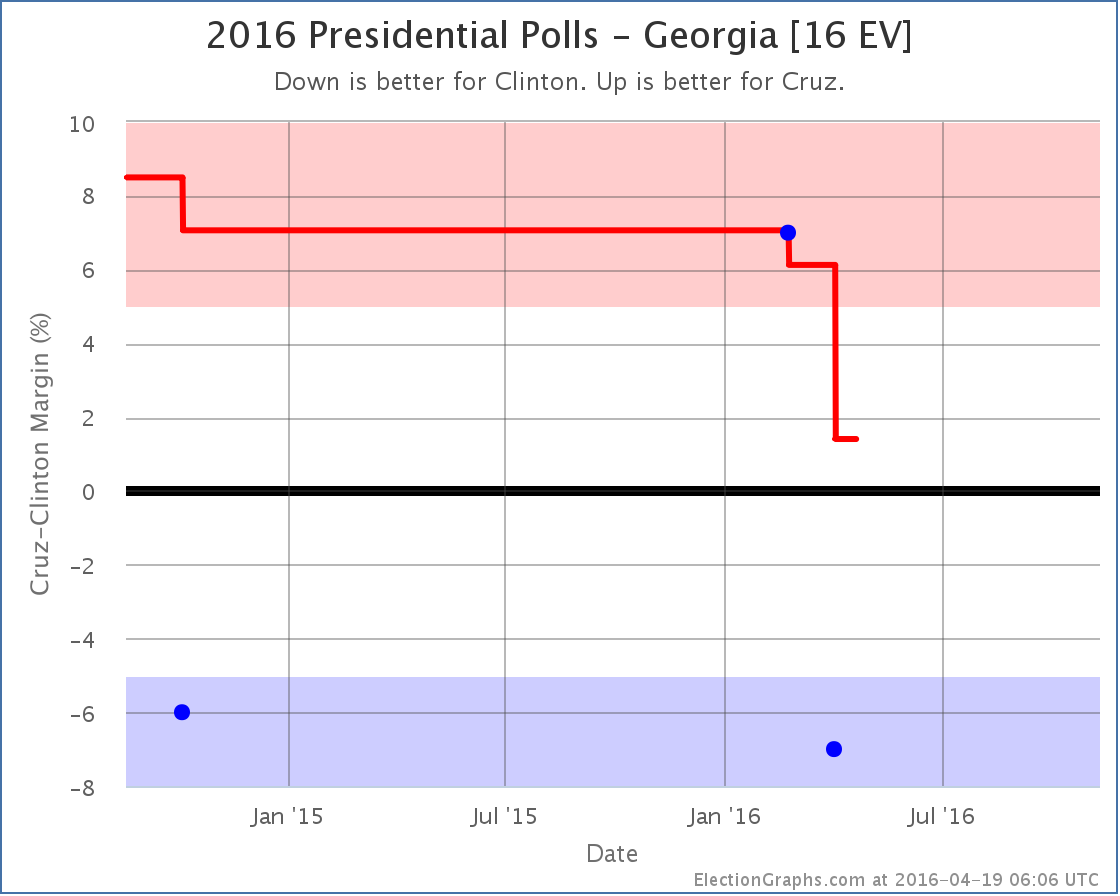
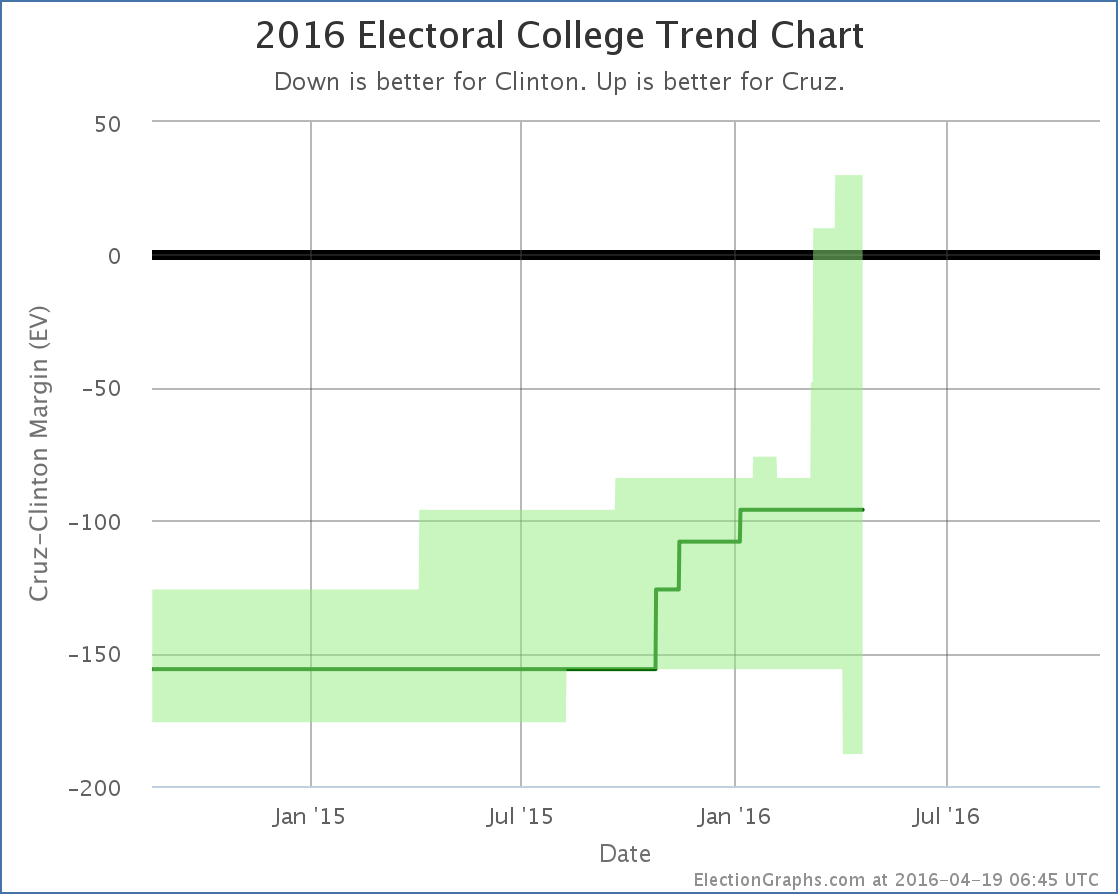
Clinton vs Cruz
Like Clinton vs Trump, there have only been three polls of Clinton vs Cruz, but in this case one of the three is much older. We’re still filling the average with the 2012 and 2008 election results as well.
With the new poll, Cruz’s lead in Georgia is down to only 1.4%. Unlike the Clinton vs Cruz case we actually have two polls showing a similar result, so the case that this is just an outlier is a little weaker.
In any case, the average now shows Georgia as a close state.
Clinton’s best case here improves to winning by 188 electoral votes.
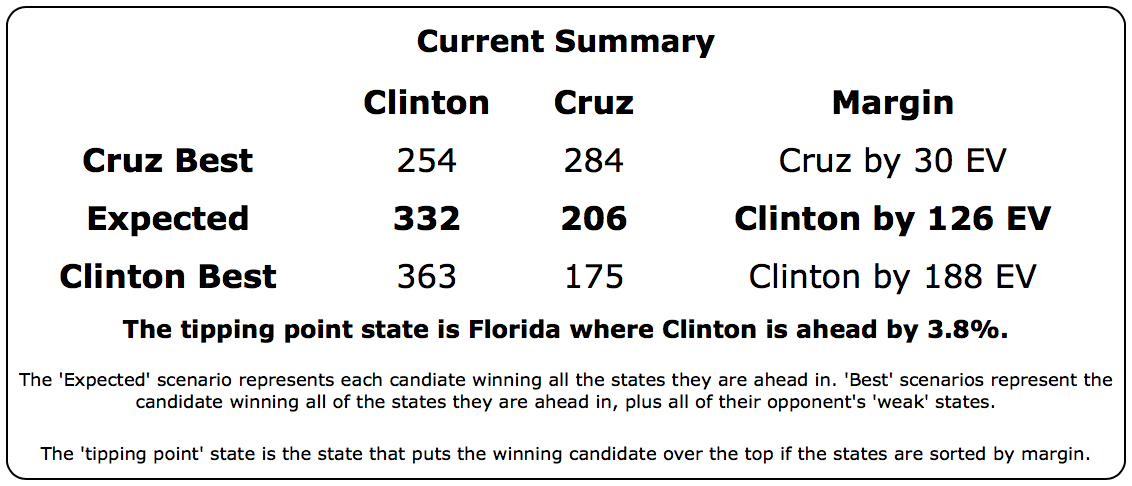
Comparing Cruz and Trump, Cruz is doing better in the tipping point metric, in his worst case, and his expected case. He and Trump tie in their best case, with the narrow 30 electoral vote win.
Cruz’s trend has also generally been an improving trend. Today’s change is actually notable for being only the third decline for Cruz in my summary in the last year.
This decline then brings up the opposite question than the one we asked about Trump. Rather than asking when we will reach a bottom, with Cruz the question is when he will peak.
203.4 days until the general election polls start to close.
Note: This post is an update based on the data on ElectionGraphs.com. Election Graphs tracks both a poll based estimate of the Electoral College and a numbers based look at the Delegate Races. All of the charts and graphs seen in this post are from that site. Additional graphs, charts and raw data can be found there. All charts above are clickable to go to the current version of the detail page the chart is from, which may contain more up to date information than the snapshots on this page, which were current as of the time of this post. Follow @ElectionGraphs on Twitter or like Election Graphs on Facebook to see announcements of updates or to join the conversation. For those interested in individual general election poll updates, follow @ElecCollPolls on Twitter for all the polls as they are added.