- 05:14:16 Retweeted @Gaohmee 2016-08-07 23:36:27 NO YOU ARE CRYING https://t.co/RXrdPLplL2
- 14:35:09 Good luck with that -> Anti-Trump Republican Launching Independent Presidential Bid (McKay Coppins) https://t.co/r3QwYnfqdW
- 16:15:26 Retweeted @onlxn 15:50:30 TRUMP: Americans need a break! Let's help pay for nannies!
RYAN: Not every family has a nanny.
TRUMP: Au pairs, then. Governesses. Whatever in reply to onlxn - 16:15:48 Retweeted @MEPFuller 15:57:27 Ridicule away, but:
David French was a quixotic, I-can-win-this candidate.
Evan McMullin seems to have a clear goal: Make Trump lose Utah. in reply to MEPFuller
- 16:18:35 Retweeted @JakeSherman 12:36:19 Tim kaine campaigning in Austin. Yes. In Texas. https://t.co/8M5bHVUT7J
- 16:25:39 House in play -> Generic Congressional ballot question, 2016 (Sam Wang) https://t.co/vo7L1v2Ay7
- 17:59:29 Listening to KCRW's UnFictional Hearing Hiroshima
via iCatcher! https://t.co/I3wiNnwLDj - 22:22:56 Retweeted @artologica 21:48:07 Evan McMullin jumps into the presidential race like https://t.co/MxwWVkfp0s https://t.co/08v2U3VQ26
- 23:33:07 Reading – Bay Area Hiring: Stiff Competition for Mediocre Talent (@jennsteele) https://t.co/kqv1ipoYTi
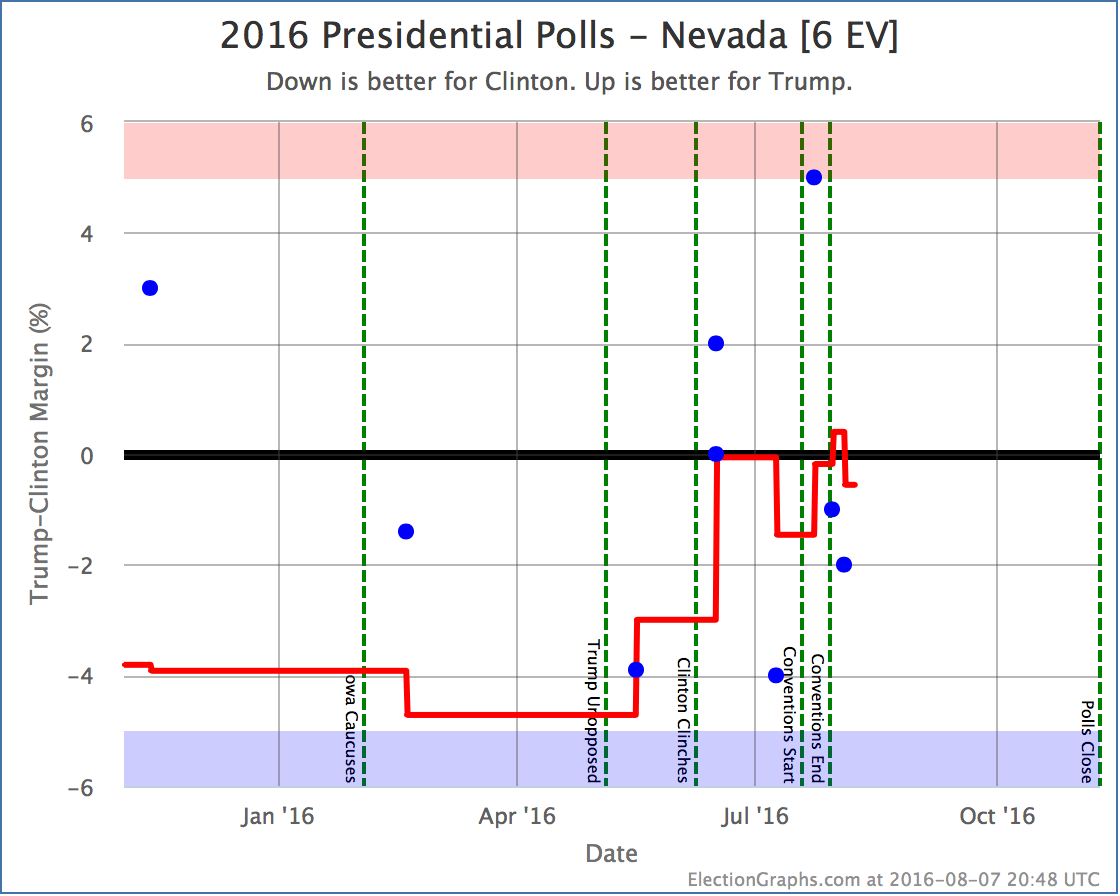
States with new poll data since the last update: Virginia, Nevada, Arizona The polls keep coming, as they will straight through November. This time there is one change of note, reversing the movement in Nevada from a few days ago.
The polls making up the average still range from Clinton +4.0% to Trump +5.0%. There is wide variance here. The latest poll moves the average to Clinton +0.6%. So just on the Clinton side of the line again. In the end though, the best we can really say is that Nevada could easily go either way given current polling. For the moment though, Nevada is back on the Clinton side of the center line.
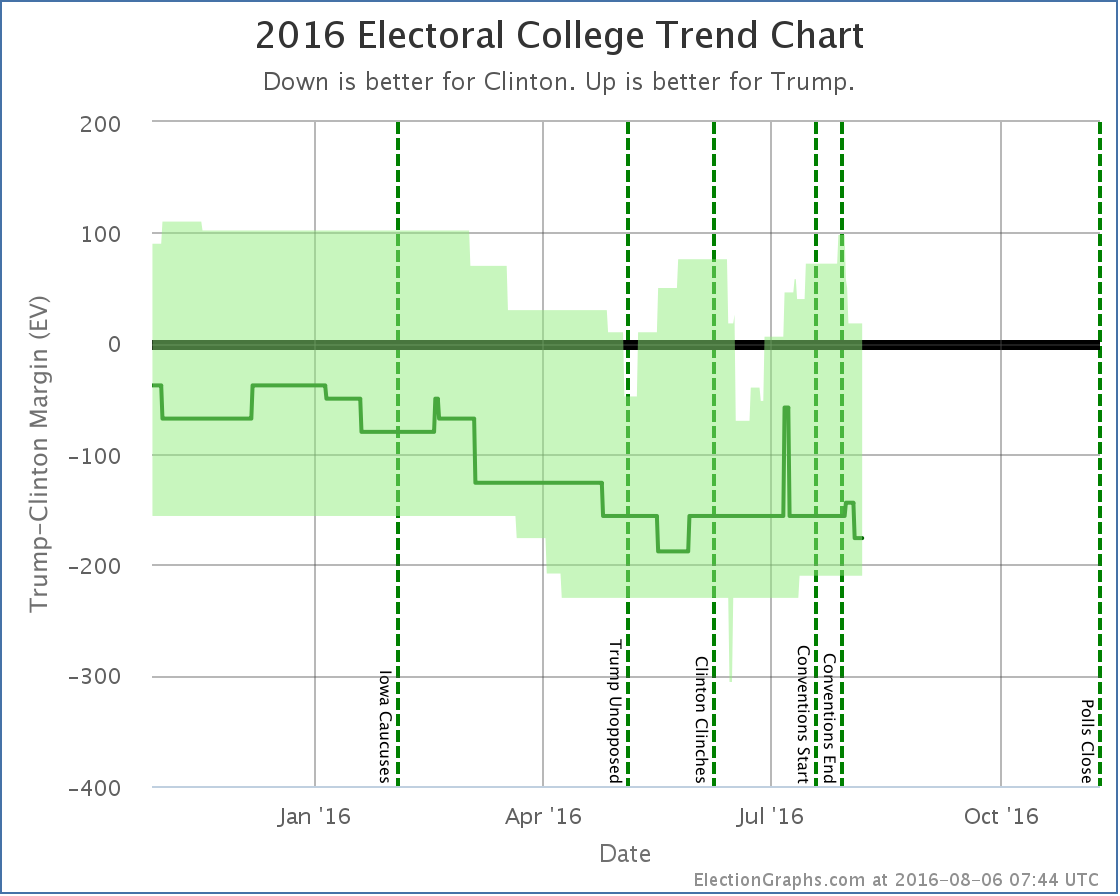
This changes the “expected case” where everybody wins all the states where they lead the polls to Clinton 363 Trump 175, a 188 electoral vote margin for Clinton. This is Clinton’s best showing in the expected case, tying a brief period in May. The other metrics are not at record levels at the moment, but this is the most important of the metrics tracked here… the actual expected outcome of the election. The time since the conventions ended has been very good for Clinton. So far. We’ll see how long the trend continues. Clinton may well be near a ceiling here. At this point further gains for Clinton would be involve pulling in states like Arizona, Texas, or Utah. Those states are much closer that was once expected, but they may be very hard to pull in that last little bit. Of course, even if this is a ceiling for Clinton, the ceiling is at a level where she wins decisively. If we actually see those states going blue, it may be time to start talking about a landslide after all. In the mean time though, if this was a normal campaign, the more realistic expectation would be to see things start drifting back toward Trump from here. With how things are going though, who knows. 93.1 days until polls start to close on election day. Note: This post is an update based on the data on ElectionGraphs.com. Election Graphs tracks both a poll based estimate of the Electoral College and a numbers based look at the Delegate Races. All of the charts and graphs seen in this post are from that site. Additional graphs, charts and raw data can be found there. Follow @ElectionGraphs on Twitter or like Election Graphs on Facebook to see announcements of updates or to join the conversation. For those interested in individual general election poll updates, follow @ElecCollPolls on Twitter for all the polls as they are added. If you find the information in these posts interesting or useful, please consider visiting the tip jar.
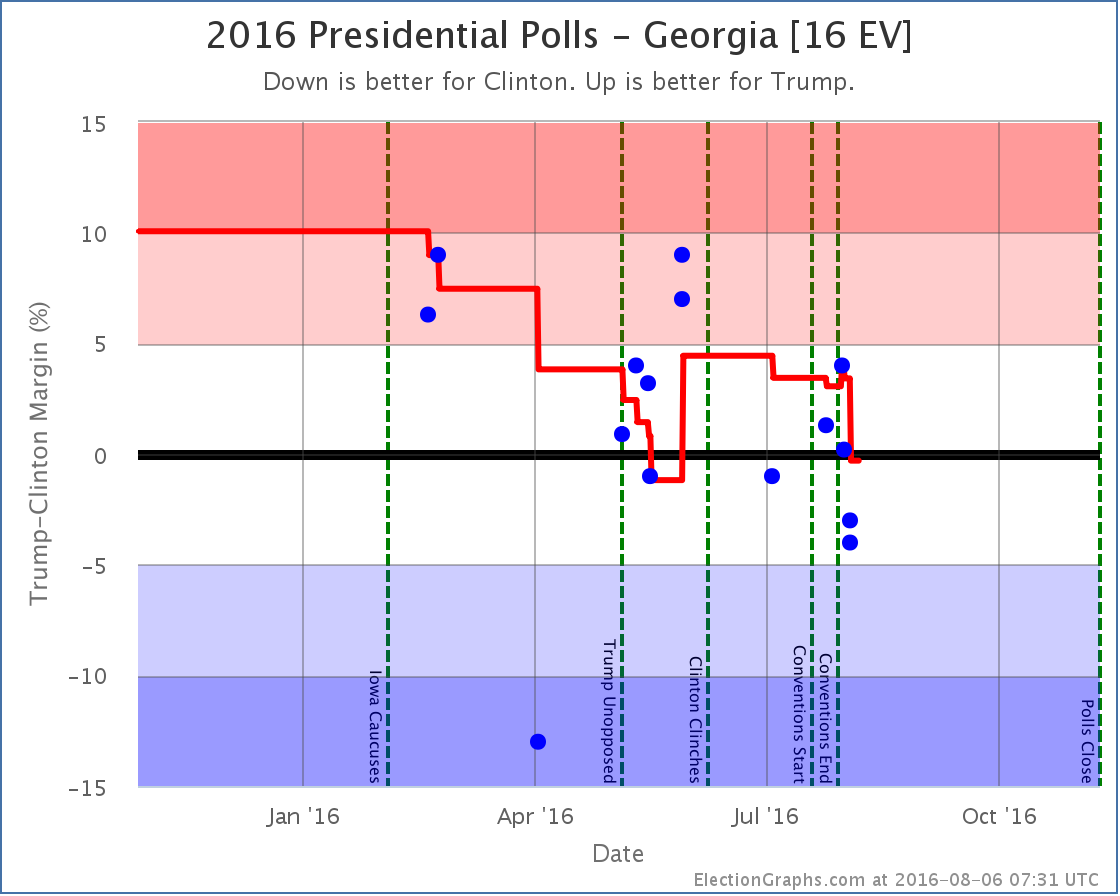
States with new poll data since the last update: Georgia, Michigan The string of bad news for Trump continues. This time out of Georgia:
Georgia has looked like a swing state ever since there were enough Clinton vs Trump polls to draw any real conclusions. It has consistently looked close. There was even a brief time in May where Clinton led in Georgia.* With the latest results in Georgia, Clinton once again leads… but the polls in the average range from Clinton +4.0% to Trump +4.0%. The average itself is very close. Clinton only leads by 0.3%. The only real conclusion here right now is that Georgia could go either way. Which is remarkable, since this is Georgia. Georgia hasn’t gone blue since Bill Clinton won there in 1992. Clinton’s very narrow lead here may well disappear with the very next poll, but for the moment, she is slightly ahead, so Georgia goes into her column.
If each candidate wins each of the states they are ahead in, Clinton now wins 357 to 181, a 176 electoral vote margin. This doesn’t yet match her high in May of a 188 electoral vote win in the expected case, but it is getting close. With talk of a massive Trump loss once again dominating the chatter about the election, keep in mind that a 176 electoral vote margin still places Trump in the zone where he is doing worse than Romney (126 EV loss) but better than McCain (192 EV loss). Trump is losing, but it is the same sort of loss as the last couple of Republican candidates, not something of historic proportions. At least not at the moment. Of course, there are 94.2 days until the polls close. That is plenty of time for things to change. A lot. It could get worse for Trump… or it could get better. It may well be that the latest drops are part of a Clinton convention bounce and not permanent damage for Trump. We’ll know better in a few weeks. * This was not noted at the time because the poll that pushed Clinton over the edge wasn’t found and added until after the state had popped back to Trump. Note: This post is an update based on the data on ElectionGraphs.com. Election Graphs tracks both a poll based estimate of the Electoral College and a numbers based look at the Delegate Races. All of the charts and graphs seen in this post are from that site. Additional graphs, charts and raw data can be found there. Follow @ElectionGraphs on Twitter or like Election Graphs on Facebook to see announcements of updates or to join the conversation. For those interested in individual general election poll updates, follow @ElecCollPolls on Twitter for all the polls as they are added. If you find the information in these posts interesting or useful, please consider visiting the tip jar.
|
||