This is the website of Abulsme Noibatno Itramne (also known as Sam Minter).
Posts here are rare these days. For current stuff, follow me on Mastodon
|
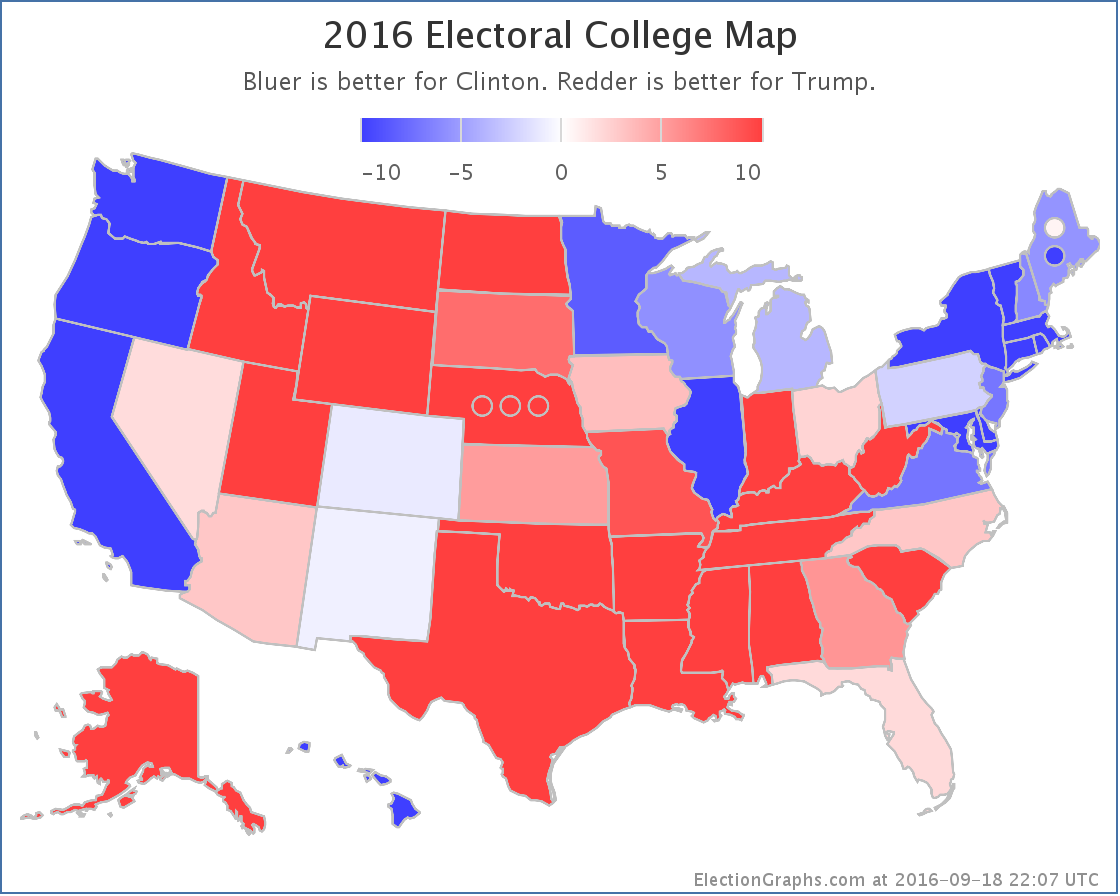
States with new poll data added since the last update: All 50 states and DC.
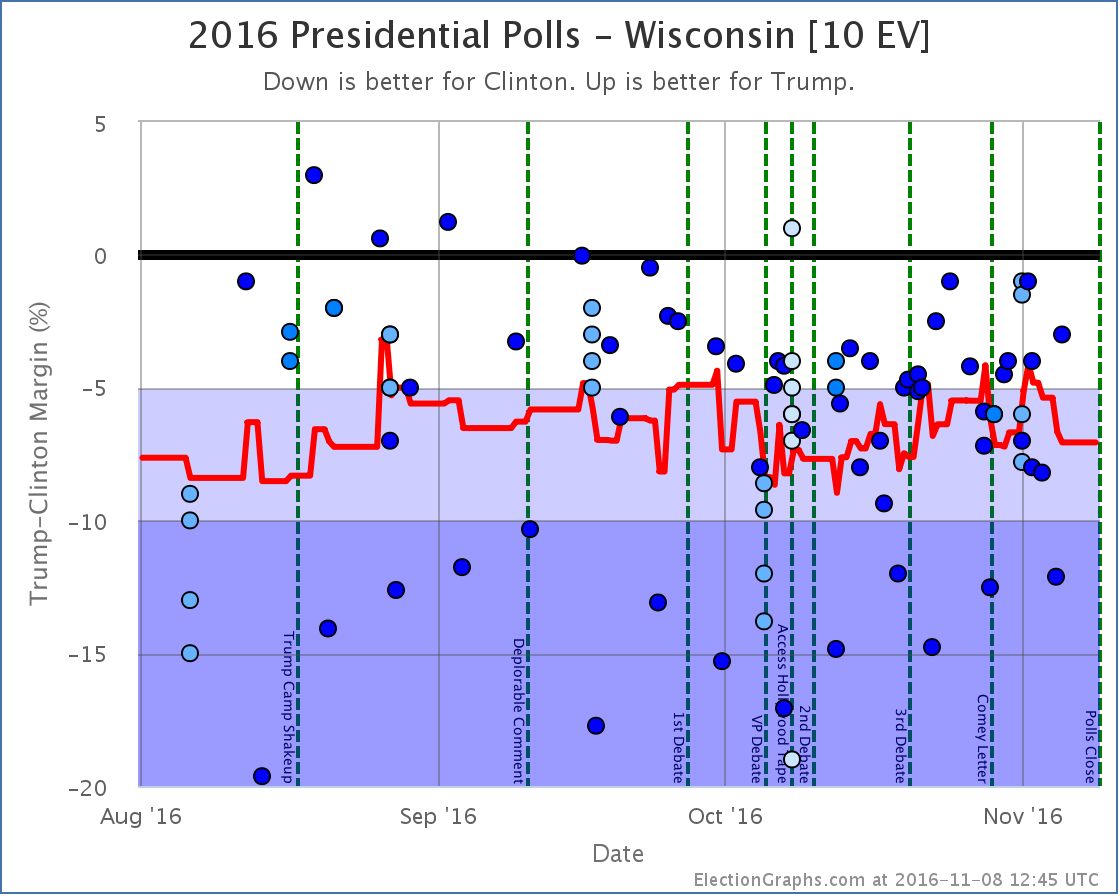
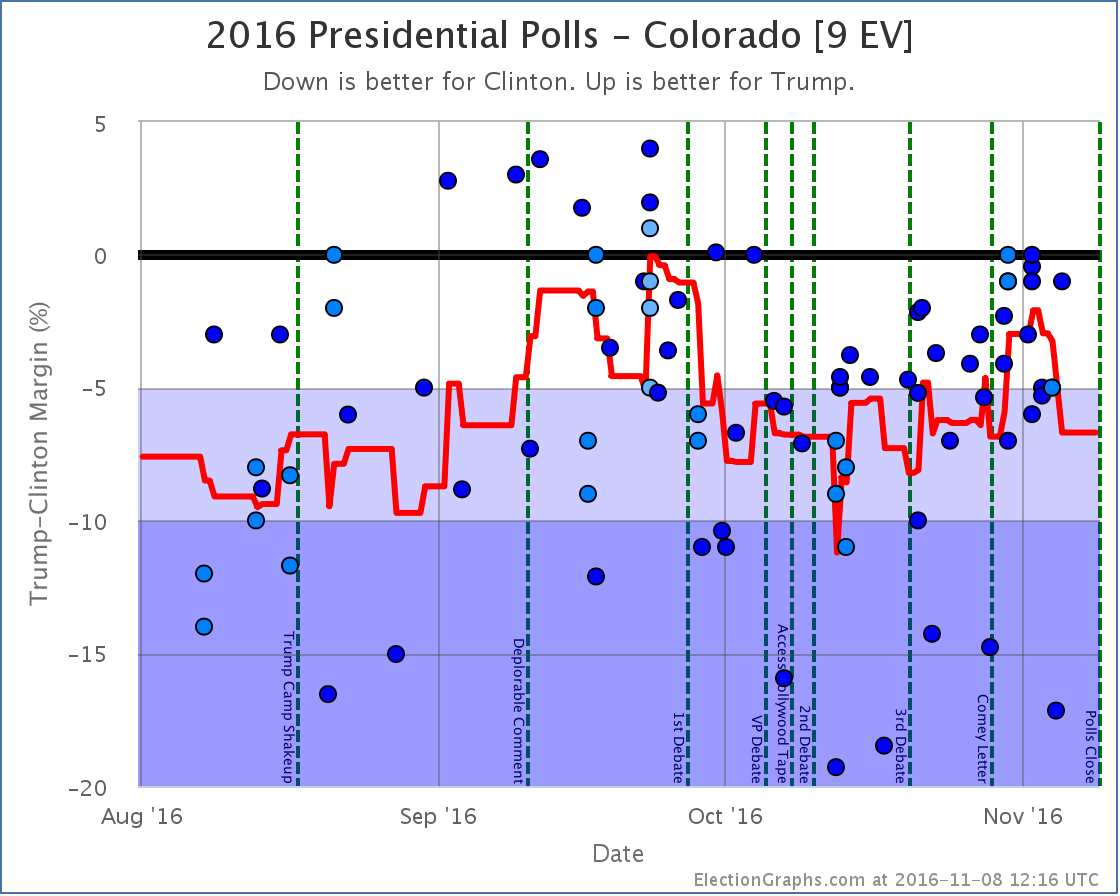
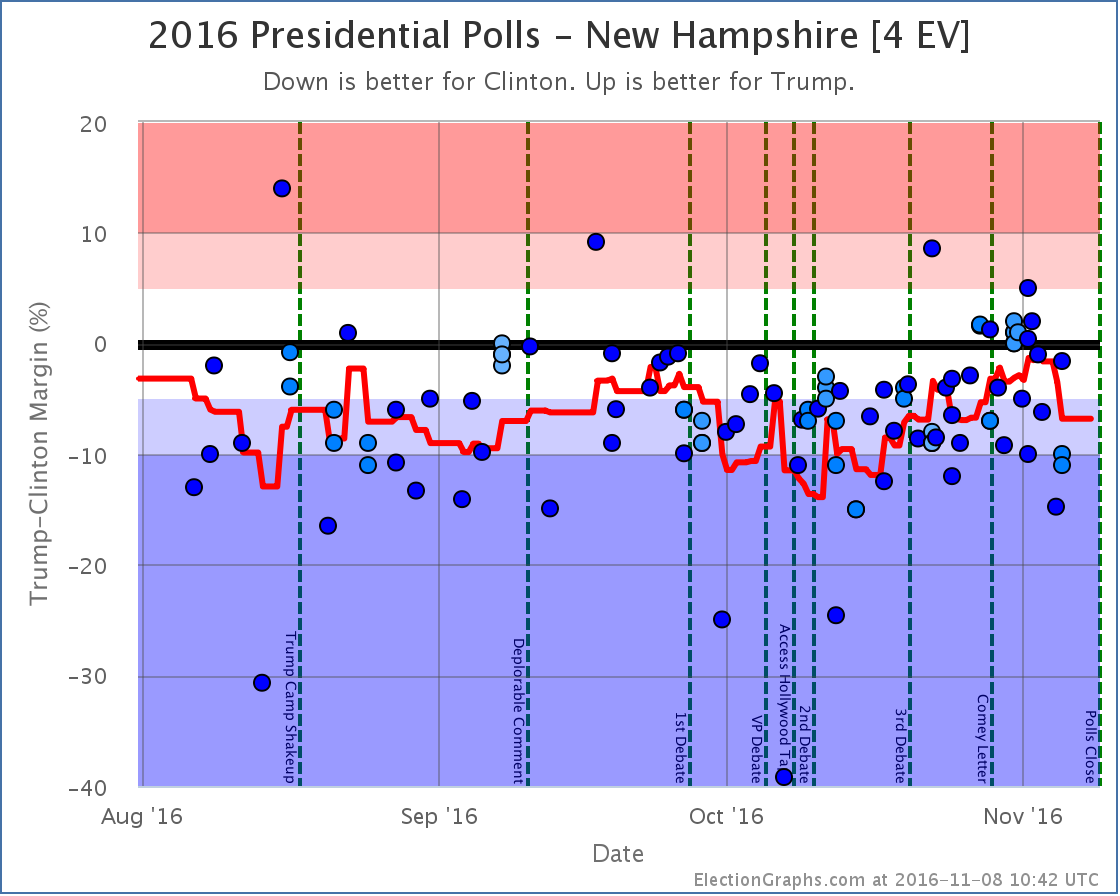
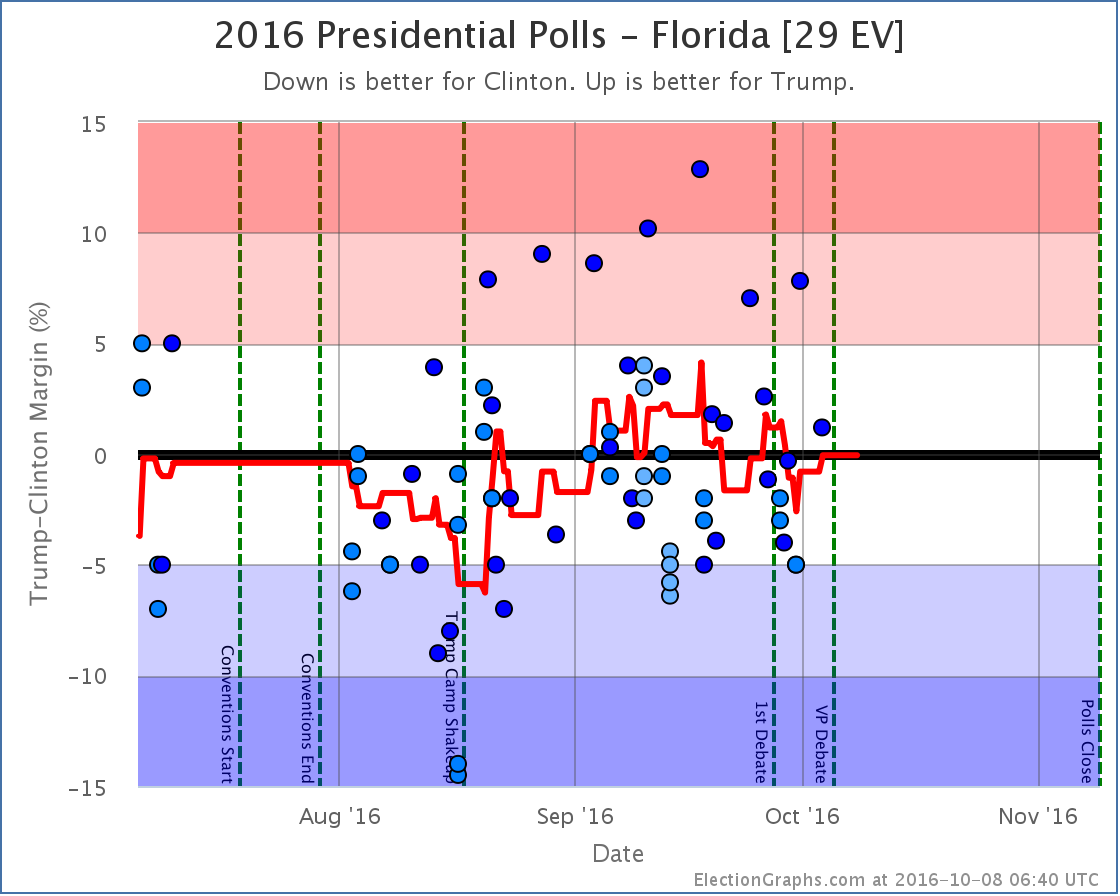
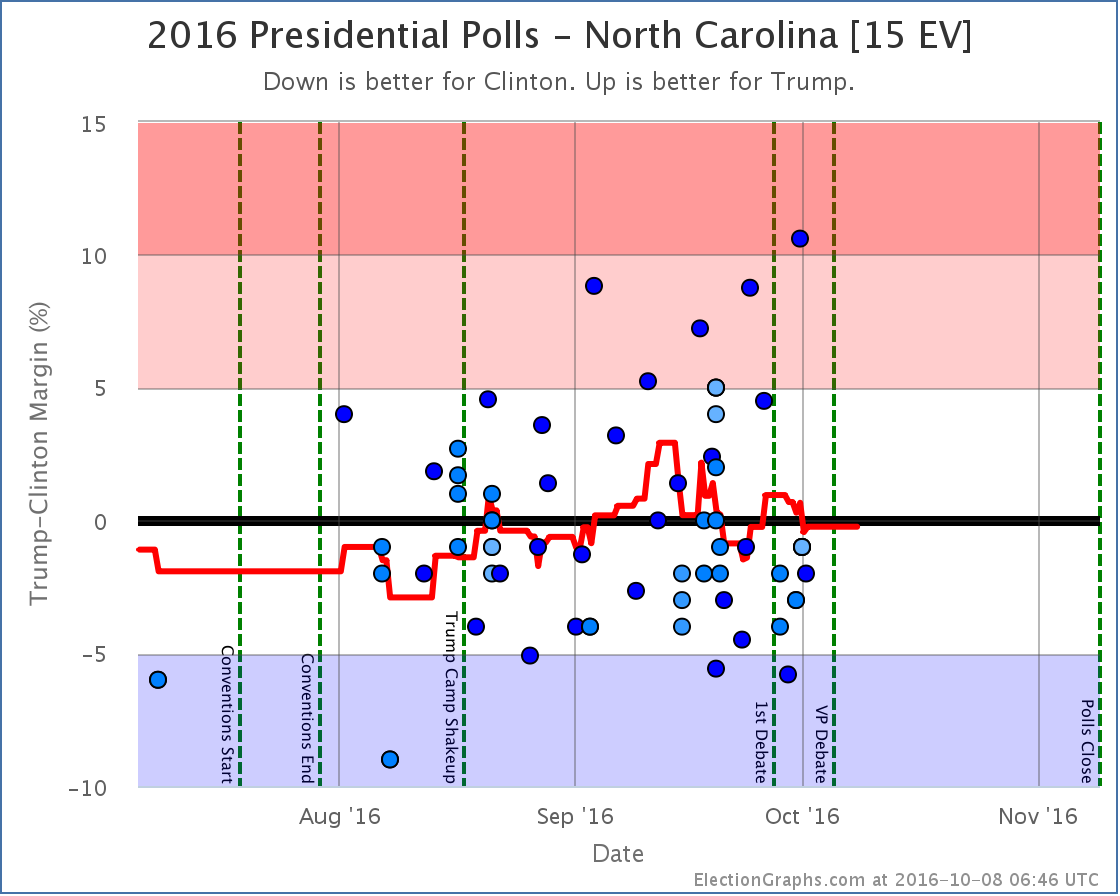
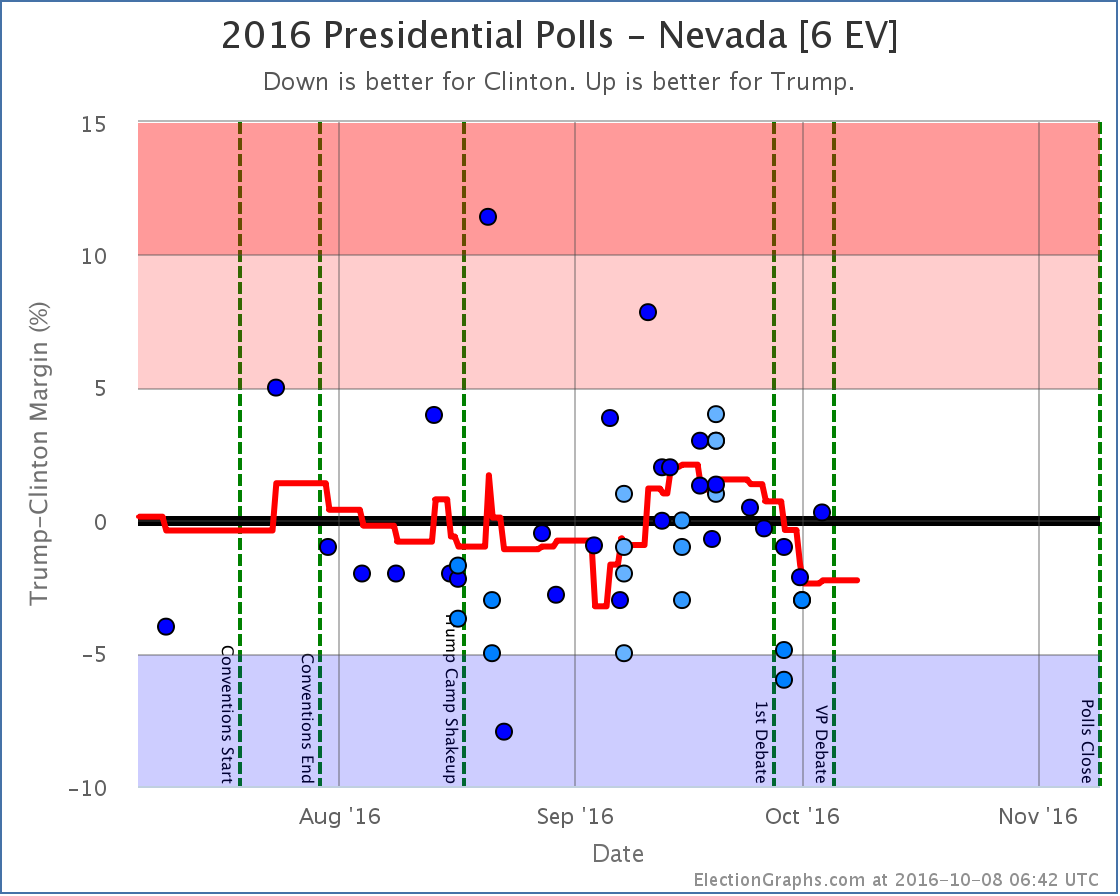
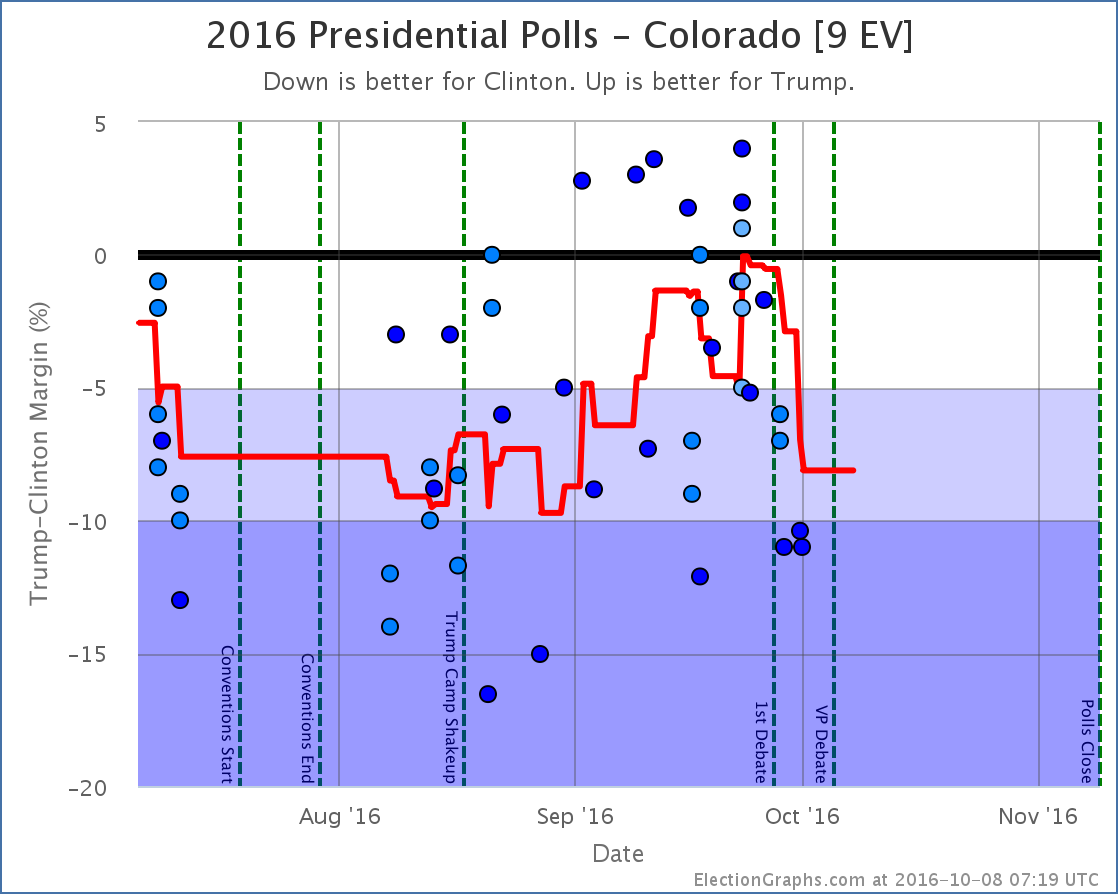
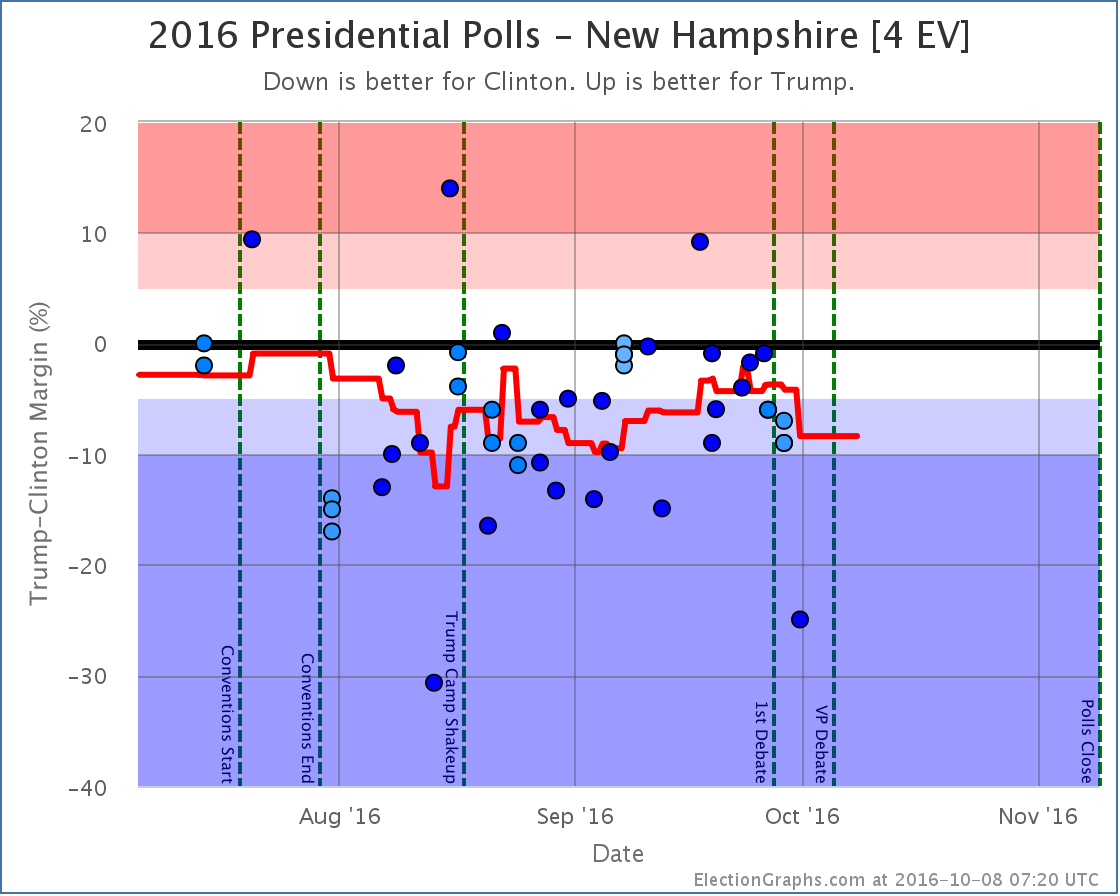
Notable changes in: Florida (29), North Carolina (15), Wisconsin (10), Colorado (9), Nevada (6), New Hampshire (4), and the tipping point
National Summary
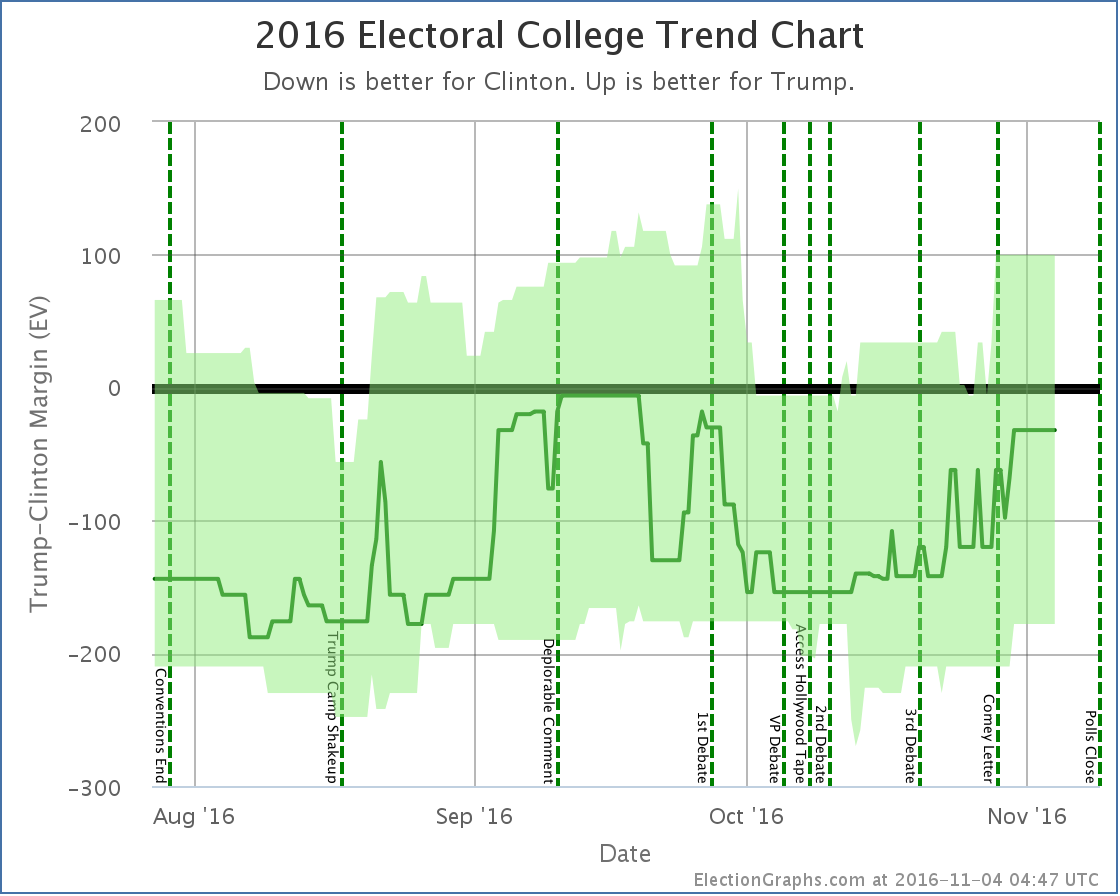
It has been about two days since the last update. While there are mixed changes since then, on balance this is a good update for Trump, and the race looks closer than it did two days ago.
There will be one more update later today to capture any last minute polls released after the cutoff for this update. (There have already been a handful.)
Good for Trump
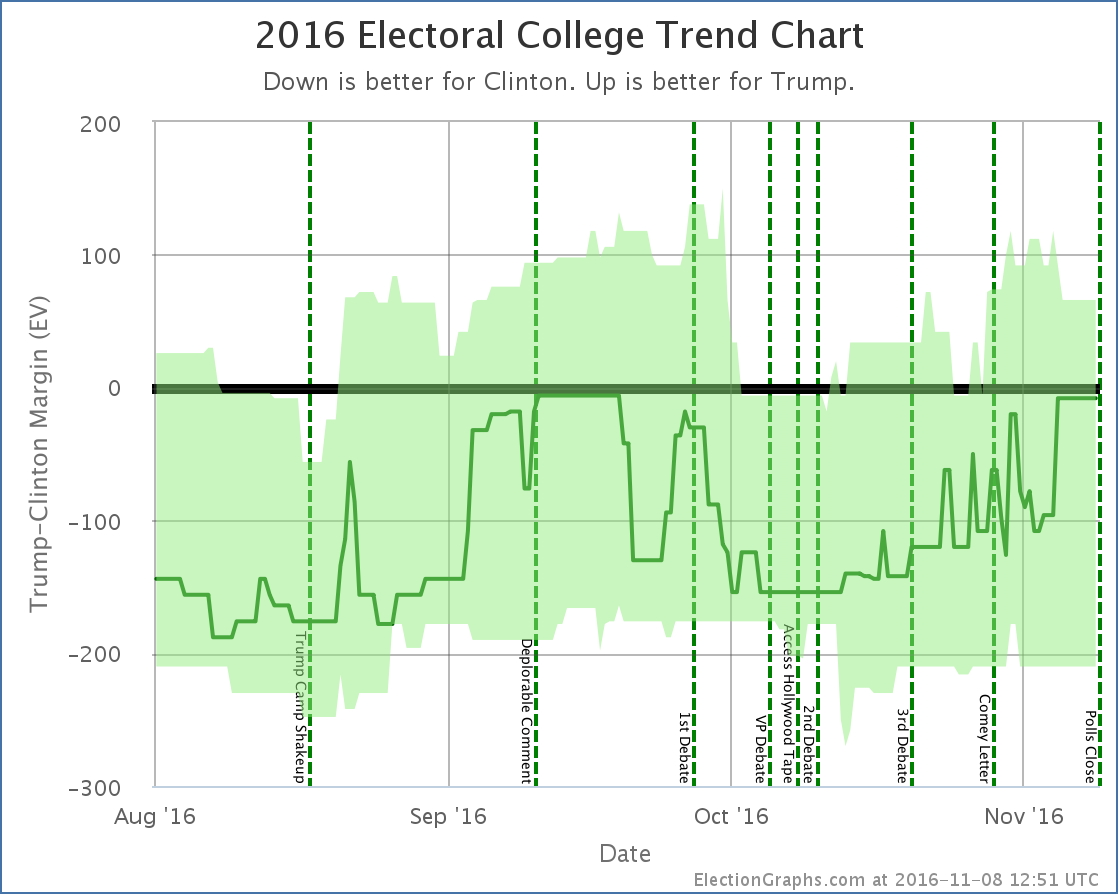
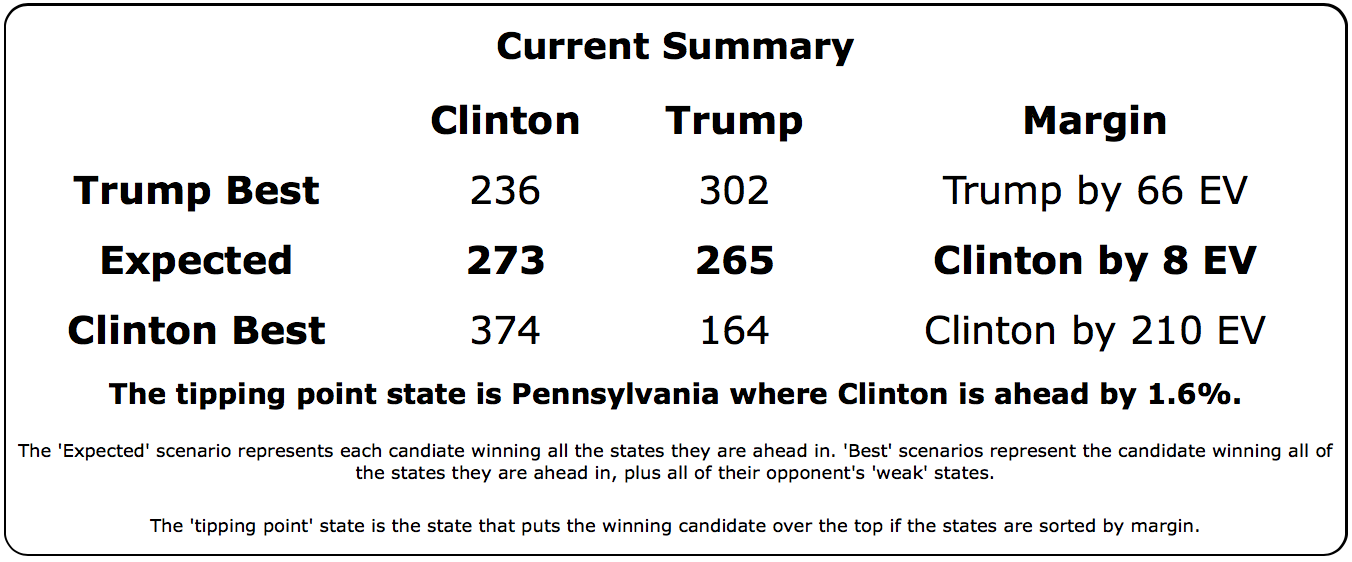
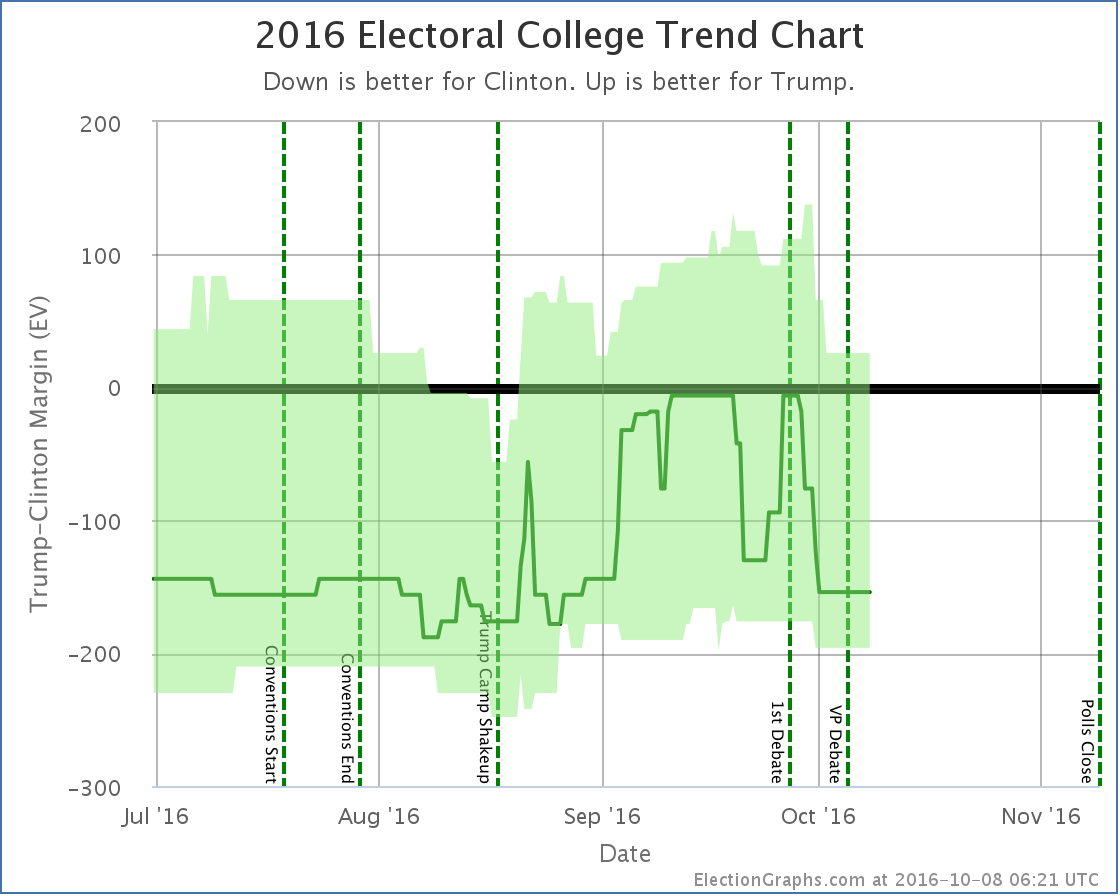
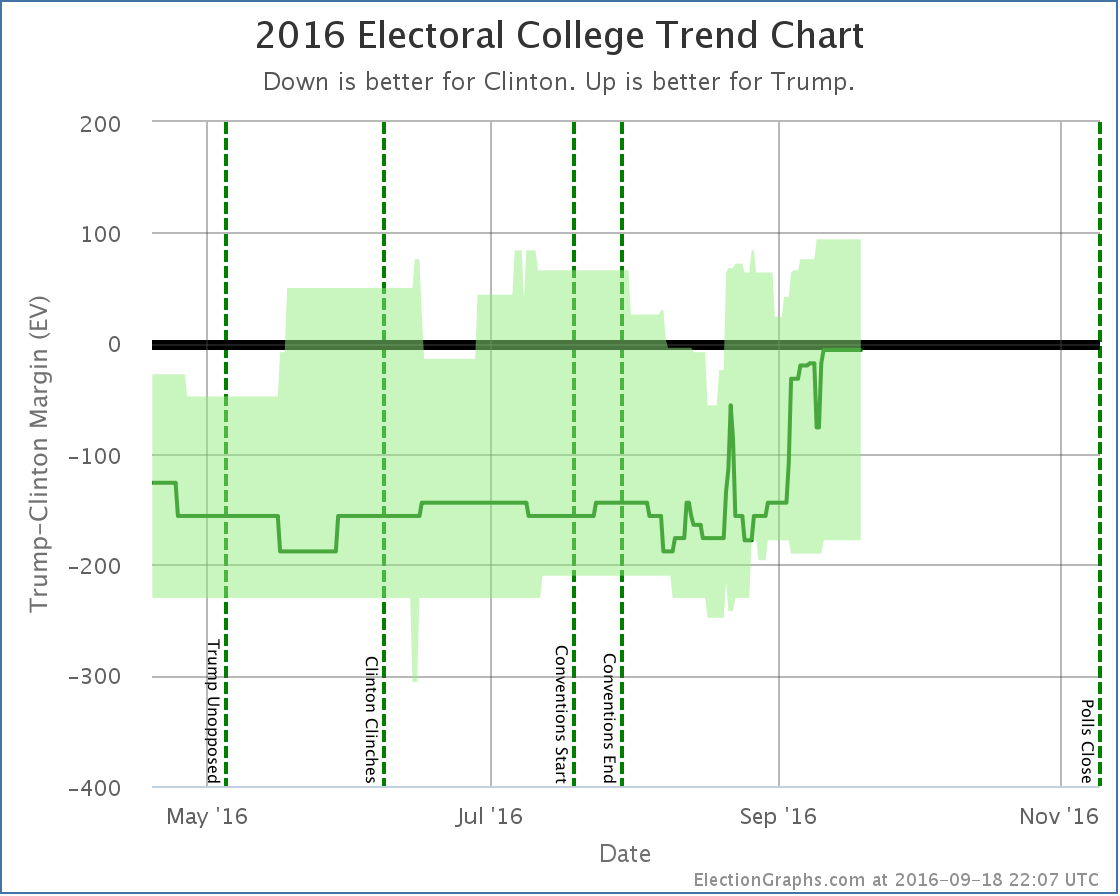
- The expected case moves from Clinton winning by 108 EV to Clinton winning by only 8 EV.
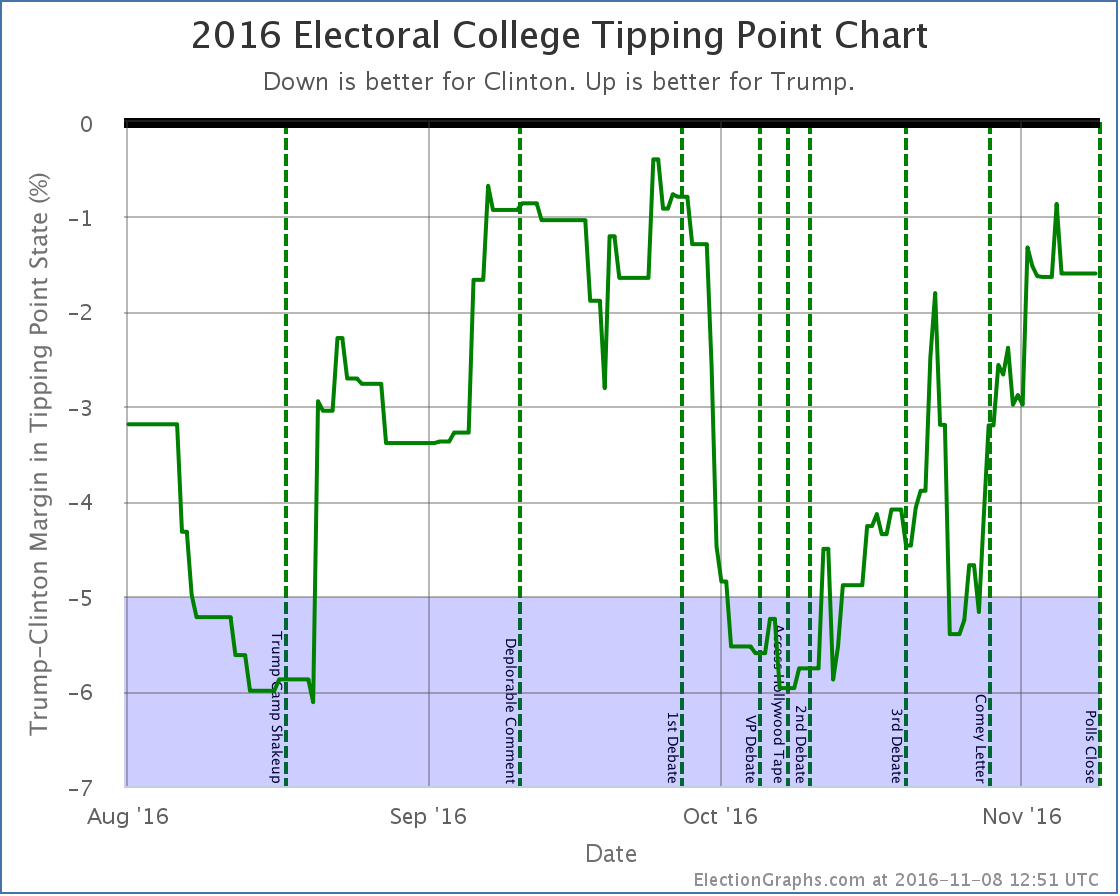
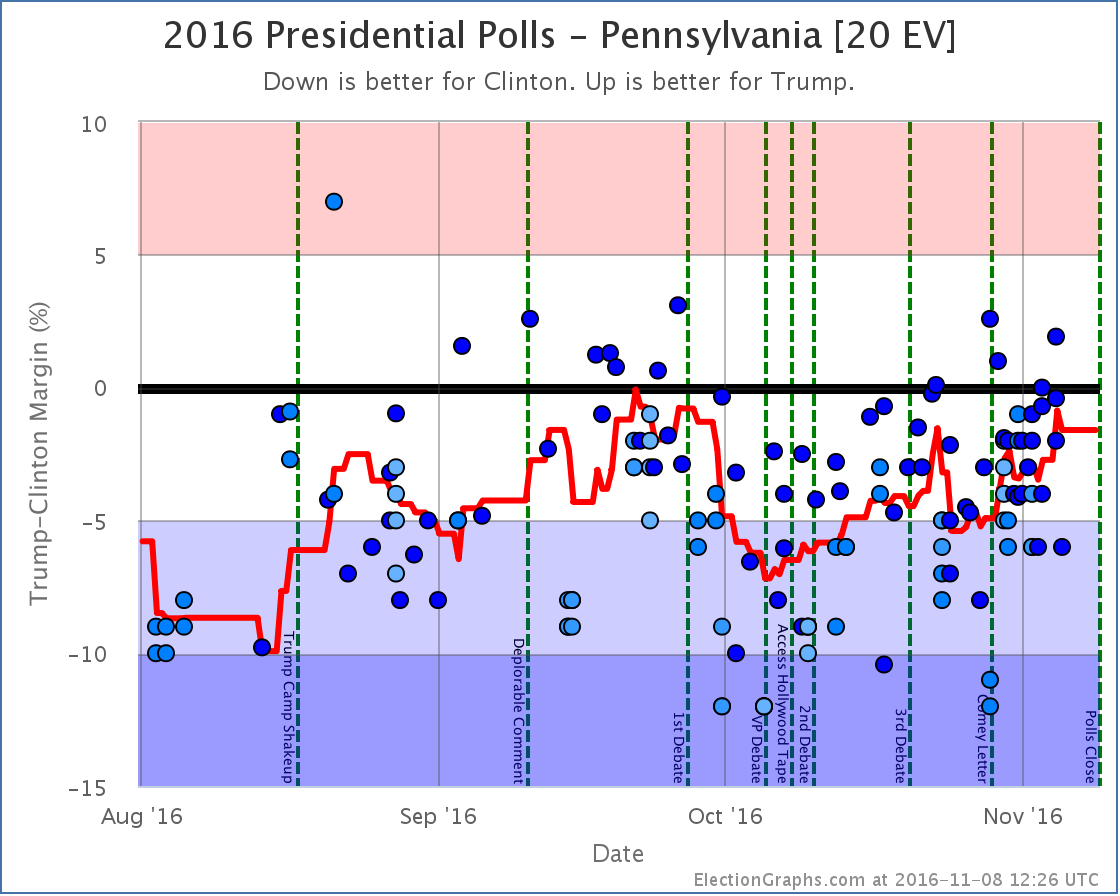
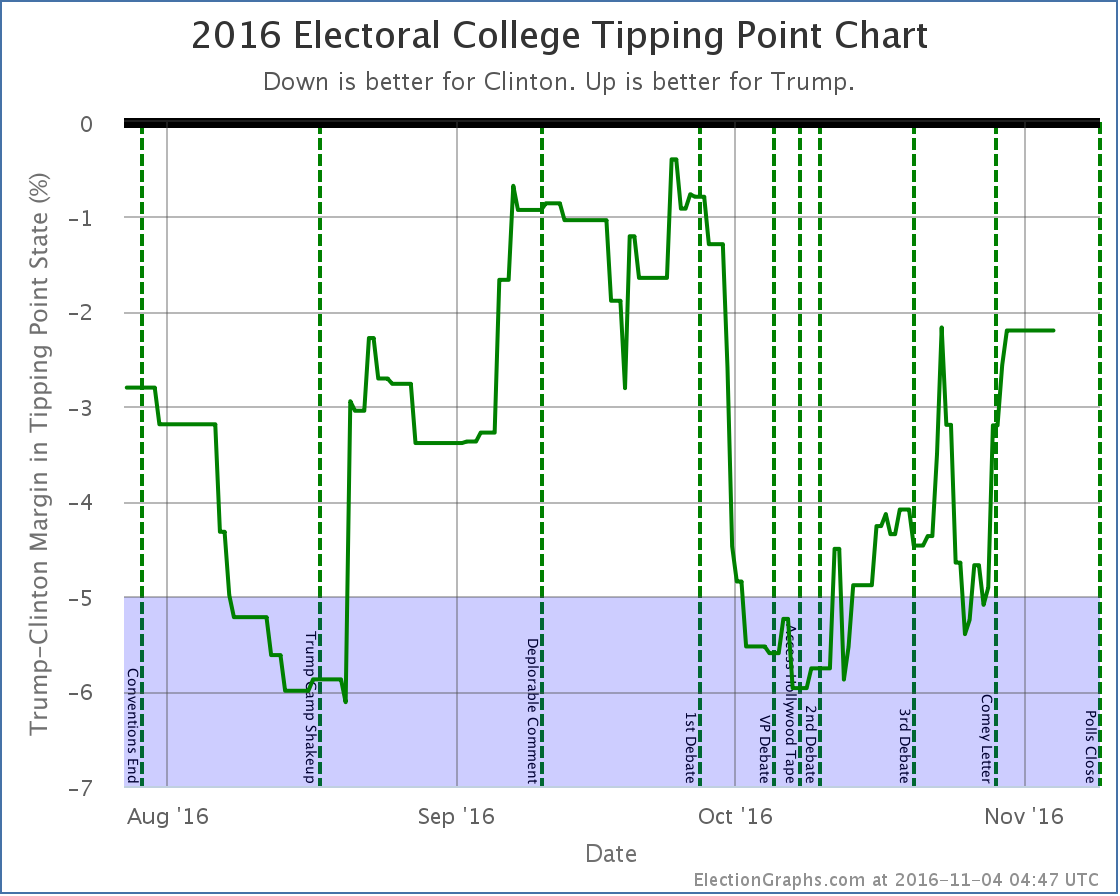
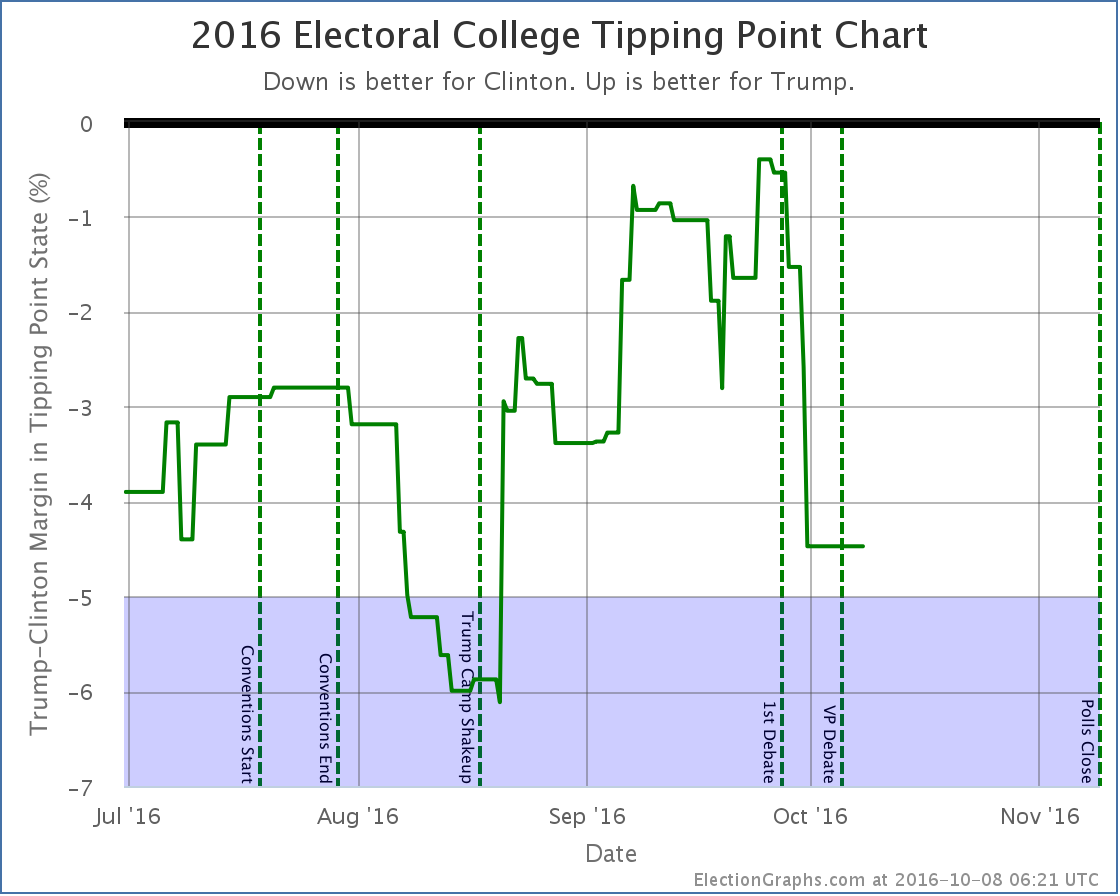
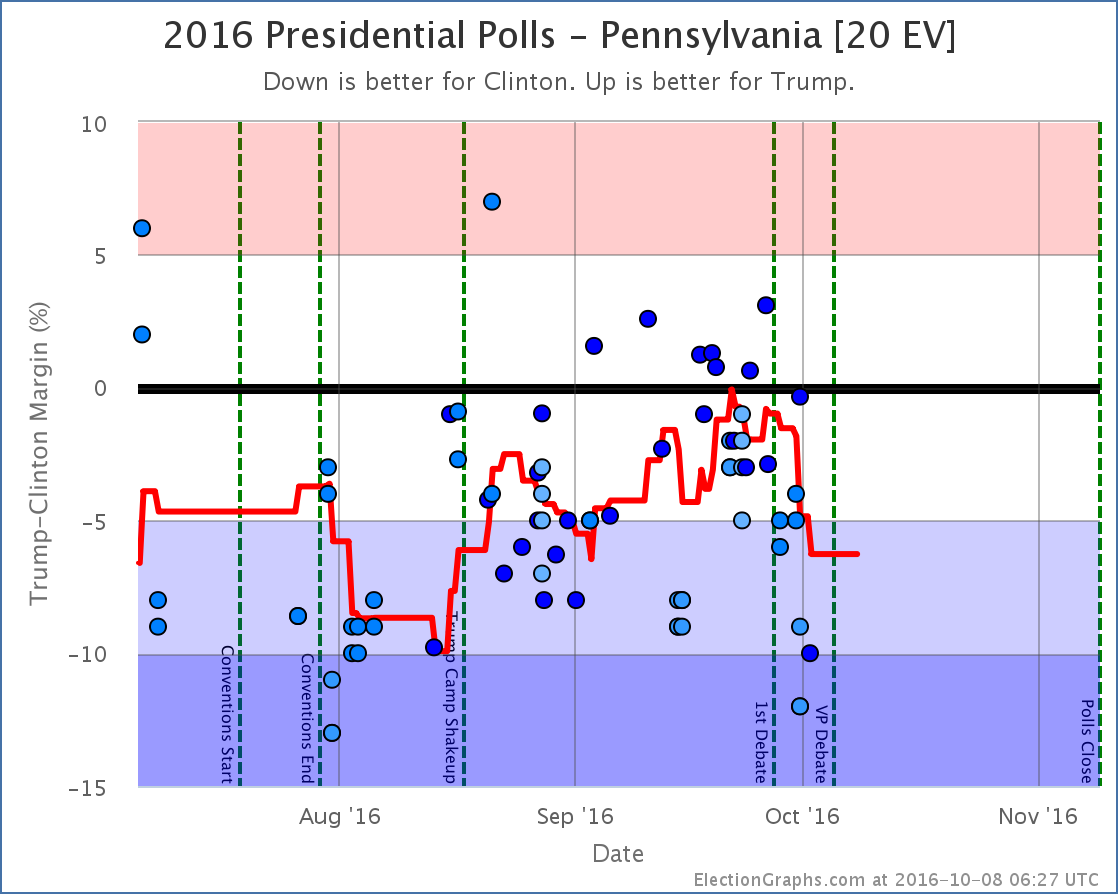
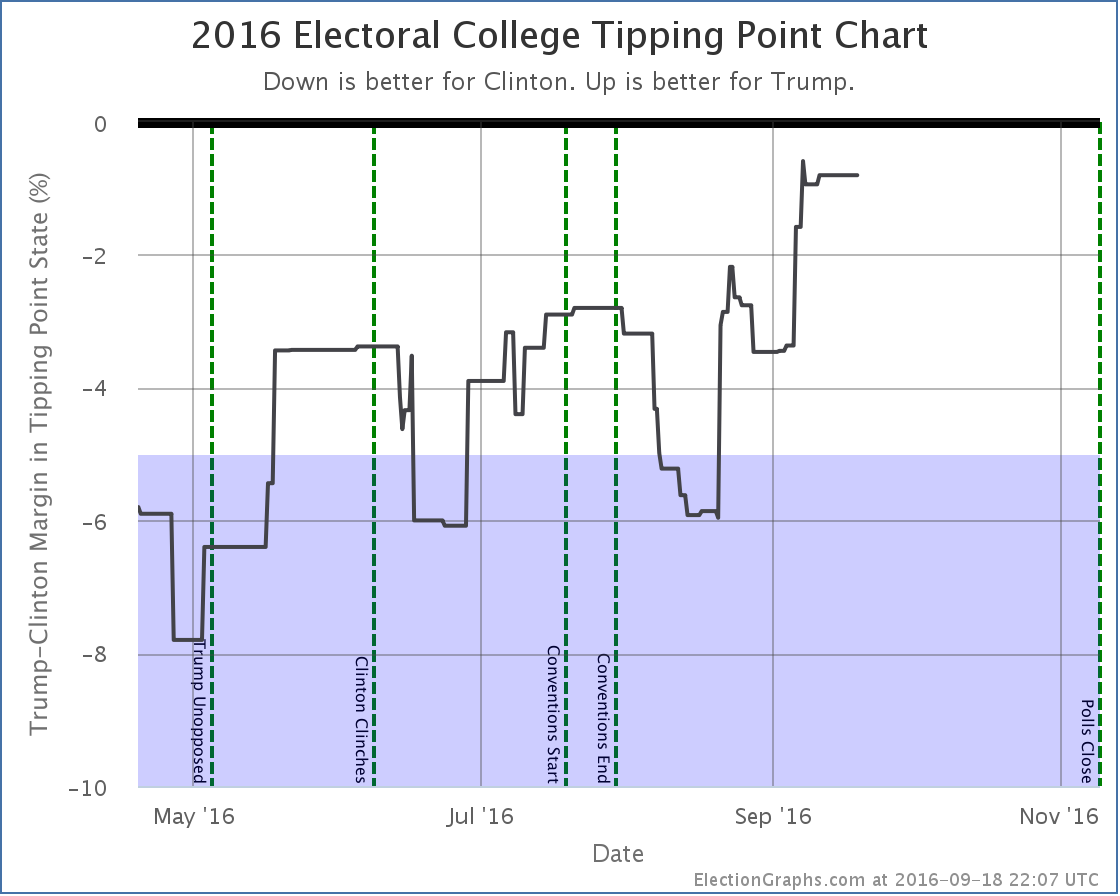
- The tipping point moves from Clinton by 1.8% in NC to Clinton by 1.6% in PA
Good for Clinton
- Trump’s best case has deteriorated from a 112 EV win to only a 66 EV win
No Change
- Clintons best case remains steady at a 210 EV win
Charts
Discussion
The fact that Trump’s best case is getting worse is pretty much irrelevant. Either candidate winning all the close states is a very low probability event. A few months out it is good to show how things might reasonably move. But on election day, the expected electoral college and the tipping point are the two numbers to watch.
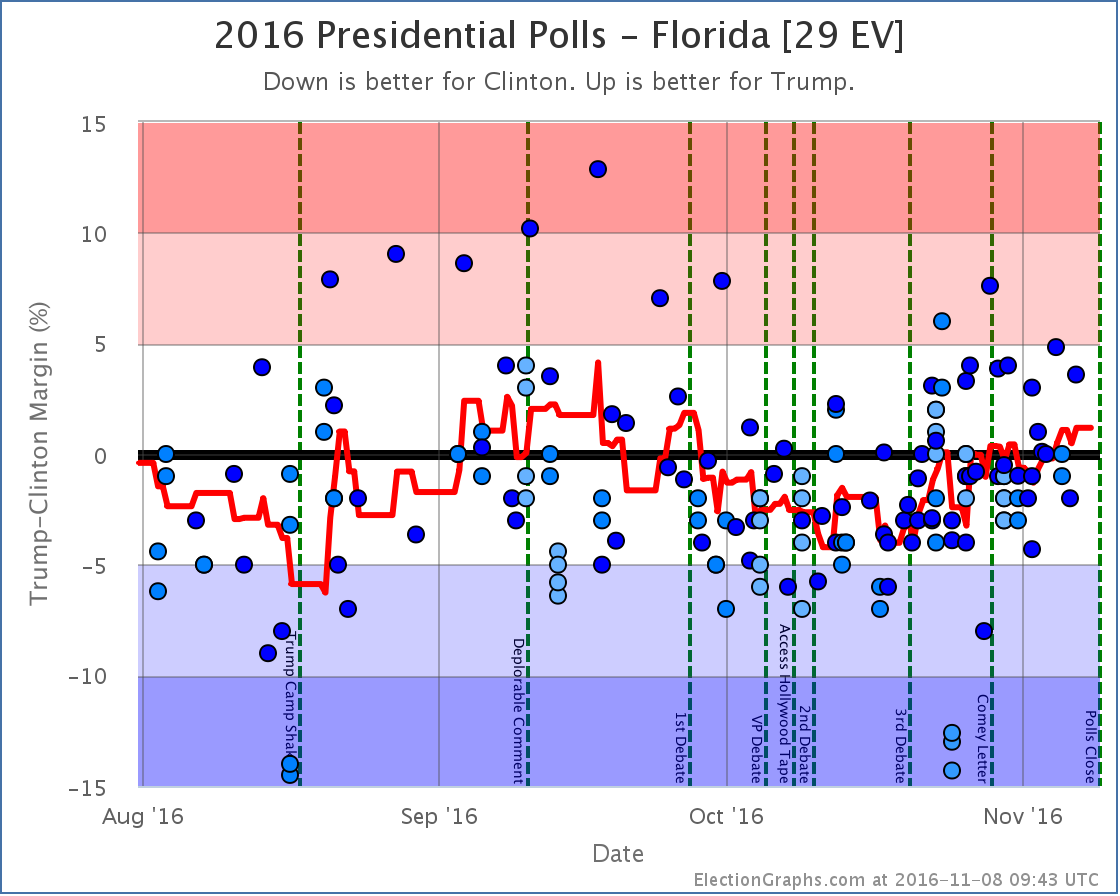
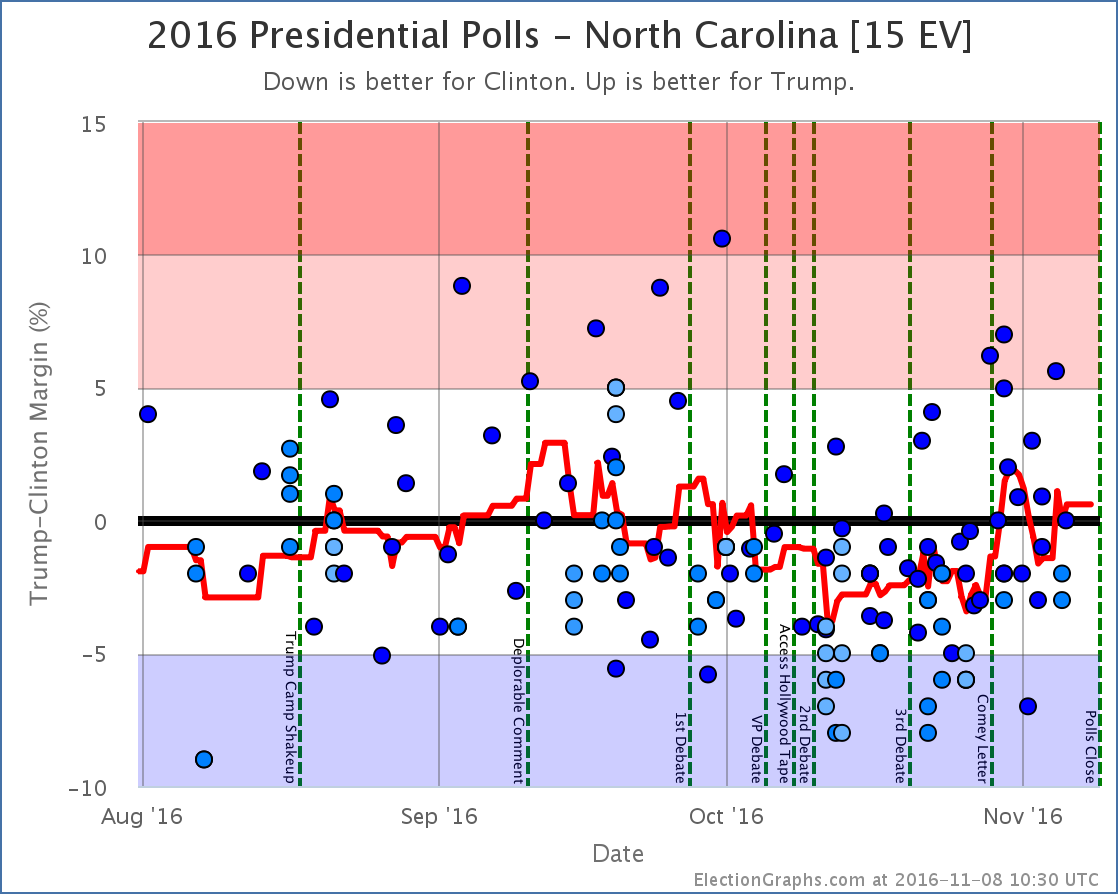
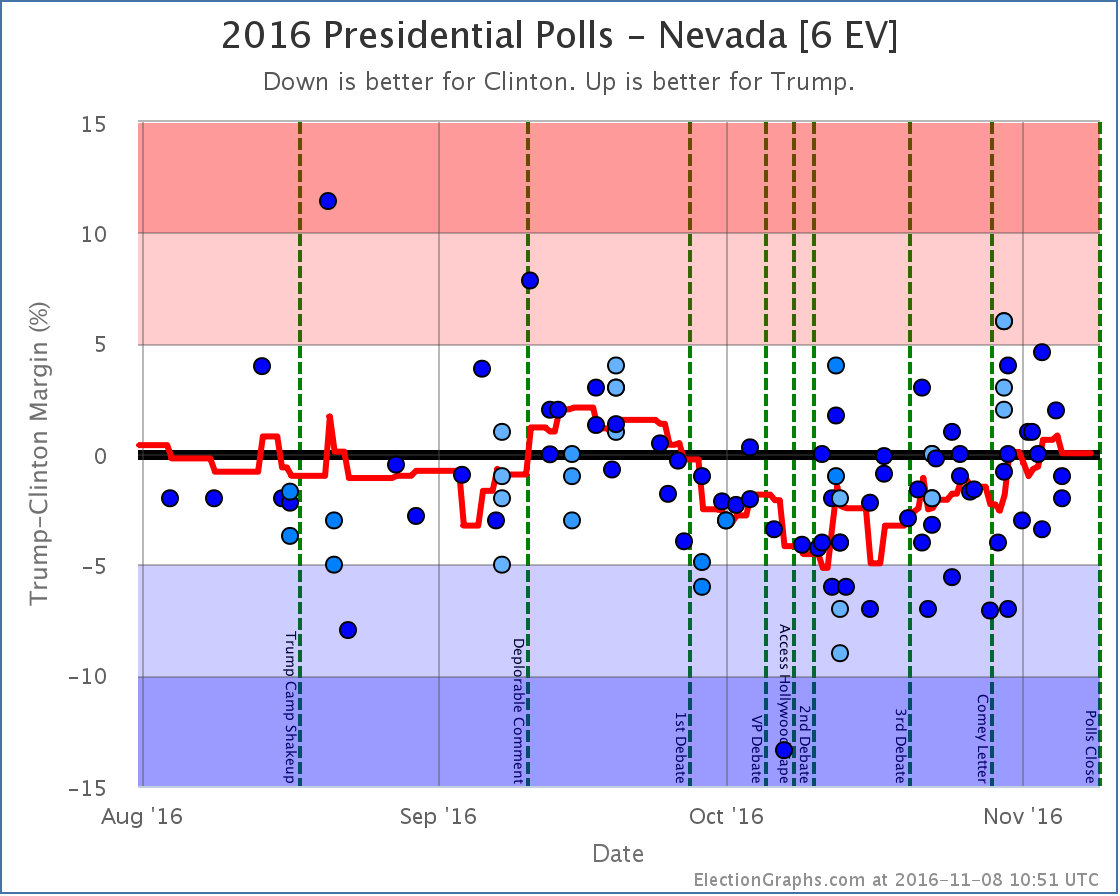
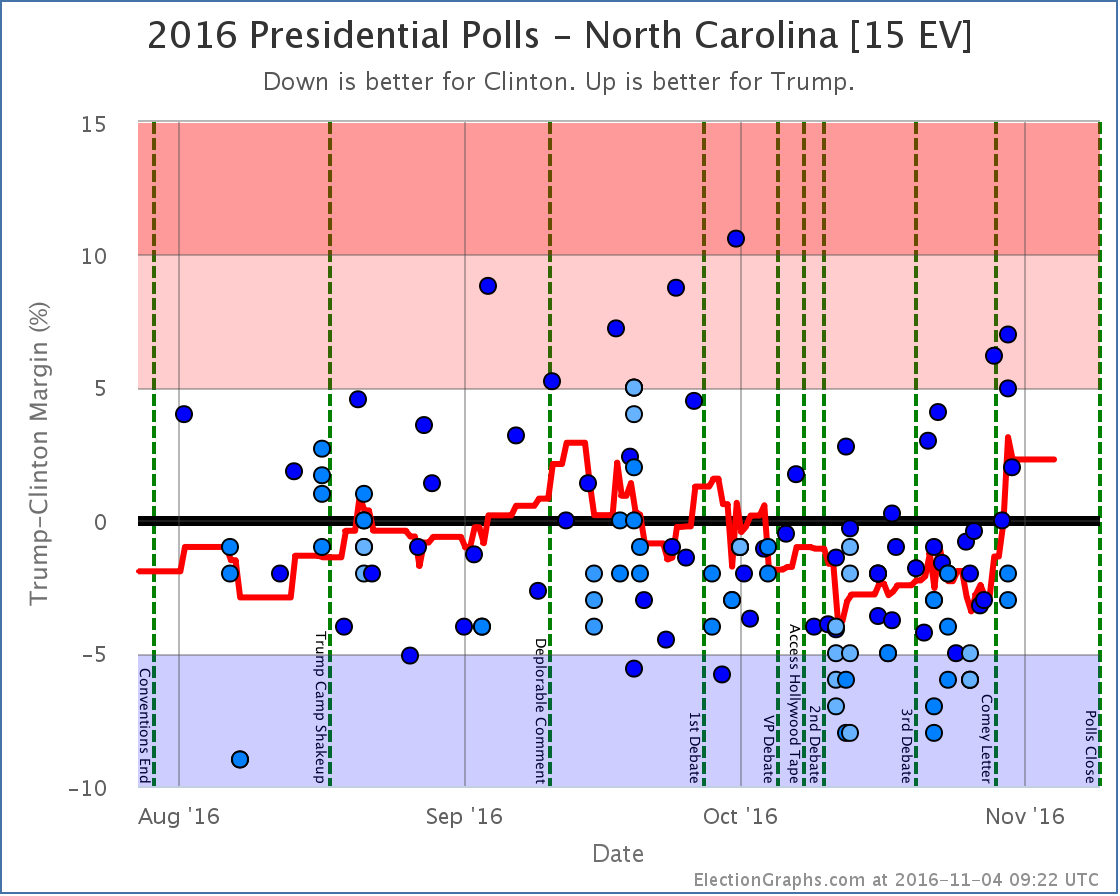
In the last update I speculated that because the tipping point and expected electoral college votes were going in different directions Trump may have topped out. But the movement toward Trump seemed to have a little bit of life in it yet. With the latest batch of update, the Election Graphs poll averages for Florida, North Carolina, and Nevada all move from just barely blue to just barely red. And the tipping point gets a bit narrower too.
Some have suggested there may a strategy to intentionally release Republican leaning polls at the last minute specifically to influence the poll averages, and the impact of some of these polls has been shown to be significant. This probably has something to do with the moves here too. But this site’s philosophy is to basically include all polls with very few exceptions, and when you throw everything in, this is the move you get. Given non-poll-related information on early vote results and such, I have my doubts about Florida and Nevada, but this site will stick to what the numbers say…
…and the numbers say that it is looking very close again. In the expected case Clinton wins by only 8 electoral votes. To flip the election, Trump only has to win Pennsylvania, and Clinton’s lead there is down to 1.6%.
The tipping point margin isn’t quite as small as it it was in September when it was down to 0.4%, but it is close enough that you could easily imagine a Trump win. Right?
Lets check the sites doing odds again for what they think the chances of a Trump win are…
The median estimate of Trump’s chances 2 days ago was 12%. Now it is 14%. So, slight increase, but not a huge one. And if you look at the individual estimates above, many actually went down since two days ago. But if everything is closer, why?
Well, each of the models of course have their own methods, and the movements in each would have a different explanation. Some of them discount or don’t include at all some of the pollsters showing the Trump movement that has moved my averages.
But just looking at the state of the race as a whole instead of specific models… Trump has never been ahead in the electoral college, by most measures he hasn’t ever led the popular vote either, and he’s also never led in Pennsylvania (or the other further off states he would have to flip to win).
So even taking the averages here at face value, and not doubting the status of Florida or Nevada, to win Trump would still need to break his September ceiling and do better than he has done at any time in this race so far. That is possible, but not likely.
Add to that the indications of high Hispanic turnout in several states, notably Florida and Nevada, and that some of the recent polls may be intentionally skewed… and it seems like if someone over performs their polls, it is more likely to be Clinton. But that is looking at things other than the polls themselves.
All and all, the new median of a 14% chance of a Trump upset seems about right.
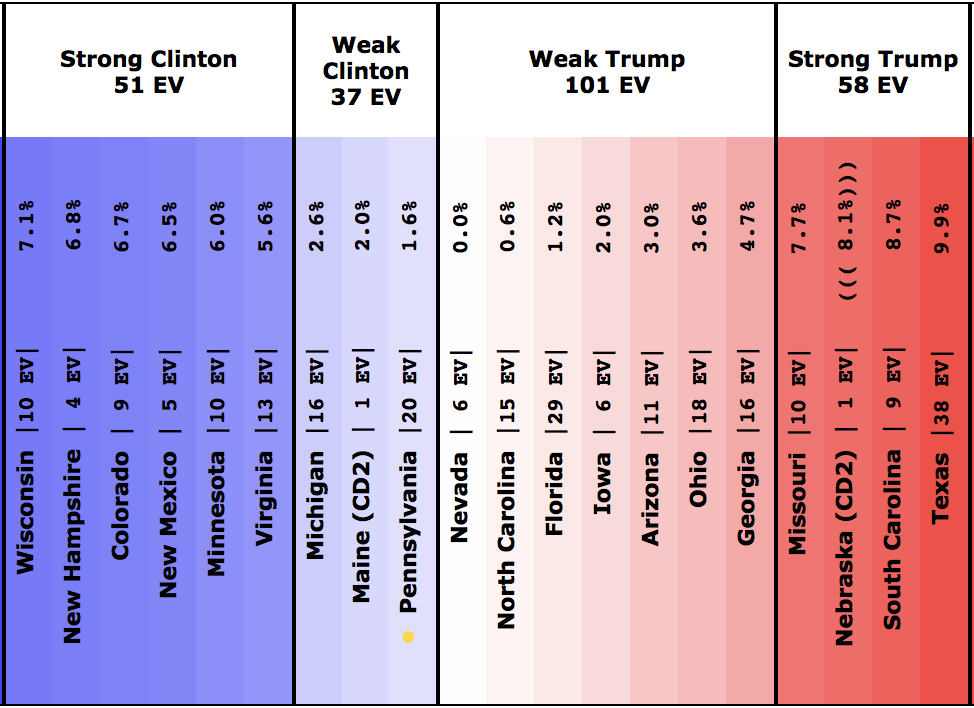
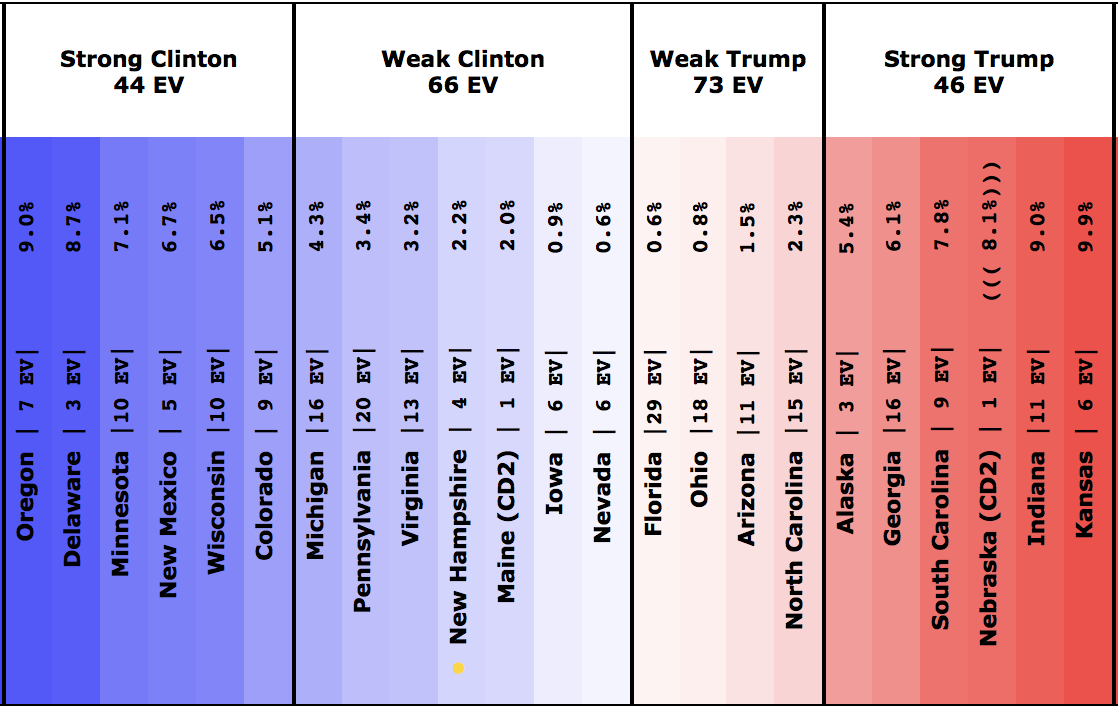
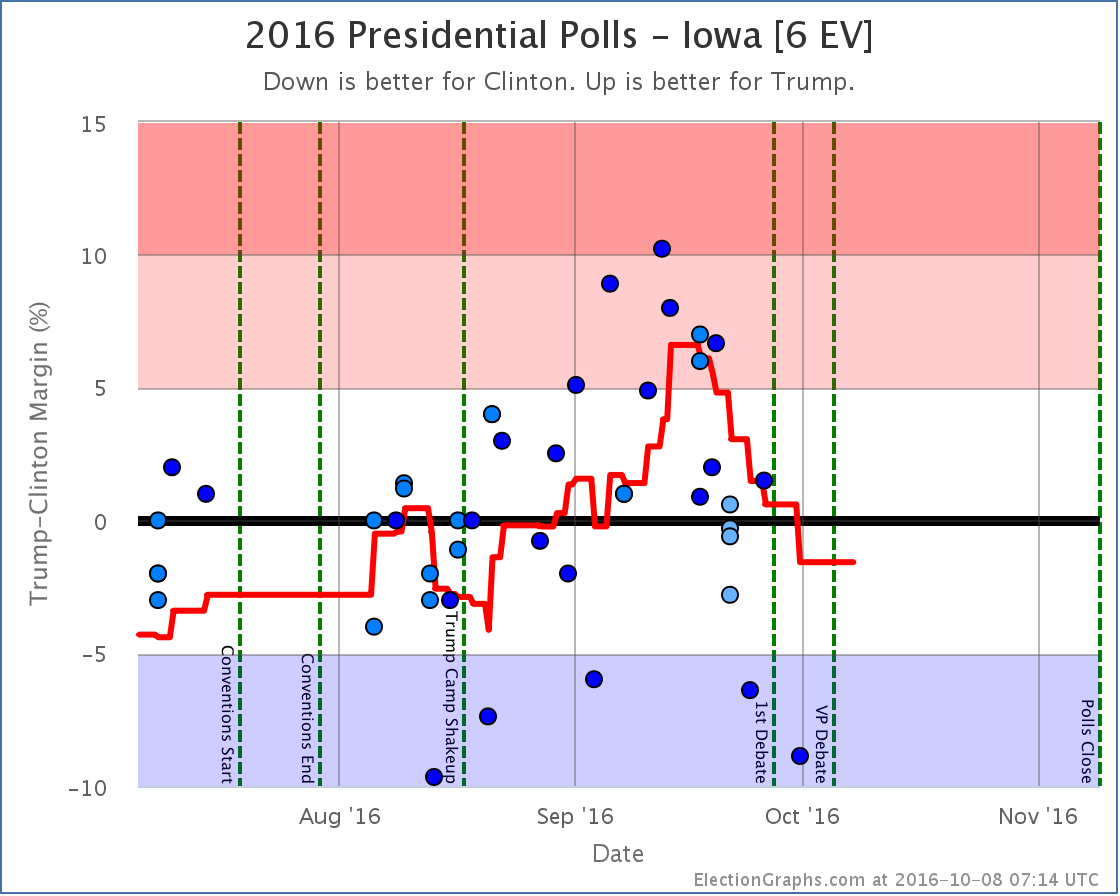
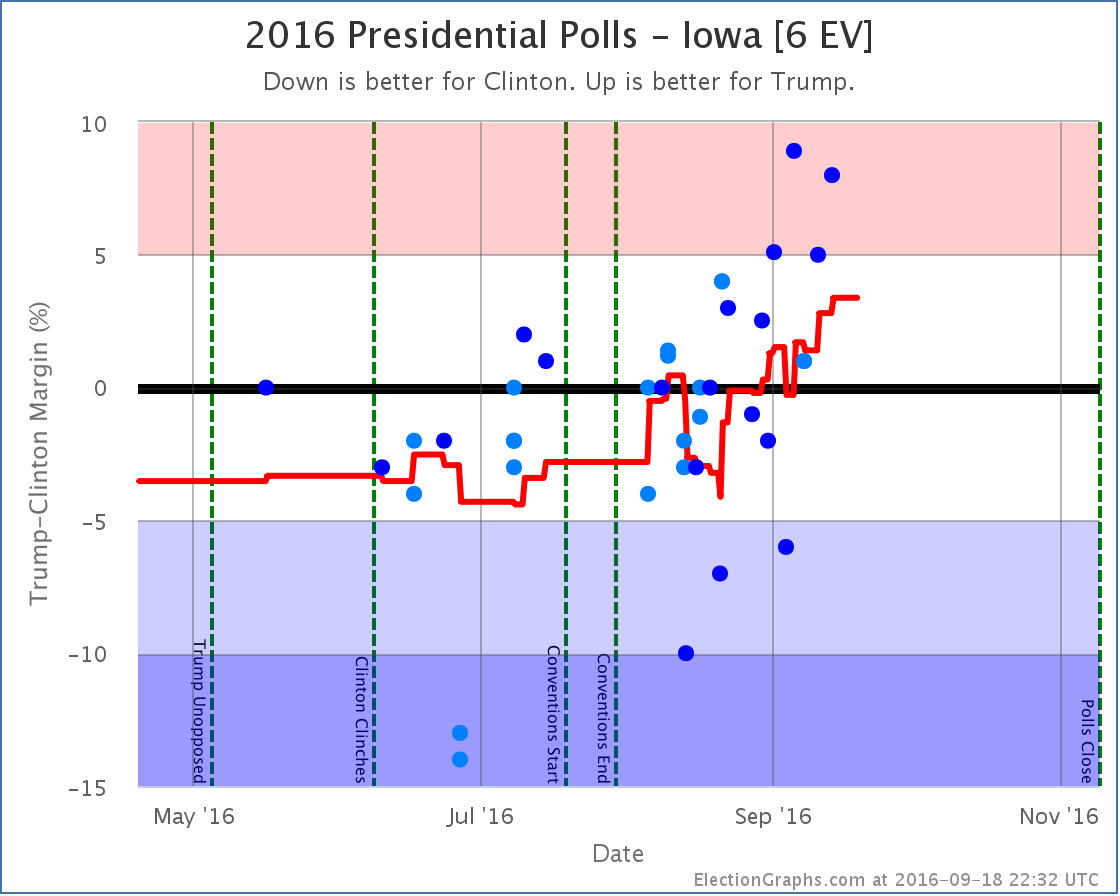
Maine CD2, Pennsylvania, Nevada, North Carolina, Florida, and Iowa are all within 2% at the moment. They could still go either way based on the current averages. That is enough to swing the election.
So, as has been the case for awhile, a Trump win would be surprising, but should not be shocking. Trump has a path.
We shall all see soon enough.
In New Hampshire we already have some results of course… Dixville Notch, Harts Location, and Millsfield have already reported results. The totals: Trump 32, Clinton 23, plus a handful of votes for others. So there you go.
For real meaningful results, we now have less than 8 hours until parts of Indiana and Kentucky close. Then less than 9 hours until the first full states close and the states start getting called one way or the other.
We are almost there.
State Details
The following are the detailed charts for all the states that influenced the national changes outlined above.
Moving from Clinton to Trump
No longer possible pickups for Trump
Also impacting the tipping point
A note about faithless electors
In the past few days there have been reports of first one, then two, expected electors from Washington state saying that that have decided to or are considering being “faithless electors” by voting for someone other than who they are “supposed to” when the Electoral College votes in December.
Yes, they can do that. In Washington state there would be a $1000 fine if they did, but they can do it, and it would count.
There was also one other potential elector from Georgia who suggested they would be faithless back in August. That potential elector came under extreme pressure and resigned, to be replaced by someone who would presumably vote the “right” way.
That might well happen to these two as well. But faithless electors can and do happen every few election cycles. In the last 50 years there were faithless electors in 2004, 2000, 1988, 1976, 1972, and 1968. That is 6 out of 12 elections during that period. Half. It would not be surprising if there were one or more faithless electors in 2016, especially given the contentious nature of the race. They have never made a difference in the final outcome.
The Election Graphs estimates show what the results “should be” given who wins various states. They do not take into account statements by individual electors on their intentions. If a scenario arises where it is close enough for electors who have made statements like this to potentially make a difference in the outcome or throw the race to the House, we will of course make note of that. And once electors vote in December, we will show the final tallies, including any votes cast by faithless electors.
A note about McMullin
Right now the Real Clear Politics average in Utah has McMullin 12.4% behind the lead. The 538 average in Utah has him 9.4% behind the lead. Although McMullin was a lot closer than anyone expected, he never got closer than 5% to the lead in Utah in these averages and now appears to be fading. 538 still has him in second place, but it doesn’t seem likely at this point that he will win electoral votes.
For more information…
This post is an update based on the data on ElectionGraphs.com. Election Graphs tracks a state poll based estimate of the Electoral College. All of the charts and graphs seen in this post are from that site. Additional graphs, charts and raw data can be found there. Follow @ElectionGraphs on Twitter or like Election Graphs on Facebook to see announcements of updates or to join the conversation. For those interested in individual general election poll updates, follow @ElecCollPolls on Twitter for all the polls as they are added. If you find the information in these posts interesting or useful, please consider visiting the tip jar.
States with new poll data added since the last update: All 50 states, DC, the Maine congressional districts, and the 2nd congressional district in Nebraska.
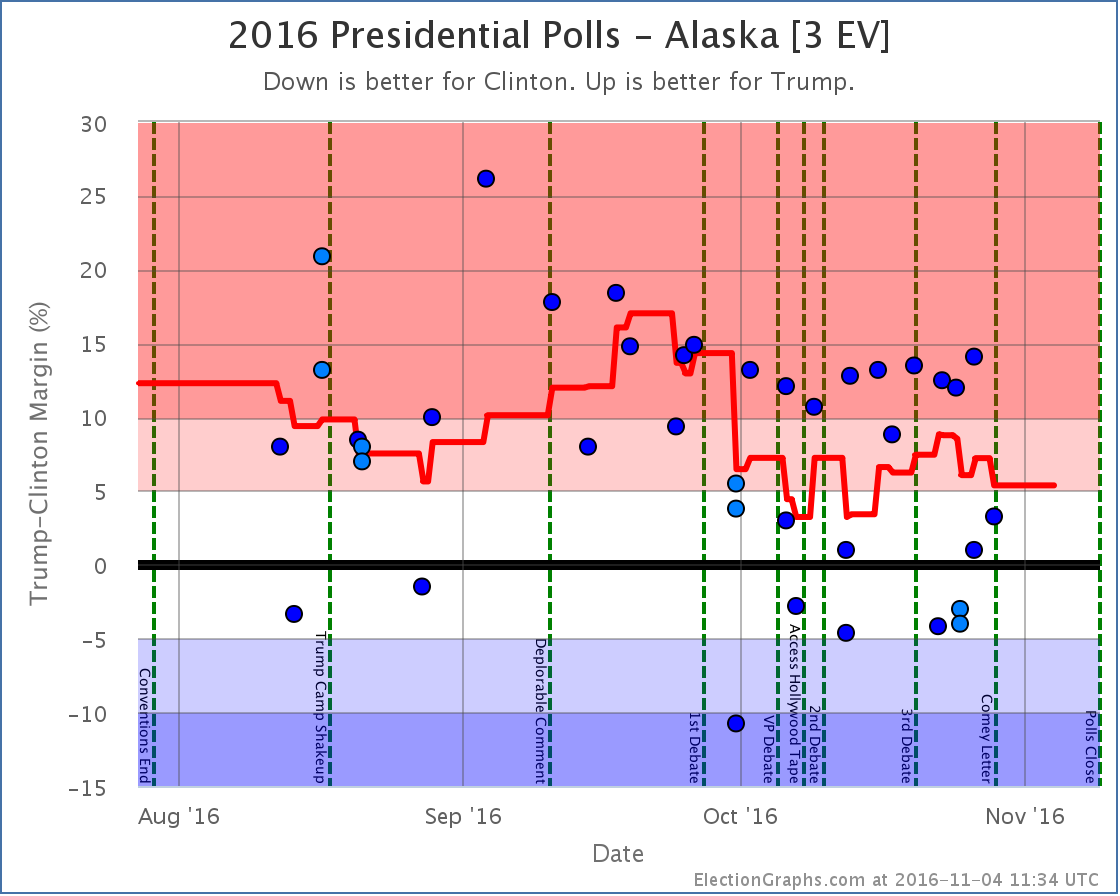
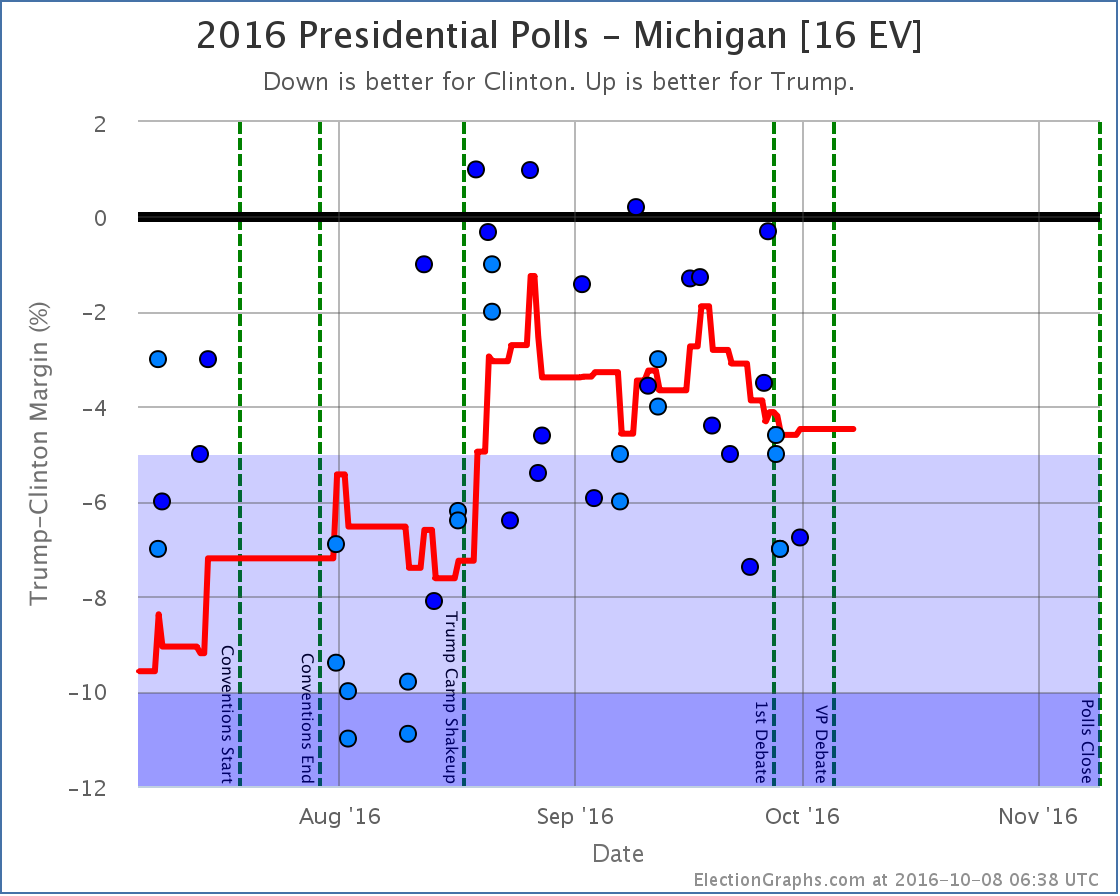
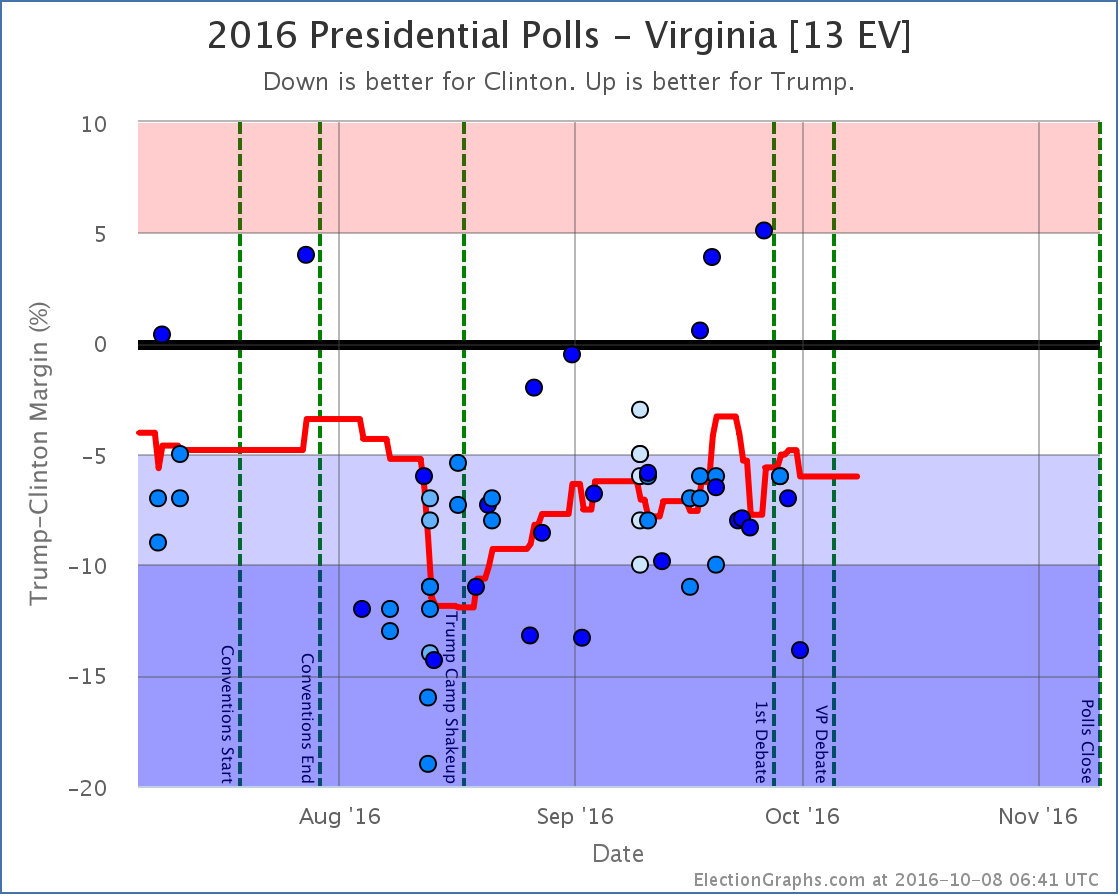
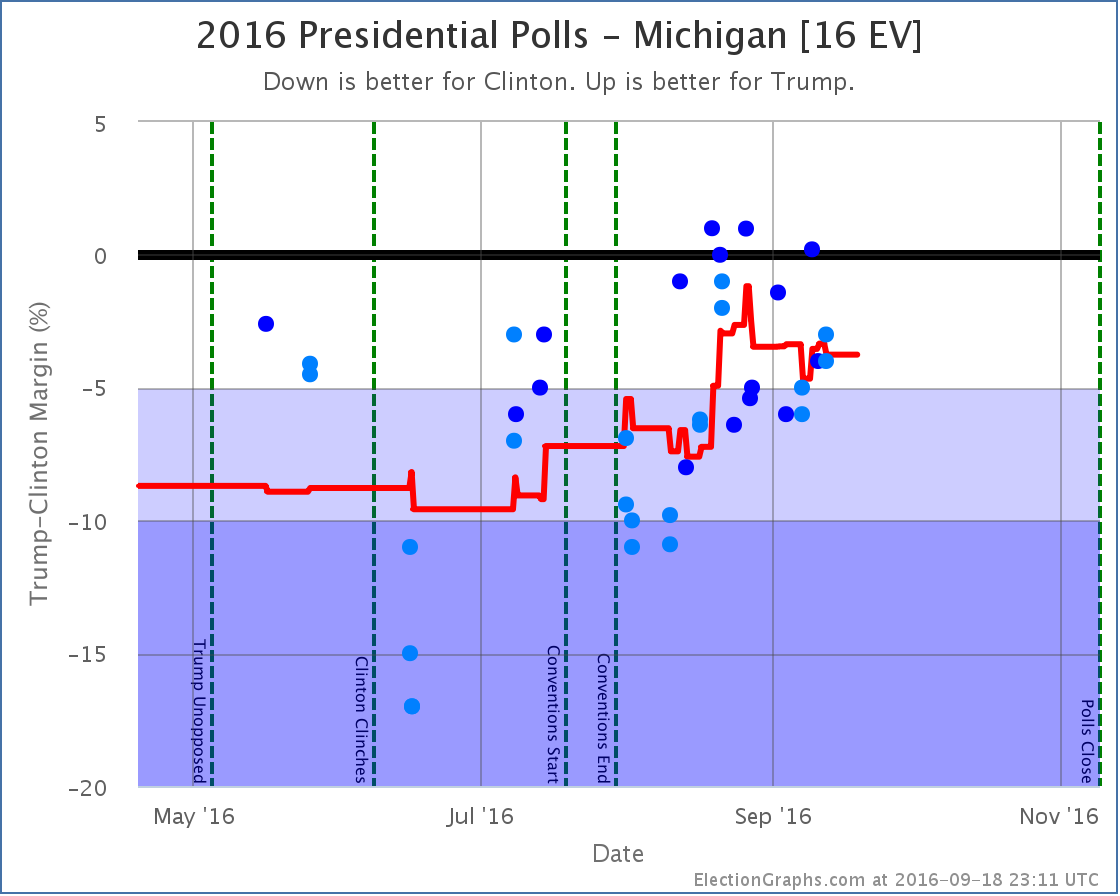
Notable changes in: Pennsylvania (20), Georgia (16), Michigan (16), North Carolina (15), Virginia (13), New Hampshire (4), Alaska (3), and the tipping point.
With the current pace of polling, there are already a number of new polls out since the line was cut for this update. They will of course be included in the next update.
National Summary
It has been about four days since the last update. Since then the movement has all been towards Trump. Some of this has been movement from polls taken primarily after the Comey letter, but a some of it also represents movement that was already happening when that news broke.
Good for Trump:
- The expected result has moved from a 62 EV Clinton win to only a 32 EV Clinton win
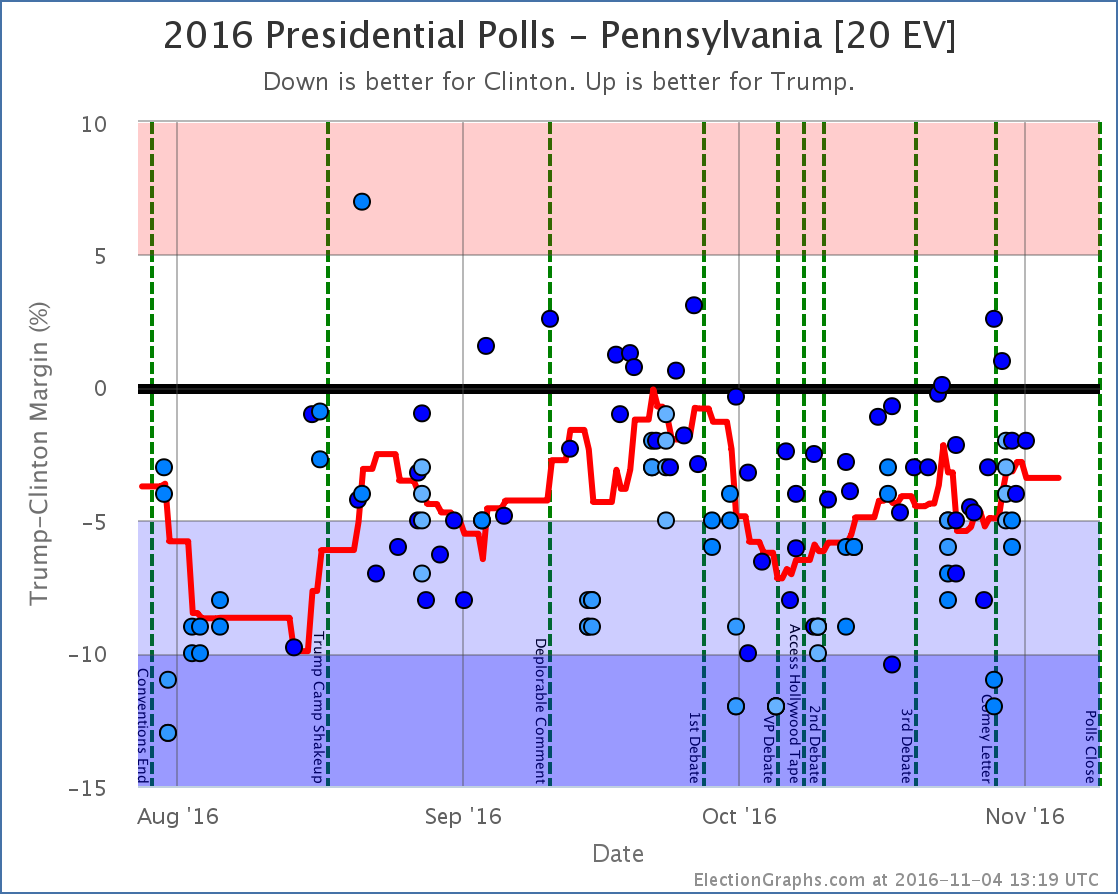
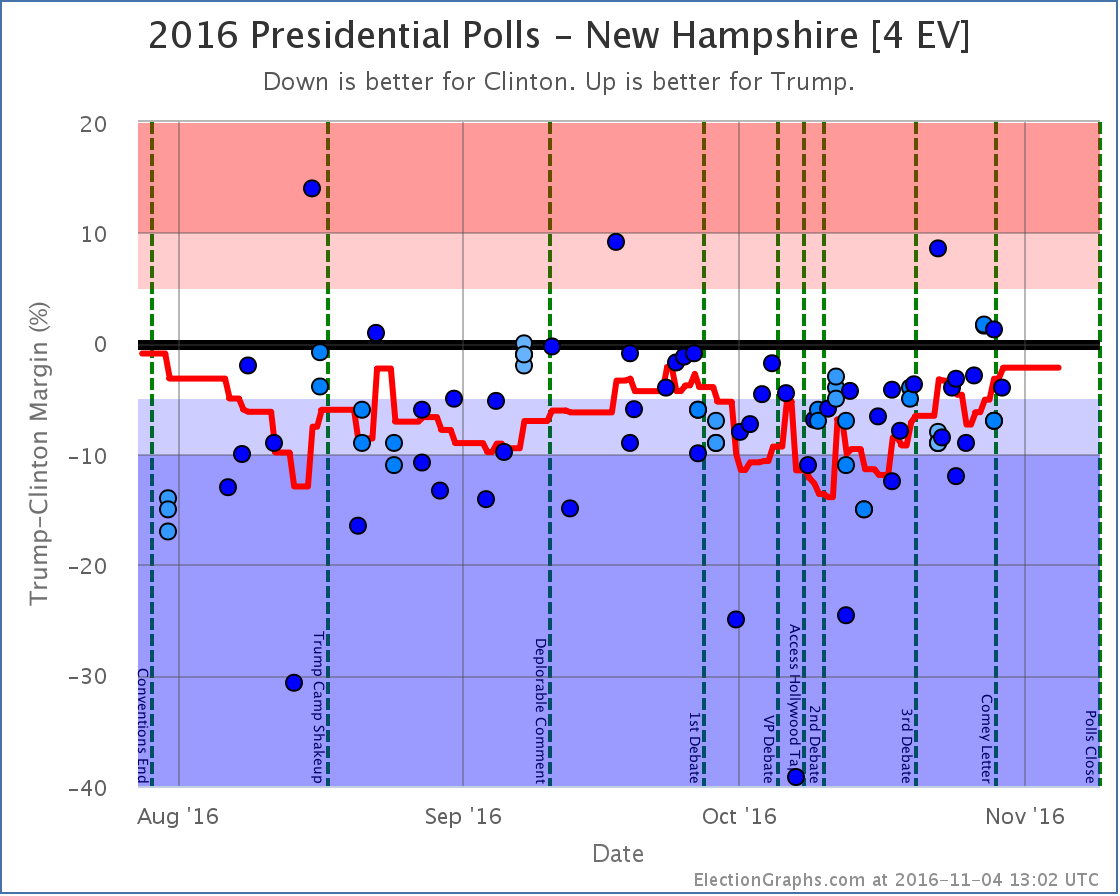
- The tipping point has moved from Clinton by 5.3% in PA to Clinton by only 2.2% in NH
- Clinton’s best case has declined from a 216 EV win to only a 178 EV win
- Trump’s best case has shifted from a 6 EV loss to a 100 EV win
Charts

Discussion
Four days ago Trump had tightened the expected electoral college case, but critical states like Pennsylvania were moving against him, so the job of getting to 270 electoral votes was actually getting harder despite the electoral college gap narrowing.
Not so any more. In the last few days, which added lots of post-Comey polls (as well as some covering the pre-Comey period too) the movement has ALL been toward Trump. There is no mixed message this time. No bright side for Clinton. In the last few days almost all of the polling news has been good for Trump and bad for Clinton.
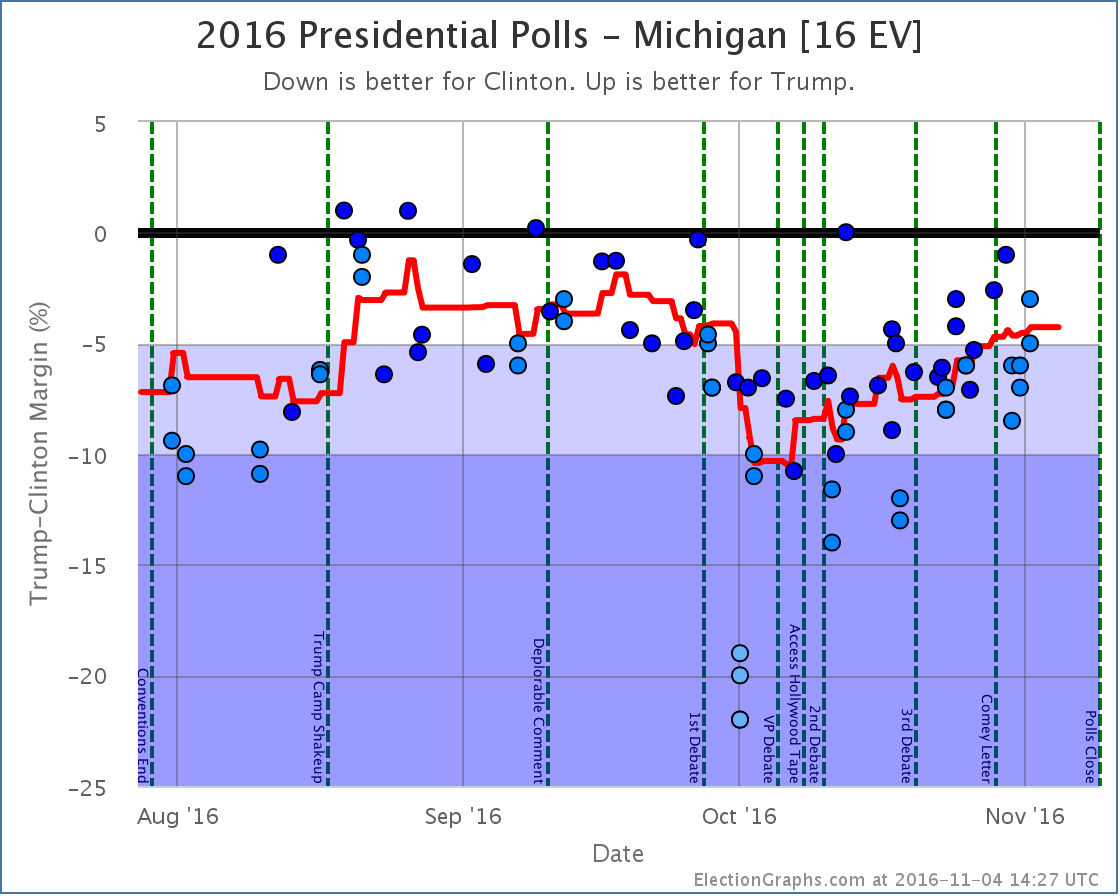
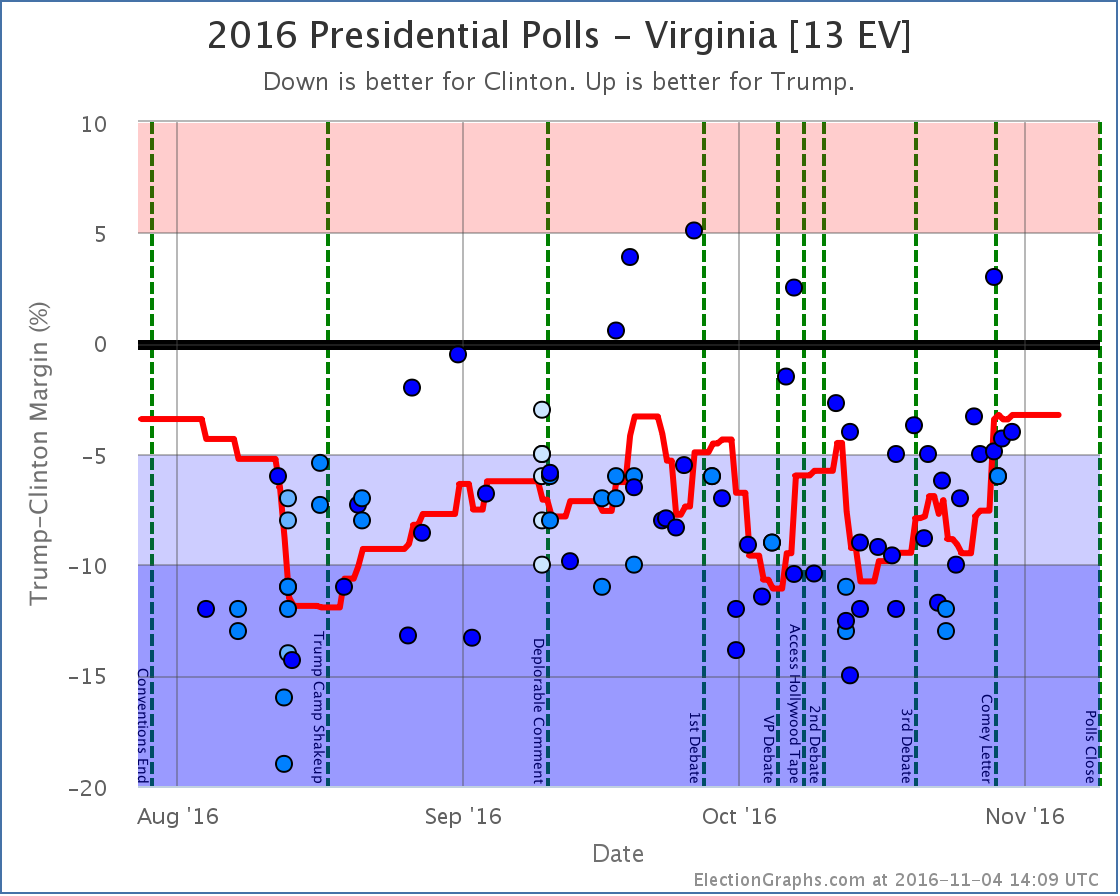
Now, she is still ahead. But Trump once again has a path. The “easiest” path at this point would be to win all the states he is currently leading, then pull in Nevada (0.6% Clinton lead), Iowa (0.9% Clinton lead) and New Hampshire (2.2% Clinton lead). Or he could get any one of those states, plus Virginia (3.2% Clinton lead). Or just Pennsylvania (3.4% Clinton lead). Or just Michigan (4.3% Clinton lead).
All of these states are ones where a few days ago Clinton’s lead was much stronger. Trump has been making gains all over the map.
How much of this is Comey? Some for sure, but as I’ve pointed out before, the expected electoral college been moving slowly toward Trump for weeks. But that did seem to have somewhat stalled out. The tipping point was moving back toward Clinton. With the Comey letter the move toward Trump came back with a vengeance.
We’re not quite at Trump’s highs from September, but we are getting near there. Now, even at his best point in September, Trump was still losing to Clinton. But it was close. And it is close again now. The Trump surge is real, and he has made this a race again.
The tipping point is at 2.2%. That is within the zone where a systematic polling error or a last minute news event that happens too late to be captured in polls could reverse the result. A Trump win COULD happen. This is not impossible.
Clinton is still heavily favored though.
This site does not produce “odds”, just the range of “you shouldn’t be completely shocked” outcomes, which is intentionally pretty wide. Right now, a Clinton win is expected, but a Trump win is not out of the question.
Lots of places do produce odds though. Here is the current rundown in terms of percentage chance of Trump winning:
I was asked on Twitter yesterday for my odds. Given that my model does not produce a number for this, I was reluctant to give an exact number. But I gave a range and said between 5% and 10%. With a few additional polls added since then, I’d go toward the higher end of that range. Maybe 7% to 10%.
Why that range?
Trump is getting very close to Clinton, but in all the prior polling movement in the campaign Trump has never been able to actually pull into the lead. It seems like he reaches a ceiling and gets to the point where to gain any further he has to not just convince the wishy-washy undecideds, but he has to start getting actual Clinton supporters to flip, which seems like a much harder job.
But until September I thought Trump’s ceiling was matching Romney’s performance in 2012. With current polling, Trump wins every state Romney won, then adds Florida and Ohio. So levels that look like ceilings can indeed be broken. Another bad news cycle for Clinton, or even some systematic error in the polling could easily put us there.
So 7% to 10% seems reasonable.
If a Trump win does happen, surprise is warranted, because he would have beaten the odds, but not shock, because he IS close.
If Trump was a hurricane that was four days out, we would be “within the cone”. Toward the edge of the cone to be sure. We are not directly on the projected path. We expect it to miss us. But we would be making preparations just in case the storm swerves and hits us.
4.3 days until we stop looking at polls and start looking at actual election results.
State Details
The following are the detailed charts for all the states that influenced the national changes outlined above.
Moving from Clinton to Trump
Moving into reach for Trump
Moving out of Clinton’s reach
Other states that helped move the tipping point
A note about McMullin
Election Graphs is designed around showing the Republican – Democrat margin, and there is not enough time before the election to revamp the site to properly account for 3rd parties that are strong enough to have a shot at winning electoral votes.
Right now the Real Clear Politics average in Utah has McMullin 12.0% behind the lead. The 538 average in Utah has him 10.3% behind the lead. Although McMullin was a lot closer than anyone expected, he never got closer than 5% to the lead in Utah in these averages and now appears to be fading. 538 still has him in second place, but it doesn’t seem likely at this point that he will win electoral votes.
If that changes, I will of course note it in these updates and on the Election Graphs site.
For more information…
This post is an update based on the data on ElectionGraphs.com. Election Graphs tracks a state poll based estimate of the Electoral College. All of the charts and graphs seen in this post are from that site. Additional graphs, charts and raw data can be found there. Follow @ElectionGraphs on Twitter or like Election Graphs on Facebook to see announcements of updates or to join the conversation. For those interested in individual general election poll updates, follow @ElecCollPolls on Twitter for all the polls as they are added. If you find the information in these posts interesting or useful, please consider visiting the tip jar.
Edit 17:45 UTC to fix some wording in the hurricane comparison paragraph.
Edit 19:53 UTC to fix a Comey/Comet autocorrect.
States with new poll data added since the last update: All of them. Multiple times. There are additional new polls since I had to cut things off for this update as well. Those will be in the next update.
National Summary
The last week of polls has been devastating to Trump’s position. In the last update we were just starting to see the reaction from the first debate. With this batch the post-debate polling continued to roll in, and while there were a couple of minor moves toward Trump, the net change in this update was a dramatic move toward Clinton:
- The expected result moved from Clinton by 6 electoral votes to Clinton by 154 electoral votes
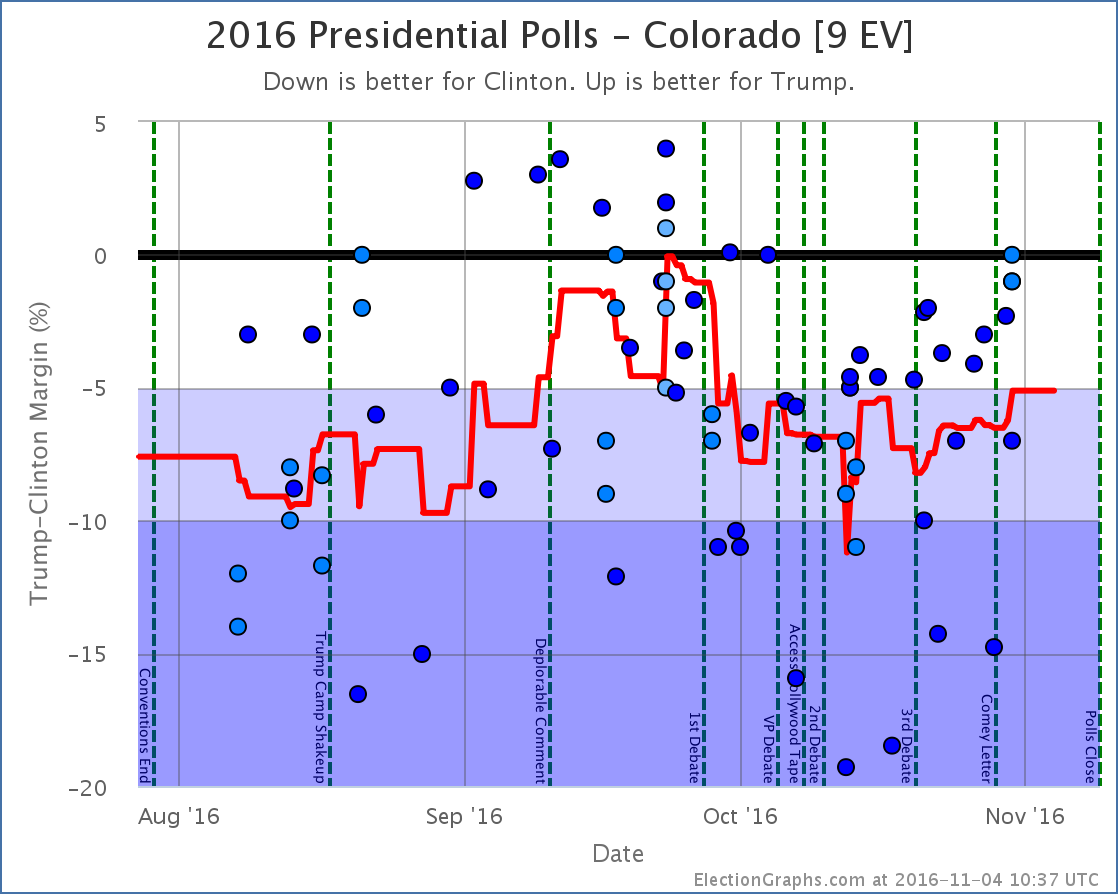
- The tipping point moved from Clinton by 2.1% in CO to Clinton by 4.5% in MI
- Trump’s best case moved from a 60 EV win to a 26 EV win
- Clinton’s best case moved from a 208 EV win to a 196 EV win
Looking at the charts:
The previous update mentioned some Trump losses starting a week or two before the debate. With a lot more polls filling in the time period right before the debate as well as right after, it now looks like those losses were reversed before the debate.
In the time after the debate though, all three indicators on the chart have moved in Clinton’s direction. The race is now essentially back to where it was at the beginning of September. We’re not yet back at Clinton’s high point from August, but it is getting close.
The tipping point chart is even more stark. As with the electoral college view, it looks like Trump’s mid-September declines were reversed by debate time, but after the debate everything falls off a cliff. Most of Trump’s gains from August and September are gone. Right before the debate he topped out with Clinton only ahead in the tipping point metric by 0.4%.
Clinton now leads by 4.5%. The tipping point state is Michigan. Clinton only has to increase her lead slightly there to not just take Michigan out of reach for Trump, but the Presidency.
What we are seeing in the polling results right now at this point probably fully factors in the debate itself. But we are just starting to see the impact from Trump’s “worst week in presidential campaign history ” that started with the debate, continued with his attacks on Alicia Machado, and ended with the leak of some of his tax information. The events of that week are not yet fully baked in.
And of course, the polls do not yet reflect the VP debate, or more importantly, the 2005 Trump video that was leaked on Friday. It is hard to imagine the events of the last few days NOT having an impact on the polls.
And the next debate is coming up. It should be interesting. If you were not planning on tuning in before, change your plans.
31.7 days left until the first actual election results start coming in.
State Details
A lot of states moved in order to produce the summary results above. For those interested in looking at the state by state details, they are below:
Weak Trump to Weak Clinton
Moving out of reach for Trump
Moving out of reach for Clinton
Moving into reach for Trump
States that changed categories but then moved right back again
For more information…
This post is an update based on the data on ElectionGraphs.com. Election Graphs tracks both a poll based estimate of the Electoral College and a numbers based look at the Delegate Races. All of the charts and graphs seen in this post are from that site. Additional graphs, charts and raw data can be found there. Follow @ElectionGraphs on Twitter or like Election Graphs on Facebook to see announcements of updates or to join the conversation. For those interested in individual general election poll updates, follow @ElecCollPolls on Twitter for all the polls as they are added. If you find the information in these posts interesting or useful, please consider visiting the tip jar.
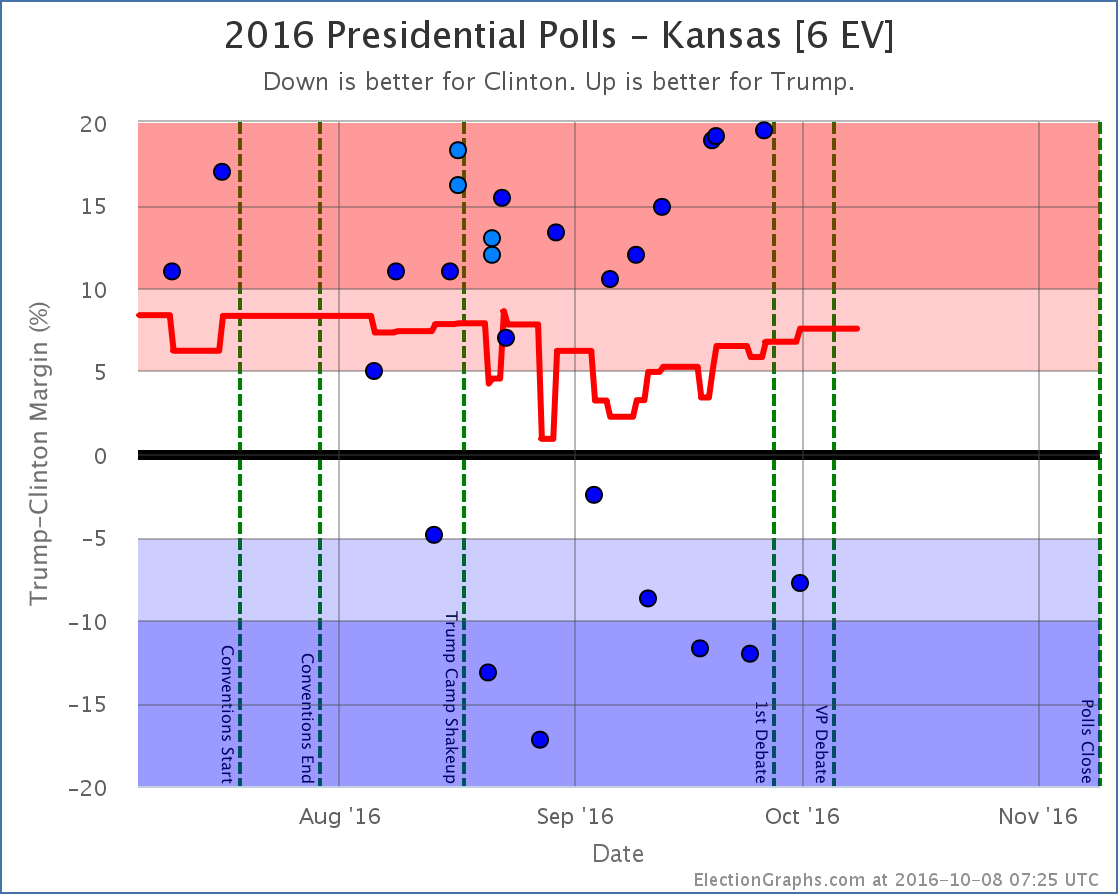
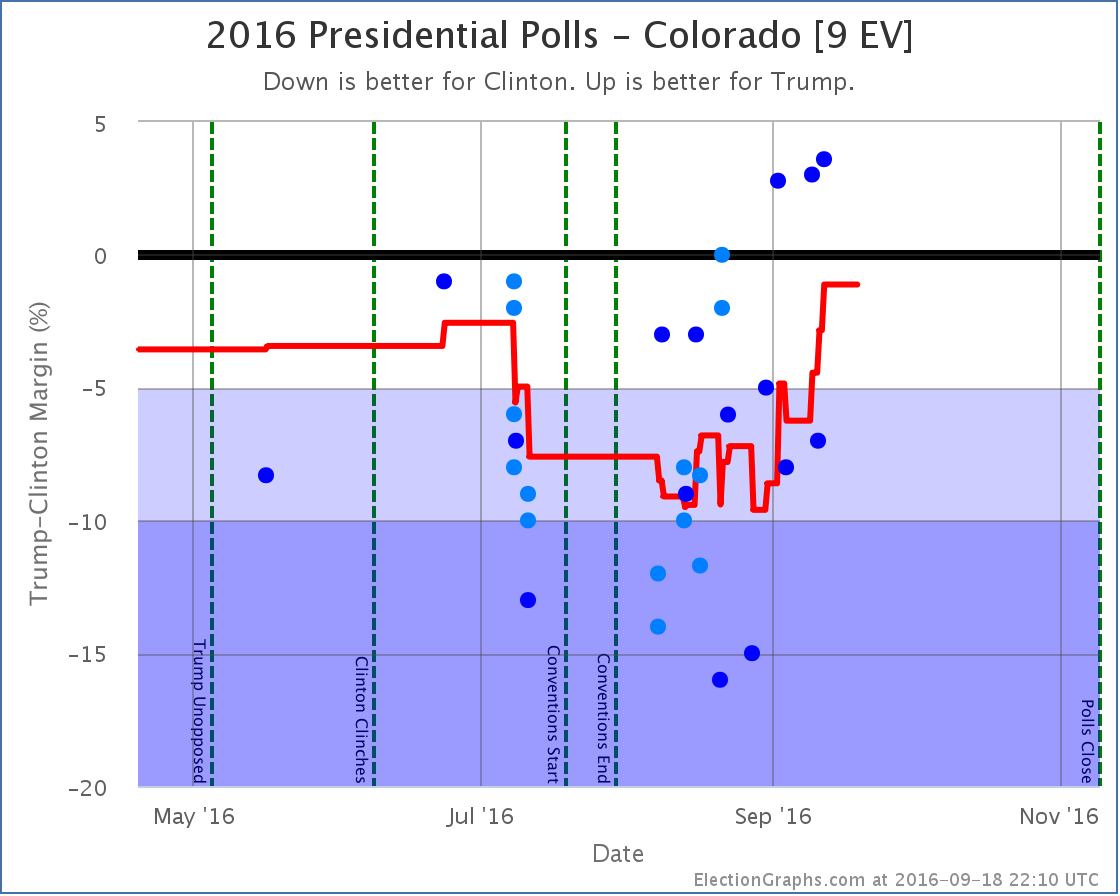
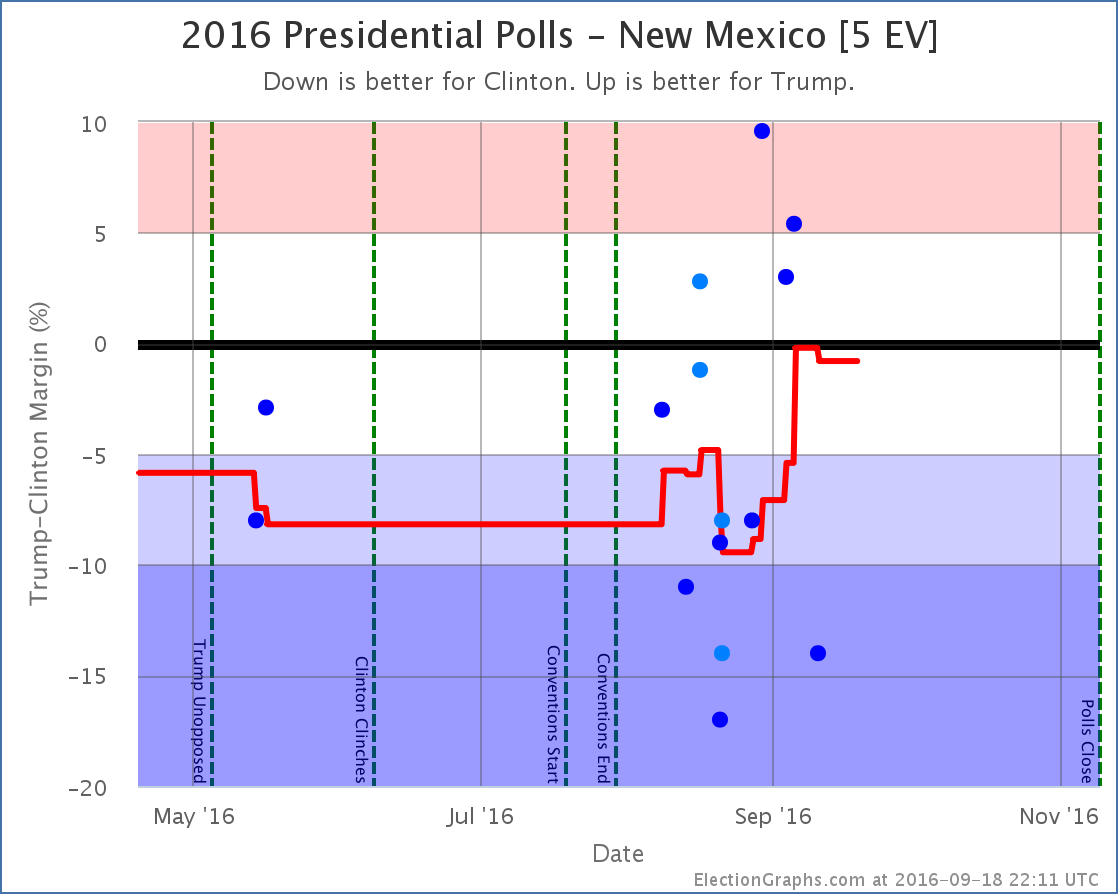
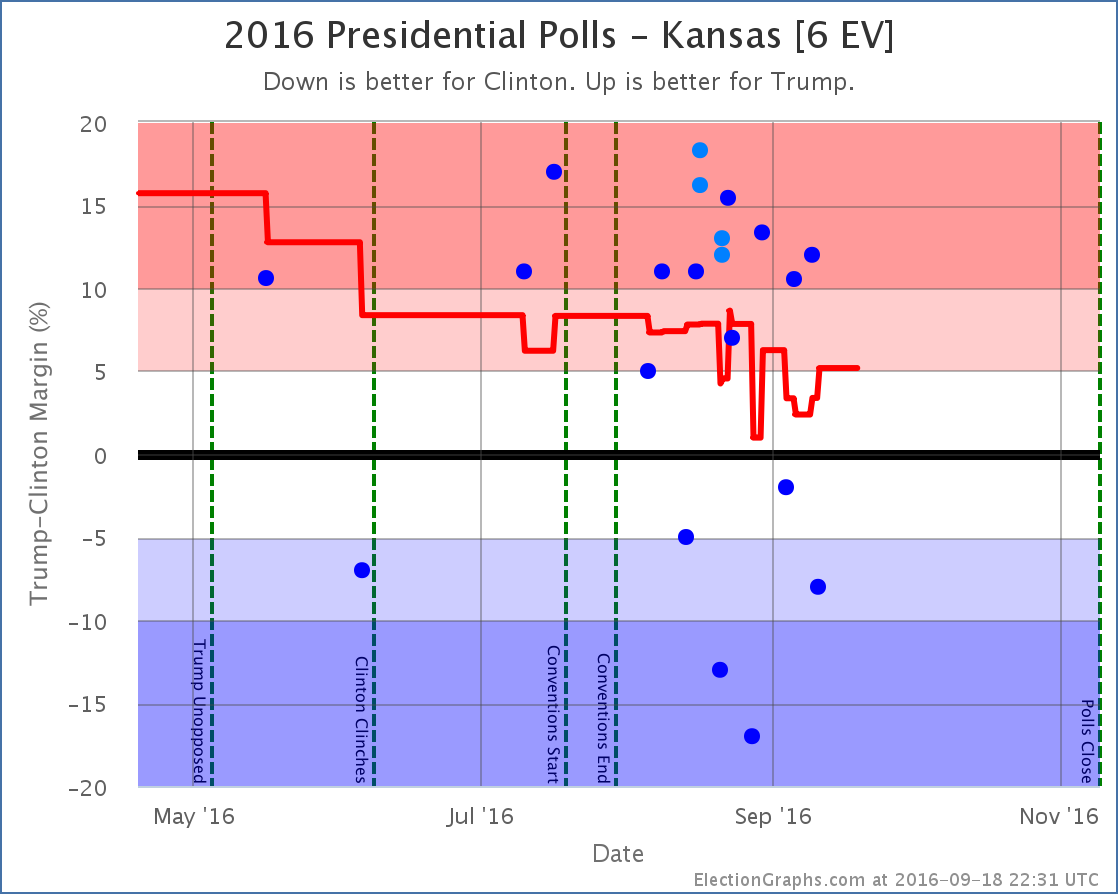
States with new poll data added since the last update: All 50 states, DC, and the Maine congressional districts. Notable changes in Colorado, New Mexico, Iowa, Nevada, Maine (CD2), Kansas, and the tipping point.
National Picture
Trump continues on the upswing, and at this point Clinton only leads by the very narrowest of margins. One more round of polls in his favor could easily put Trump in the lead for the first time this cycle.
With this update, we have the following changes:
- The expected case moves from Clinton by 32 EV to Clinton by only 6 EV
- The tipping point moves from Clinton by 3.4% in MI to Clinton by 0.8% in NM
- Trump’s best case improves from winning by 66 EV to winning by 94 EV
- Clinton’s best case drops from a 190 EV win to a 178 EV win
The full current summary:
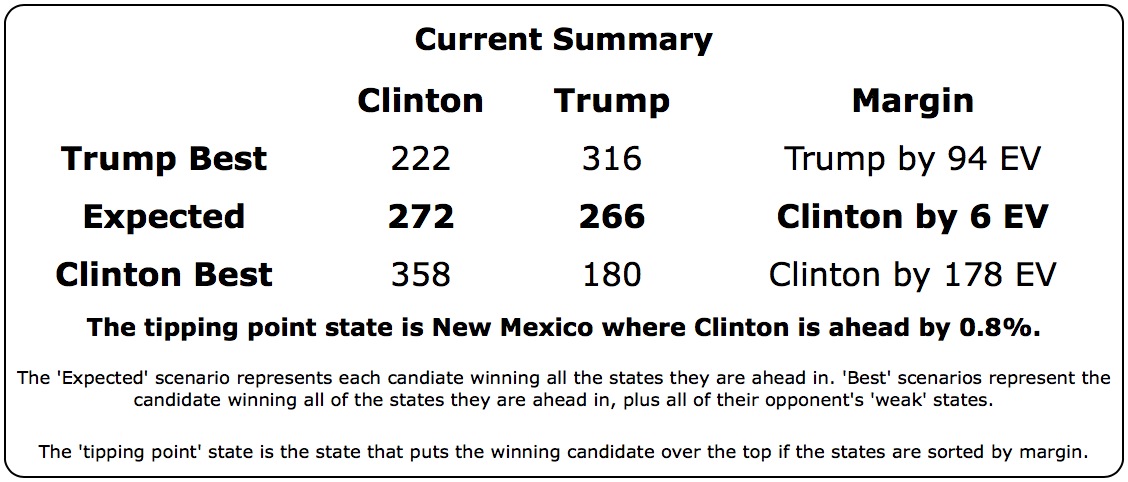
There is no denying this is now a razor thin race. This is close. If the election was held today, it could go either way.
Looking at the trends:
In both measures, Trump bottomed in mid-August and has been on a strong upswing ever since. Or is it that Clinton has been collapsing? In the end, the result is the same.
Trump is now far outside the “McCain to Romney” zone where he had been stuck. The question is if he is establishing a new normal, with many people permanently converted to his cause, or if this is an unsustainable high that will soon undergo reversion to the mean.
The race is not today. There are 51.0 days until we start getting the first real election results. A lot will happen between now and then. The first debate is now less than eight days away. Will it change anything? We shall see…
Individual States
I won’t provide individual commentary on all of these, but for those wanting to see the details on the states that changed the national summary this time around, here they are. Click through on any chart for the full detail page with individual polls listed.
Moving from Clinton to Trump:
Now close enough to be in play for Trump:
No longer close enough to be in play for Clinton
Another state whose movement influenced the tipping point
Note on “50 State” polls
Since Election Graphs tries to be as inclusive as possible with polls, we are including some “50 state” polls that some other folks have decided to exclude because of various methodological concerns. Others, like 538, include these polls, but give them very low weights in their models. Because Election Graphs tries to “keep it simple” we don’t do that kind of weighting. Everything just counts and we do a straight average.
Two of these “50 state” polls are now producing weekly results, Google Consumer Surveys and Reuters/Ipsos.
Honestly there are some crazy things in there. For instance:
- Google thinks Clinton is leading in Kansas, some weeks by a very large margin. No other pollster has seen this. Everybody else shows a significant Trump lead.
- Google thinks Trump is only 7% behind in DC. In DC? Really? In DC Obama beat Romney by 83.6% and McCain by 85.9%. The idea that Clinton is only 7% ahead of Trump in DC is pretty much ludicrous.
- The last few Ipsos polls have shown a Trump lead between 13% and 23% in Texas. The most favorable poll to Trump other than Ipsos has a 11% Trump lead, and most show it significantly narrower than that.
- In general it seems to be very common for these two polls to produce results which are outliers compared to other pollsters… Sometimes they show a result far more favorable to Clinton than anyone else, sometimes far more favorable to Trump than anyone else. The direction isn’t uniform, they just sometimes seem way off the mark.
- In many states the sample sizes are very low, and you see wide swings. For instance in West Virginia the Google poll moved from Trump +29% to Clinton +1% in one week! Yes, when you average them you get a 14% Trump lead, which is probably reasonable for West Virginia… but still!
- There are more examples, but you get the idea. In most states, these polls give roughly the results you would expect, in line with other recent polling, but occasionally, especially in smaller states, they seem to be clear outliers.
The craziness of some of these polls leads me to sometimes question my tenets of including everything and keeping it as close to a straight average as possible. But we’re sticking with that and we will see how it does.
And even with this the general notion of this site, that even with very simple assumptions you end up with similar results to what folks with complex models get seems to be holding up. Although the exact state by state results may differ slightly, every analysis I have read has the same general conclusion right now. The race is now much much closer than it was, although Clinton retains a narrow lead.
While these polls are a bit crazy, in the competitive states there are enough other polls so the average seems to be at least somewhat resilient when outliers like these pop up. And in the non-competitive states, well, these 50 state polls may be the only data in the average, so they may screw up the margins a bit, but in the end it doesn’t change the status of the state.
For more information…
This post is an update based on the data on ElectionGraphs.com. Election Graphs tracks both a poll based estimate of the Electoral College and a numbers based look at the Delegate Races. All of the charts and graphs seen in this post are from that site. Additional graphs, charts and raw data can be found there. Follow @ElectionGraphs on Twitter or like Election Graphs on Facebook to see announcements of updates or to join the conversation. For those interested in individual general election poll updates, follow @ElecCollPolls on Twitter for all the polls as they are added. If you find the information in these posts interesting or useful, please consider visiting the tip jar.
States with new poll data since the last update: Virginia, Nevada, Arizona
The polls keep coming, as they will straight through November. This time there is one change of note, reversing the movement in Nevada from a few days ago.
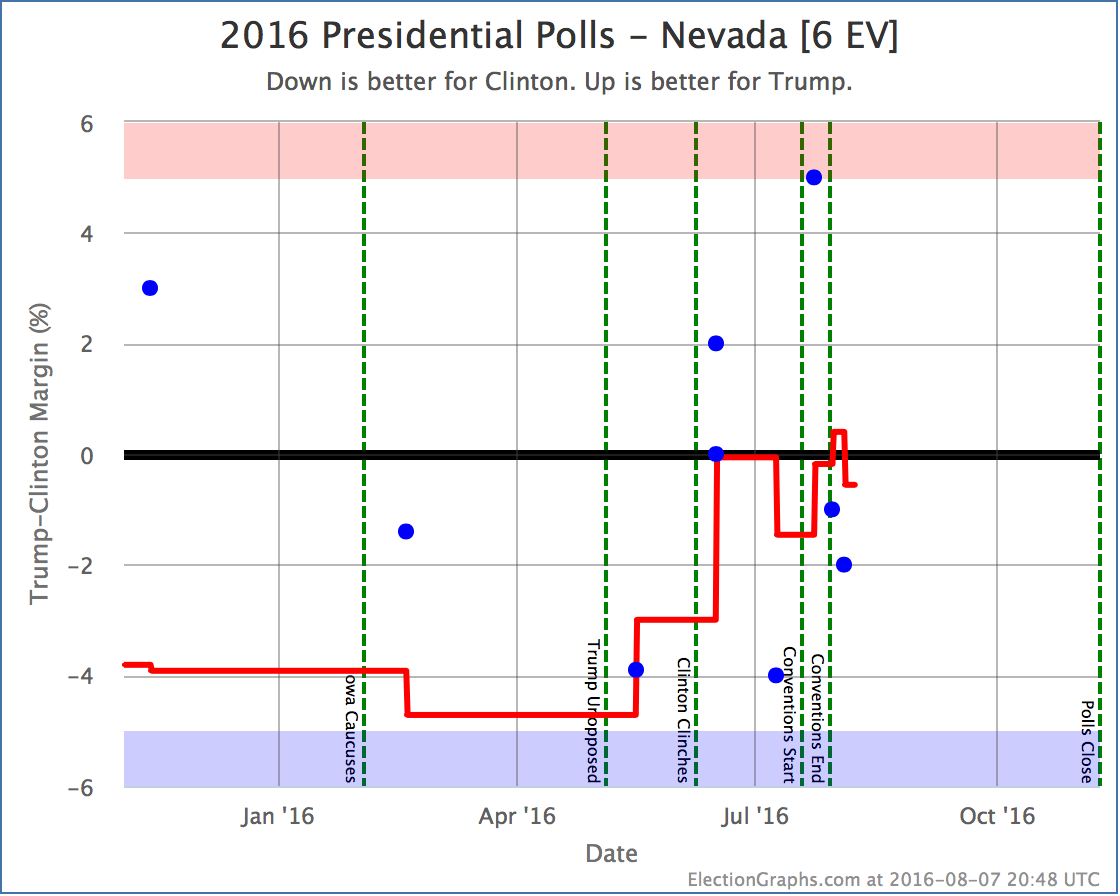
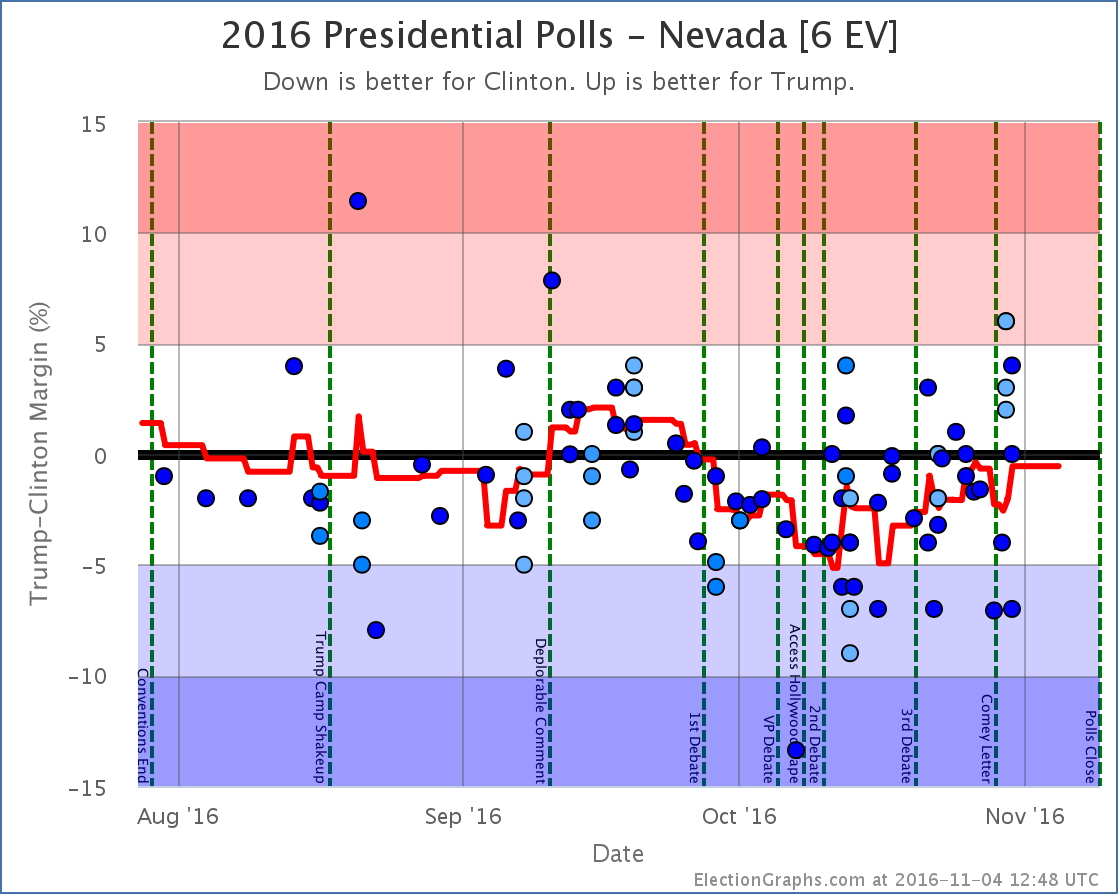
The polls making up the average still range from Clinton +4.0% to Trump +5.0%. There is wide variance here. The latest poll moves the average to Clinton +0.6%. So just on the Clinton side of the line again. In the end though, the best we can really say is that Nevada could easily go either way given current polling.
For the moment though, Nevada is back on the Clinton side of the center line.
This changes the “expected case” where everybody wins all the states where they lead the polls to Clinton 363 Trump 175, a 188 electoral vote margin for Clinton.
This is Clinton’s best showing in the expected case, tying a brief period in May. The other metrics are not at record levels at the moment, but this is the most important of the metrics tracked here… the actual expected outcome of the election.
The time since the conventions ended has been very good for Clinton. So far. We’ll see how long the trend continues. Clinton may well be near a ceiling here. At this point further gains for Clinton would be involve pulling in states like Arizona, Texas, or Utah. Those states are much closer that was once expected, but they may be very hard to pull in that last little bit.
Of course, even if this is a ceiling for Clinton, the ceiling is at a level where she wins decisively. If we actually see those states going blue, it may be time to start talking about a landslide after all. In the mean time though, if this was a normal campaign, the more realistic expectation would be to see things start drifting back toward Trump from here.
With how things are going though, who knows.
93.1 days until polls start to close on election day.
Note: This post is an update based on the data on ElectionGraphs.com. Election Graphs tracks both a poll based estimate of the Electoral College and a numbers based look at the Delegate Races. All of the charts and graphs seen in this post are from that site. Additional graphs, charts and raw data can be found there. Follow @ElectionGraphs on Twitter or like Election Graphs on Facebook to see announcements of updates or to join the conversation. For those interested in individual general election poll updates, follow @ElecCollPolls on Twitter for all the polls as they are added. If you find the information in these posts interesting or useful, please consider visiting the tip jar.
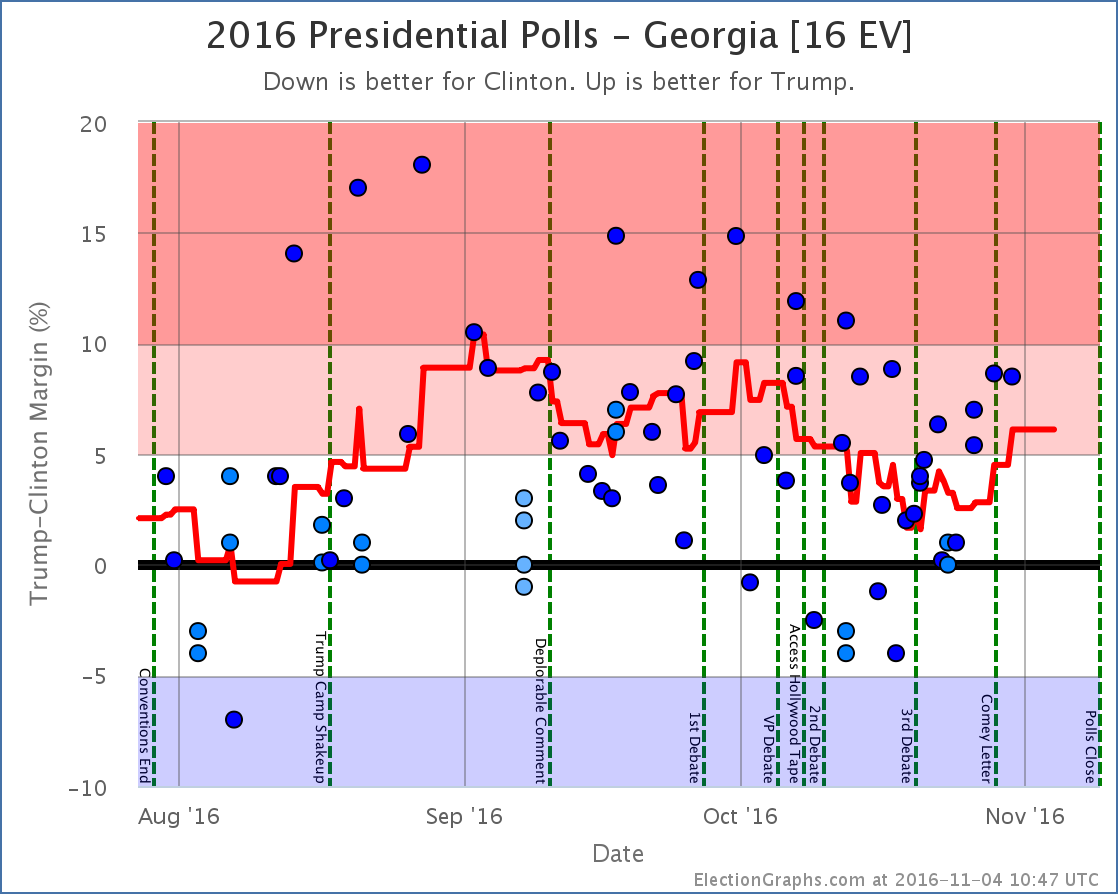
States with new poll data since the last update: Georgia, Pennsylvania, Nevada.
The post convention polls continue to come in, but the most recent batch brings mixed results. One state moving toward Clinton, another moving toward Trump. Lets look at them.
Pennsylvania [20 EV]
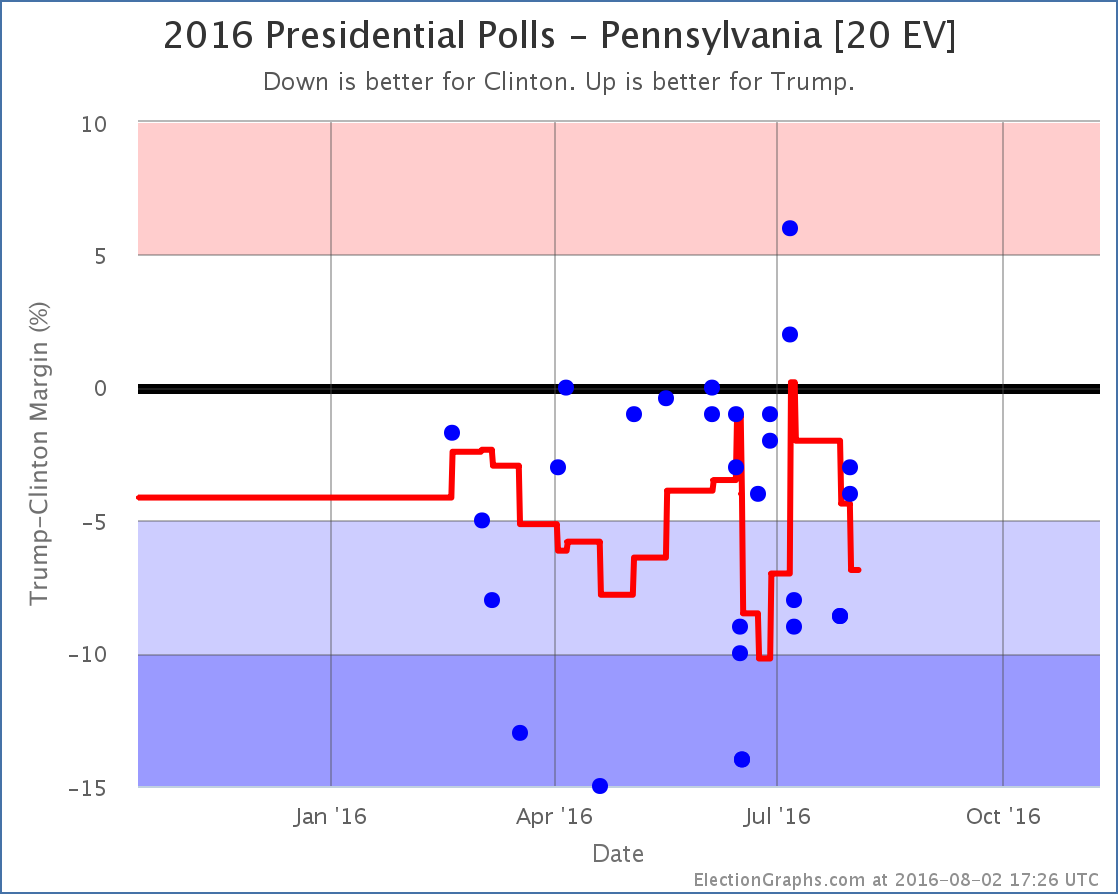
With the new PPP results added, Quinnipiac data from early July drop off the average. Those Quinnipiac results were the best polls for Trump in Pennsylvania in almost a year. Without them, Clinton looks much better off. The poll average moves from a Clinton lead of 4.4% to a Clinton lead of 6.9%.
With that, we once again classify Pennsylvania as “Strong Clinton” and take it off the list of states where Trump is “close” and thus a Trump win is plausible.
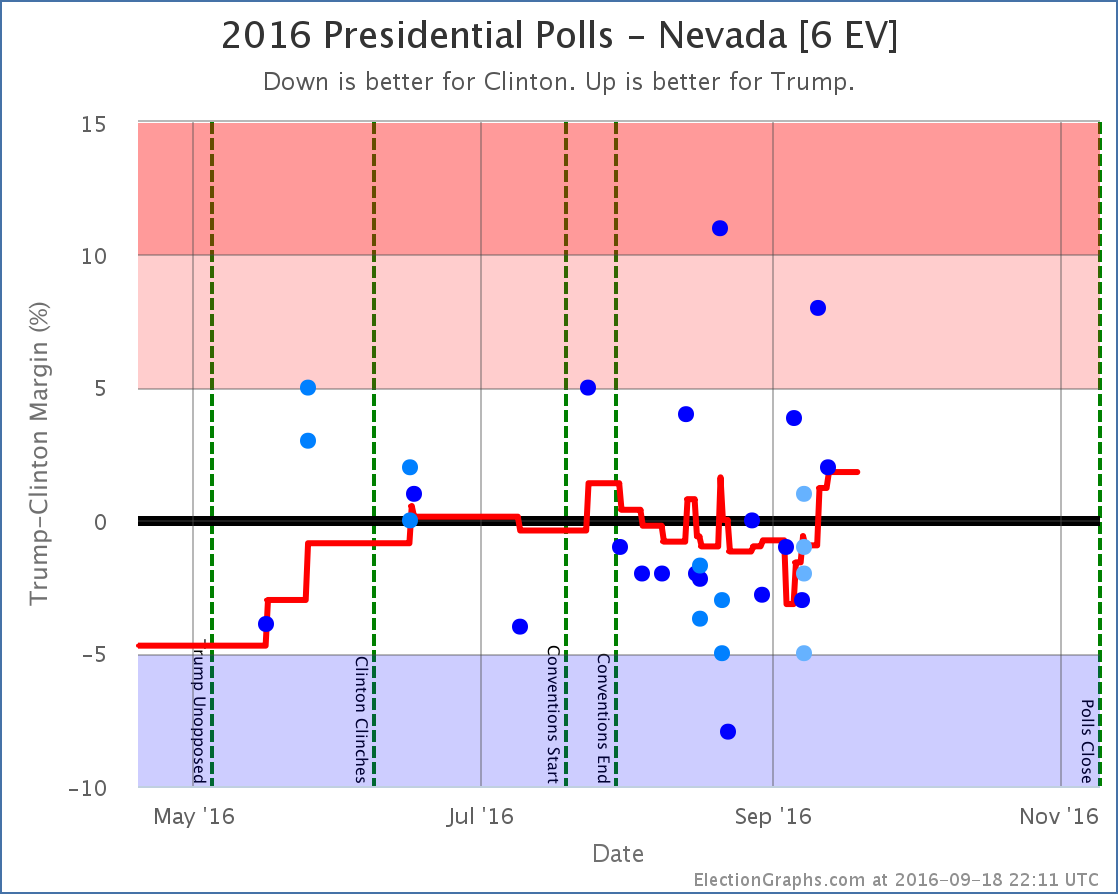
Nevada [6 EV]
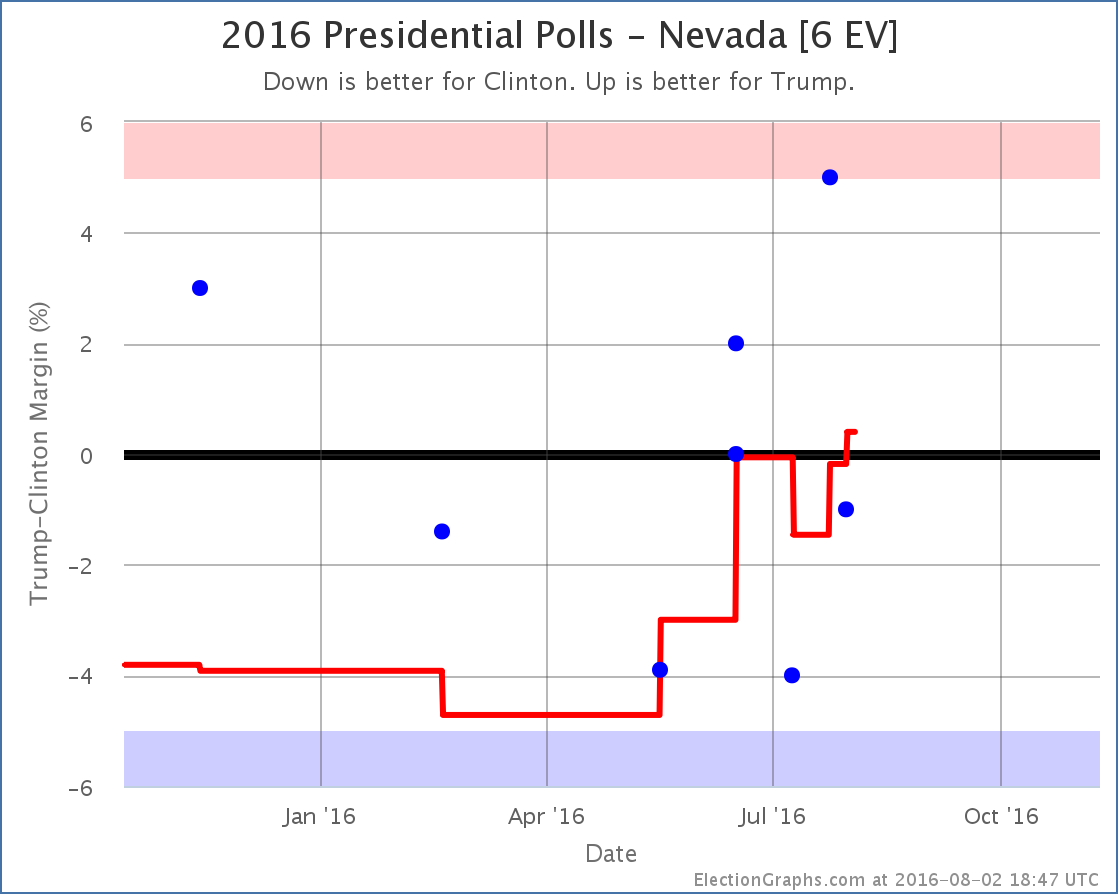
Compared to many other close states, Nevada has been sparsely polled. The latest poll actually has Clinton ahead, but by less than the poll it replaces in the average, so the average moves toward Trump… and crosses the center line! For the first time this election cycle, the Nevada poll average shows a Trump lead. A small 0.4% Trump lead, but a lead none the less.
National Picture
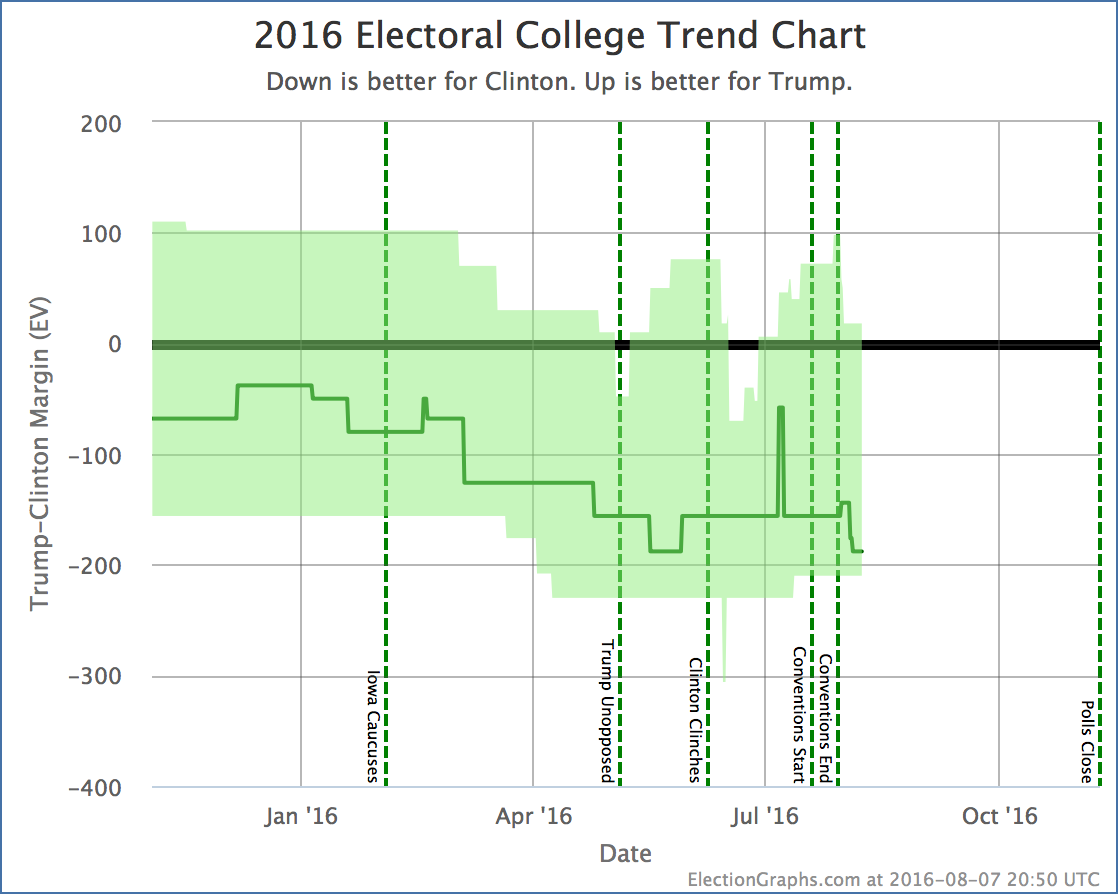
Between these two states, we have two changes in the national picture which can be seen on the national trend chart:
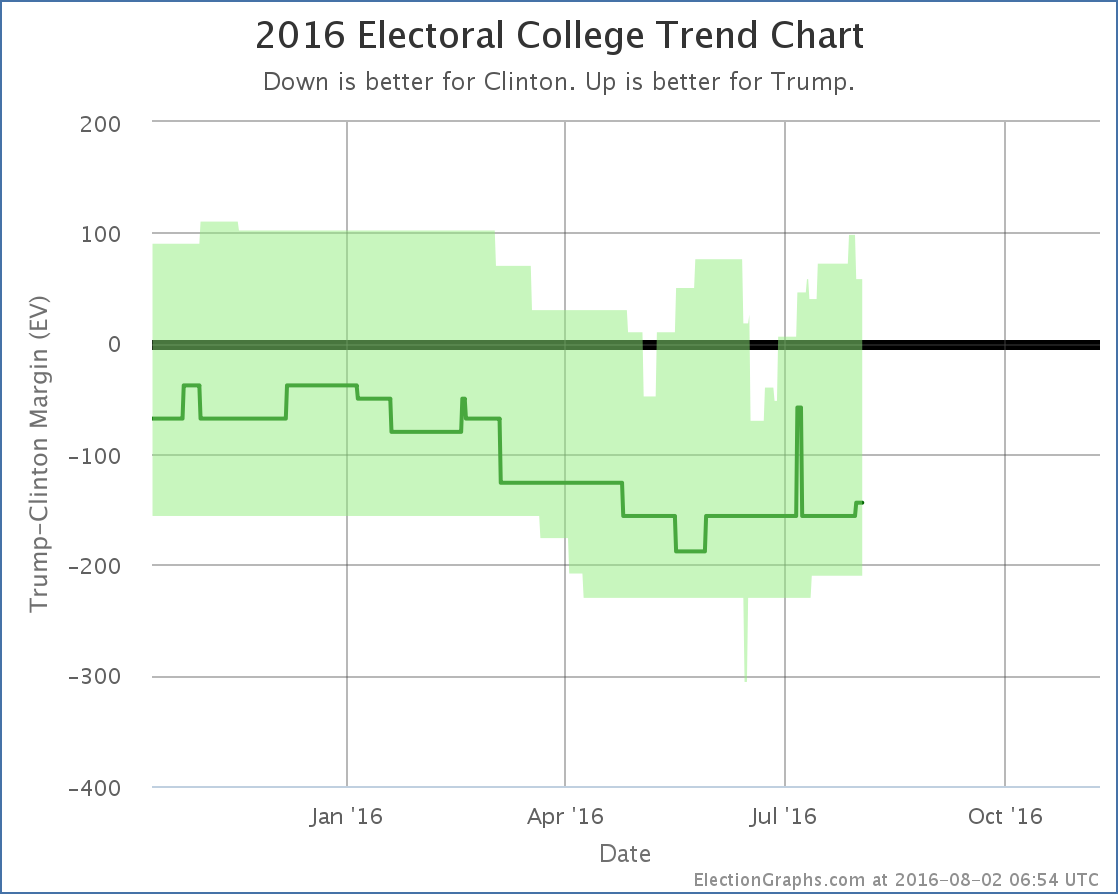
The upper right of the “bubble” shows a brief spike from Virginia moving into the close category yesterday, immediately followed by a drop due to the Pennsylvania change today. This looks like it might be a “top” and a start of a Trump decline in his “best case”, but as usual, use caution in making those sorts of determinations based on a single change. If more states move from Weak Clinton to Strong Clinton over the next few weeks, then that might be a valid conclusion. For now though it is premature.
And of course we have Nevada moving in the opposite direction at the same time. Nevada is a small state, but moves in the “expected case” are rare compared to changes in Trump’s best case. There was a short spike in early July that lasted a grand total of two days, but other than that this is the first move of the actual expected result toward Trump since May. We’ll see if this time it lasts longer than two days.
98.2 days until polls start to close.
Note: This post is an update based on the data on ElectionGraphs.com. Election Graphs tracks both a poll based estimate of the Electoral College and a numbers based look at the Delegate Races. All of the charts and graphs seen in this post are from that site. Additional graphs, charts and raw data can be found there. Follow @ElectionGraphs on Twitter or like Election Graphs on Facebook to see announcements of updates or to join the conversation. For those interested in individual general election poll updates, follow @ElecCollPolls on Twitter for all the polls as they are added. If you find the information in these posts interesting or useful, please consider visiting the tip jar.
This week on Curmudgeon’s Corner Sam and Ivan of course talk about Election 2016, covering both the Democratic and Republican nomination races, then some speculation about what a Clinton vs Trump race may look like. Before that though, they spend some time following up on both the Apple vs FBI case and the SCOTUS vacancy. And there is some feedback to discuss!
Click below to listen or subscribe… then let us know your own thoughts!

Recorded 2016-02-25
Length this week – 1:32:14
 1-Click Subscribe in iTunes 1-Click Subscribe in iTunes
 View Podcast in iTunes View Podcast in iTunes
 View Raw Podcast Feed View Raw Podcast Feed
 Download MP3 File Download MP3 File
 Follow the podcast on Facebook Follow the podcast on Facebook
Show Details:
- (0:00:10-0:11:03) But First
- Water Heater Fire
- Commutes
- Agenda
- Feedback
- (0:12:07-0:28:20) Apple vs FBI
- PR Battle
- Cracking Safes
- Other ways to get info
- Test Case
- Slippery Slopes
- Lavabit comparison
- (0:29:06-0:42:09) SCOTUS and Congress
- Doing Nothing
- Republican Strategies
- Options in January
- Senate Implications
- Republican Factions
- Ivan for SCOTUS
- (0:42:48-1:01:36) Election 2016 – Primaries
- Ivan for SCOTUS continued
- Clinton Still Winning
- Judicial Murders
- Trump SC/NV Wins
- Dissipating Trump Denial
- Gaming out Super Tuesday
- (1:02:16-1:31:53) Election 2016 – Clinton vs Trump
- Trump as third party after contested convention?
- Are there really that many asshole racists?
- The whiteness of the GOP
- Clinton vs Trump personal attacks
- Trump attacking from both Right and Left
- Trump Reinvention
- President Trump
Once again the headline out of a state is Trump winning. In Nevada the delegate count was:
14 Trump, 7 Rubio, 6 Cruz, 2 Carson, 1 Kasich
To be on the glide path for a 1st ballot victory though, Trump needed 15 of the 30 delegates. So he fell slightly short.
Now, don’t misunderstand. This is still an impressive victory, and looking at the upcoming states he has a clearer path to victory than anybody else. His margins were higher in Nevada than many people expected. But if today’s performance was replicated in all of the other states, Trump would come to the convention with more delegates than anybody else, but not the majority needed to win outright. Of course as we continue more people will drop out, and the amount with which states give bonuses to the winners increases, so that still seems like an unlikely final outcome.
Right now Trump continues to do everything he needs to do to win. Lets look at some of the graphs, then we’ll do a quick look at the March 1st “Super Tuesday” states.
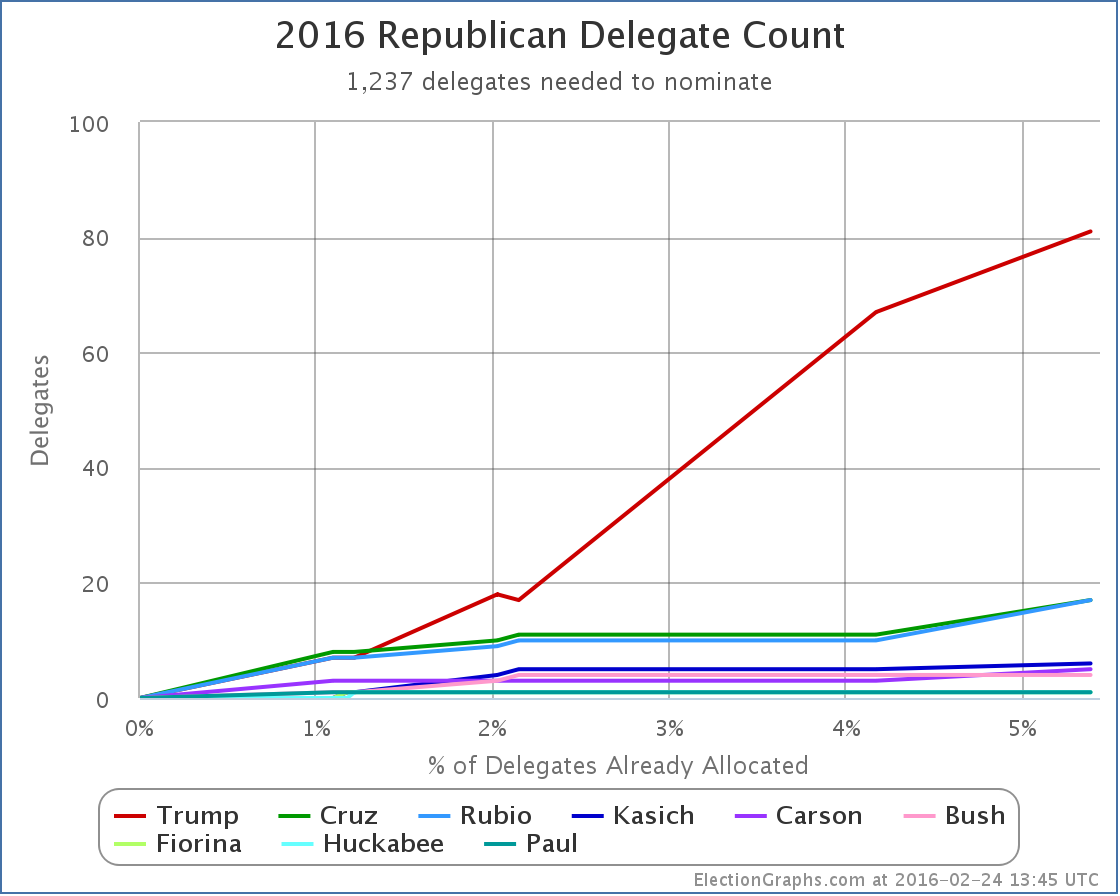
The overall delegate count is now:
81 Trump, 17 Cruz, 17 Rubio, 6 Kasich, 5 Carson, and 7 for people who have dropped out
Trump continues to dominate. Lets look at this as percentages:
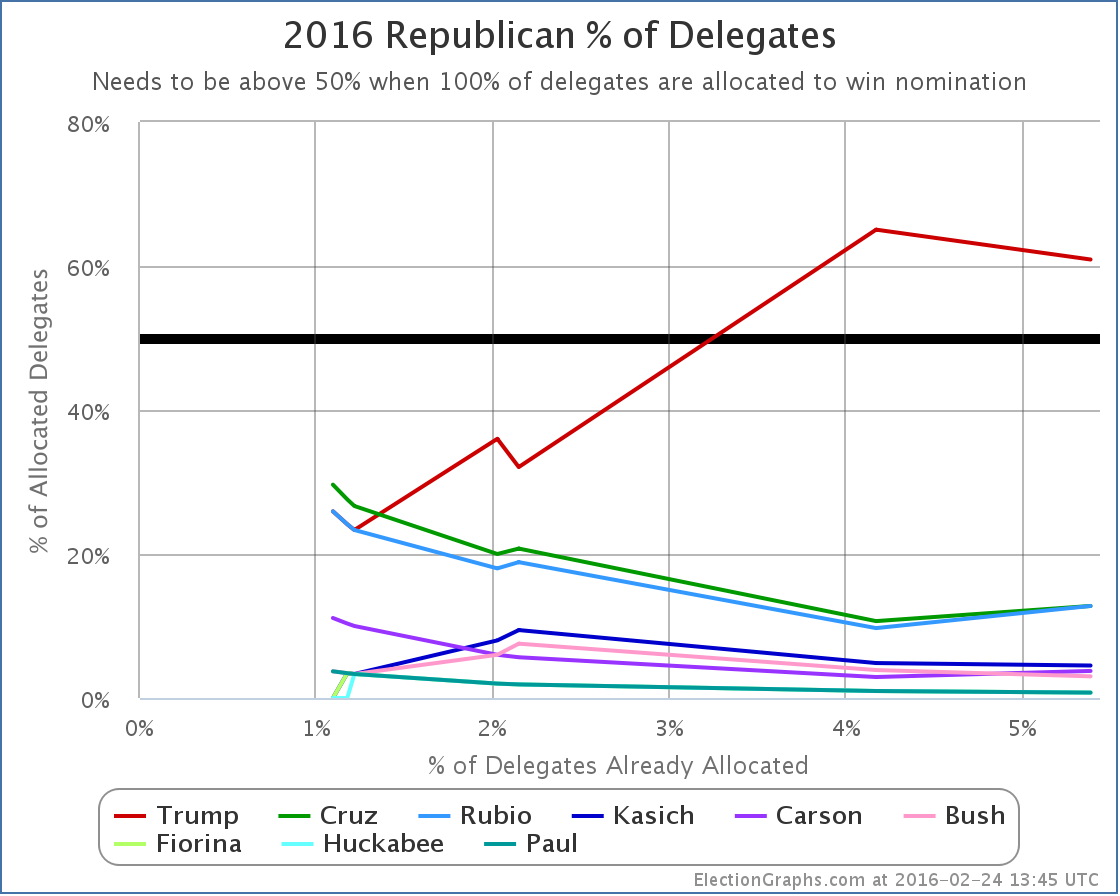
The “winners” here were actually Cruz, Rubio and Carson. Each of them improved their proportion of delegates with Nevada’s results. Trump actually went down. He doesn’t have to worry too much about that though. He still has a majority of the delegates allocated so far, and he is far far ahead of any of his opponents.
Finally, lets look at the “% of remaining delegates needed to win”, which I argue is the single most important thing to look at to understand where the race really is:
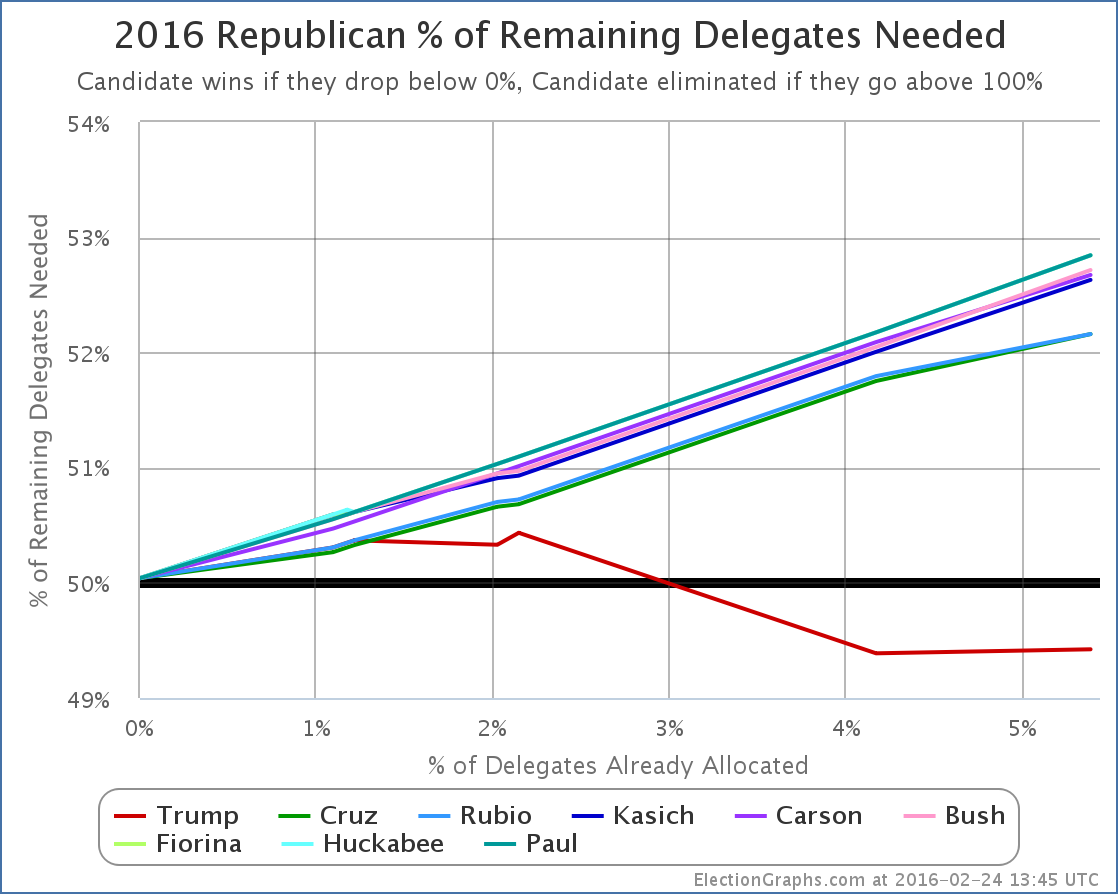
Because Trump got 14 delegates instead of 15 delegates, his line goes up a little bit. (Remember, on this chart down is good, up is bad.) The red line goes from needing 49.39% of the remaining delegates to needing 49.42%. This is a relatively trivial difference though. It is basically flat. Trump’s situation is very close to unchanged.
Meanwhile, the other lines keep going up at a decent pace. Kasich and Carson add about 0.6% to their numbers. Cruz and Rubio add about 0.4%.
This should be obvious, but the more they lose, the harder it is to catch up.
Many people are still talking about how as consolidation happens, the remaining non-Trumps will do better and the picture will change. Maybe, but nobody new announced they were dropping out after the Nevada results (yet anyway). So it looks like we may still go into March 1st with a five person race.
Lets run a hypothetical using current polling on the Super Tuesday states and see where we end up using RCP poll averages for the five remaining candidates. We’ll make delegate estimates based on the specific delegate allocation rules in each state.
Texas (155 delegates)
- Current poll averages: 37.3% Cruz, 28.0% Trump, 11.7% Rubio, 4.7% Carson, 3.0% Kasich
- Delegate estimates: 99 Cruz, 56 Trump
Georgia (76 delegates)
- Current poll averages: 35.0% Trump, 22.7% Cruz, 19.3% Rubio, 7.3% Carson, 6.3% Kasich
- Delegate estimates: 50 Trump, 26 Cruz
Tennessee (58 delegates)
- Last poll from November so using national average: 33.6% Trump, 20.4% Cruz, 16.4% Rubio, 9.8% Kasich, 7.4% Carson
- Delegate estimates: 37 Trump, 21 Cruz
Alabama (50 delegates)
- Last poll from December so using national average: 33.6% Trump, 20.4% Cruz, 16.4% Rubio, 9.8% Kasich, 7.4% Carson
- Delegate estimates: 32 Trump, 18 Cruz
Virginia (49 delegates)
- Using only February poll: 28% Trump, 22% Rubio, 19% Cruz, 7% Kasich, 7% Carson
- Delegate estimates: 17 Trump, 13 Rubio, 11 Cruz, 4 Kasich, 4 Carson
Oklahoma (43 delegates)
- Using only February poll: 32.5% Trump, 25.0% Cruz, 15.5% Rubio, 7.0% Carson, 0.0% Kasich
- Delegate estimates: 17 Trump, 15 Cruz, 11 Rubio
Massachusetts (42 delegates)
- Current poll averages: 41.0% Trump, 17.0% Rubio, 10.0% Cruz, 7.5% Kasich, 3.5% Carson
- Delegate estimates: 23 Trump, 9 Rubio, 6 Cruz, 4 Kasich
Arkansas (40 delegates)
- Using only February poll: 27% Cruz, 23% Trump, 23% Rubio, 11% Carson, 4% Kasich
- Delegate estimates: 18 Cruz, 13 Rubio, 9 Trump (giving Rubio the 2nd place finish breaking 23% tie by alphabetical order)
Minnesota (38 delegates)
- Last poll from January so using national average: 33.6% Trump, 20.4% Cruz, 16.4% Rubio, 9.8% Kasich, 7.4% Carson
- Delegate estimates: 18 Trump, 11 Cruz, 9 Rubio
Wyoming (29 delegates)
- No polls at all, using national average: 33.6% Trump, 20.4% Cruz, 16.4% Rubio, 9.8% Kasich, 7.4% Carson
- Delegate estimates: 12 Trump, 7 Cruz, 5 Rubio, 3 Kasich, 2 Carson
Alaska (28 delegates)
- Last poll from January so using national average: 33.6% Trump, 20.4% Cruz, 16.4% Rubio, 9.8% Kasich, 7.4% Carson
- Delegate estimates: 13 Trump, 8 Cruz, 7 Rubio
Vermont (16 delegates)
- No polls at all, using national average: 33.6% Trump, 20.4% Cruz, 16.4% Rubio, 9.8% Kasich, 7.4% Carson
- Delegate estimates: 10 Trump, 6 Cruz
OK, that’s it. Adding all that up…
Estimated Super Tuesday delegate totals: 294 Trump, 246 Cruz, 67 Rubio, 11 Kasich, 6 Carson
That gives Trump 47.1% of the super Tuesday delegates, Cruz 39.4%, and everyone else much less.
Trump needs 49.4% of the delegates to be on the path to an outright win though! So 47.1% would be in the realm where heading to a contested convention might be possible! Still unlikely, as the additional states in March will add up fast, and more candidates are likely to drop out. Still though, possible!
Adding in the existing delegates, we’d have a post-Super Tuesday race that looks like this:
375 Trump, 263 Cruz, 84 Rubio, 17 Kasich, 11 Carson, 7 for candidates who have already dropped out
Now, these are estimates based on current polling, and very few of these states were well polled as of this post, so much of the above is based on one or two polls, or using the national averages rather than state polls. And I had to make the assumption that all congressional districts would mirror state results (which is unlikely to be true). And Wyoming actually elects individual delegates rather than doing things based on candidate preference, so it may be an oddball in the end. And of course things are likely to change further before people actually vote next Tuesday. But… the general outlines of this aren’t likely to be too far off.
If this is even remotely close to where we are on March 2nd, we end up with Trump very close to the 50% of delegate mark. (The above has him EXACTLY at that mark.) He would need just a LITTLE bit more to actually push him over the edge to a clean win.
The flip side of that though is the combination of all the anti-Trumps would need just a LITTLE bit more in order to have this be on the path to a contested convention. I mentioned earlier that this is still an unlikely outcome. It is. After March 1st, the disproportionality of delegates given to the winner increases, and after March 15th we have pure winner take all states as well. If Trump remains in the overall lead, even with a plurality, then that is all it takes to push him over the edge.
If the anti-Trumps want to have any hope here at all, they need to be in a position by mid-March that they can win not just a few, but many states of the winner-take-most and winner-take-all variety. And frankly, the most likely scenario even then is just forcing a contested convention where Trump still has the most delegates, not someone else winning outright.
The anti-Trumps would have a hard road to get to an outright win. Cruz would need 56.8% of the remaining delegates to catch up and win after March 1st if things played out like my estimates above.
If you had to make a guess based on what we know now, a Trump nomination is far more likely than any other… and with an outright delegate majority on the first ballot, not after a contested convention.
6 days until Super Tuesday. We’ll see how close my estimates above turn out to be.
Update 2016-02-26 07:17 UTC – On February 22nd New Hampshire certified the results of their primary. In the final tally Trump had one more delegate than previous estimates, and Rubio one less. This did not seem worthy of a separate post, but a note here seemed appropriate. The totals on ElectionGraphs.com have been updates appropriately. This does not substantively change any of the analysis above.
Note: This post is an update based on the data on ElectionGraphs.com. Election Graphs tracks both a poll based estimate of the Electoral College and a numbers based look at the Delegate Races. All of the charts and graphs seen in this post are from that site. Additional graphs, charts and raw data can be found there. All charts above are clickable to go to the current version of the detail page the chart is from, which may contain more up to date information than the snapshots on this page, which were current as of the time of this post. Follow @ElectionGraphs on Twitter or like Election Graphs on Facebook to see announcements of updates or to join the conversation. For those interested in individual general election poll updates, follow @ElecCollPolls on Twitter for all the polls as they are added.
[Edit 16:28 UTC to correct math on % of remaining Cruz would need after Super Tuesday, I’d originally shown a higher number around 61%.]
[Edit 2016-02-27 17:06 UTC to fix place where Kasich had been autocorrected to Quash.]
[Edit 2016-02-28 22:03 UTC to add dropped out candidates to the after Super Tuesday estimate.]
Sanders needed to win 20 of the 35 delegates available in Nevada’s caucuses to be on a pace to catch up with Clinton and win the Democratic nomination. He did not get 20. He got 15. Clinton got 20. There was some talk from the Sanders camp about how much closer Nevada was than it looked like it would be a few weeks ago. That is true. But in the end, the result is Clinton getting 57% of the delegates while Sanders gets 42%.
So Sanders falls further behind. Lets look at the charts.
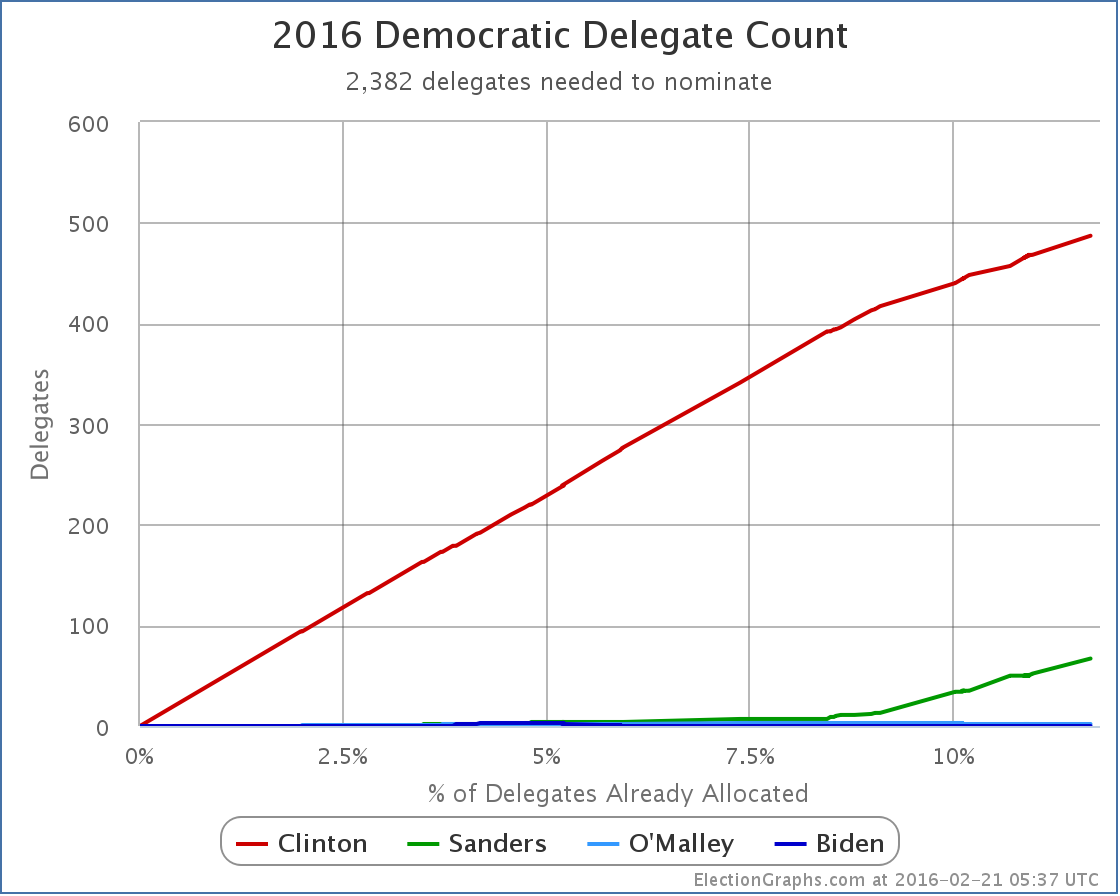
First the straight up delegate counts. We are now at Clinton 487, Sanders 67, O’Malley 2.
In addition to the delegates from the Nevada caucuses, since my last update on the 14th when 42 superdelegates were added for Clinton there have been other updates contributing to those numbers. That includes a number of new delegates identified as being for a candidate, a couple delegates who had been identified as being for a candidate saying explicitly that they considered themselves to be neutral, a few double counting errors corrected, and even one superdelegate dying. The net result was 6 more delegates for Clinton and 2 more for Sanders. And I gave O’Malley back 2 superdelegates who despite his dropping out have not yet stated another preference. In general these changes are backdated to the date there is evidence for them, rather than being dated as of the time I find the change.
Add those all up, and since New Hampshire, Clinton’s total has increased by 68 delegates while Sanders gained 17. If you don’t count the delegates that changed before New Hampshire that I found out about after New Hampshire, it is still 30 Clinton delegates to 17 for Sanders.
Either way, Clinton continues to accumulate delegates faster than Sanders does. That is not a recipe for Sanders catching up. To catch up, Sanders needs to either be getting supermajorities of the delegates from primaries, caucuses and currently unpledged superdelegates, or he needs to be getting quite a few current Clinton superdelegates to defect. So far neither of those things have been happening.
(Note: AP and CNN have Clinton’s delegate totals even higher, presumably due to some non-public superdelegate commitments they know about but haven’t published. The above counts are mostly using superdelegate counts from Wikipedia except for a handful of cases where I have deviated for specific reasons where I believe I have a better count.)
So, how is the “% of remaining delegates needed to win” looking?
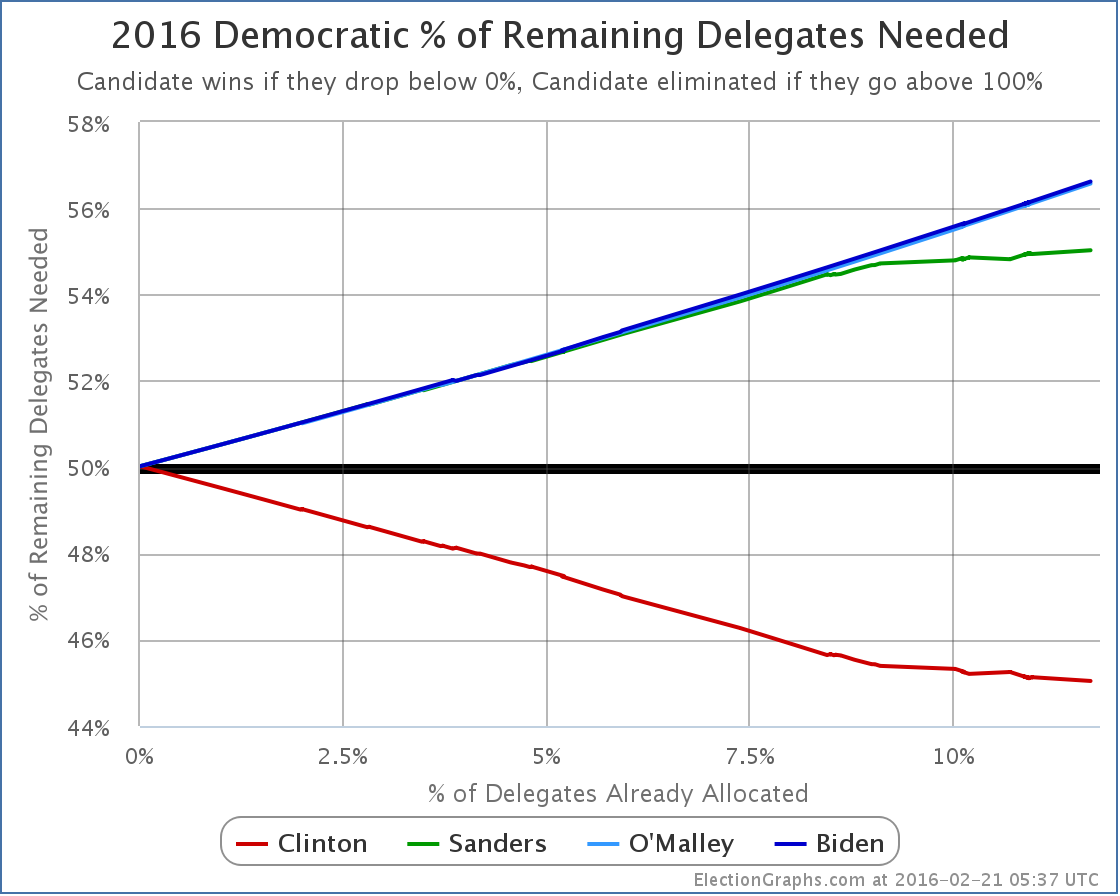
Since Sanders has not been making his percentages, and Clinton has, Clinton’s line is slowly dropping, and Sanders’ is slowly rising. Slowly is the watchword here though. Sanders is now up to 55.03%. Right before Iowa, this was at 54.22%. (Counting the postdated delegates, 54.72%.) Sanders hasn’t done well enough that he is actually catching up with Clinton, but he has done well enough to keep the movement on this number low. He is ALMOST keeping Clinton from making progress. Almost but not quite.
As more delegates get racked up, assuming Sanders continues to collect less than 55% of the delegates, it will not only get harder and harder to catch up to Clinton, it will also get harder and harder to prevent that red line from zooming downward to zero, the point where Clinton wraps up the nomination.
For now though, while he isn’t stopping her, Sanders is clearly slowing Clinton down more than she would like.
Next up, South Carolina.
Update 2016-02-26 15:55 UTC – Completed a scan for superdelegate changes. Net result is +6 Clinton superdelegates… plus one new O’Malley superdelegate. This is not actually a NEW O’Malley superdelegate, but one that declared their support back in November but just hadn’t been logged yet, and there is not yet evidence of them stating they are now uncommitted or backing another candidate. These changes have no substantive effect on the analysis above.
Update 2016-02-28 03:24 UTC – Another scan for superdelegates in preparation for adding in South Carolina results. Net result Clinton +4, Sanders +1. This again has not substantive effect on the analysis above, but putting a note here since it is not worth a blog post of its own.
Note: This post is an update based on the data on ElectionGraphs.com. Election Graphs tracks both a poll based estimate of the Electoral College and a numbers based look at the Delegate Races. All of the charts and graphs seen in this post are from that site. Additional graphs, charts and raw data can be found there. All charts above are clickable to go to the current version of the detail page the chart is from, which may contain more up to date information than the snapshots on this page, which were current as of the time of this post. Follow @ElectionGraphs on Twitter or like Election Graphs on Facebook to see announcements of updates or to join the conversation. For those interested in individual general election poll updates, follow @ElecCollPolls on Twitter for all the polls as they are added.
Edit 17:17 UTC to add note about AP and CNN delegate counts.
On this week’s Curmudgeon’s Corner podcast Sam and Ivan do indeed talk a lot about Election 2016 and all of the developments there, but there is other news this week too! So first off is a discussion of Apple vs the FBI, then an analysis of the battle following Justice Scalia’s death. Oh, and you get the story of Sam’s drive from Seattle to San Francisco, and a bit about the limitations of video streaming too!
Click below to listen or subscribe… then let us know your own thoughts!
Recorded 2016-02-19
Length this week – 2:16:56
1-Click Subscribe in iTunes
View Podcast in iTunes
View Raw Podcast Feed
Download MP3 File
Follow the podcast on Facebook
Show Details:
- (0:00:10-0:31:57) But First
- Sam in a Hotel
- Agenda
- New Microphone
- Internet Quality
- Sam’s Drive
- (0:32:37-0:54:55) Apple vs FBI
- The Order
- Why Apple Refused
- Why is FBI pushing this case?
- What if Apple loses?
- What if Apple wins?
- Industry Implications
- Slippery Slope
- Politicians and Encryption
- (0:55:58-1:21:14) Death of Justice Scalia
- Ivan’s doppelgГ¤nger
- The news breaks, people go nuts
- Republican Senate says don’t even nominate
- Higher stakes that previous vacancies?
- Recess Appointment?
- Does this damage Senate Republicans?
- Who does Obama pick?
- Hypocrisy?
- Will the wall hold until January?
- Impact of 4-4 Court
- (1:22:34-1:40:01) Election 2016 – Democrats
- Upcoming Contest Schedule
- Nevada Polls
- Election Graphs Comment
- Superdelegates
- Possible paths for Sanders
- (1:40:50-2:08:09) Election 2016 – Republicans
- The Latest Debate
- Polling Update
- Gaming out the next states
- Trump trying to lose?
- Trump lawsuit threats
- Trump’s RNC Deal
- Trump and the Pope
- (2:09:18-2:16:36) Lightning Round
- Obama going to Cuba
- Steaming Video
|
|
