Only one change of note this week. PPP did another poll of North Carolina. Of the five best polled candiate pairs… right now still Clinton vs Bush, Paul, Christie, Huckabee, and Rubio… only Clinton vs Huckabee resulted in a category change.
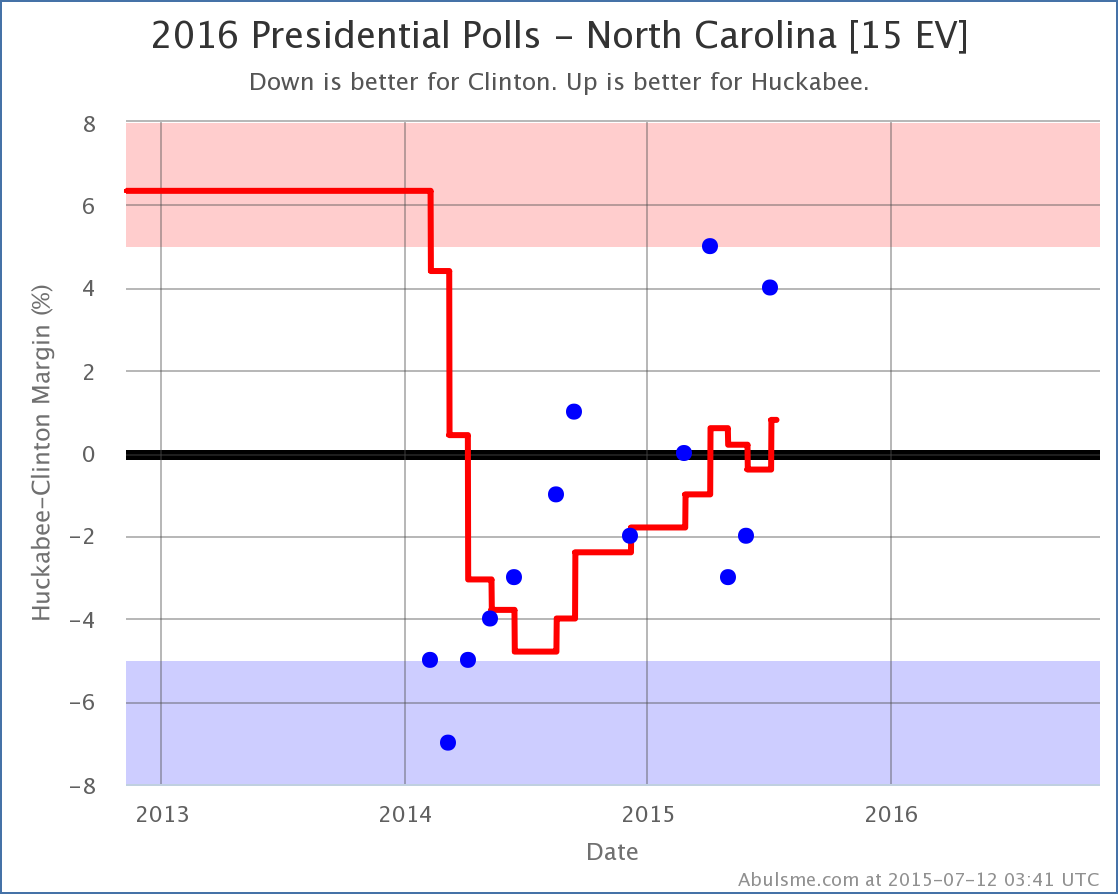
Huckabee takes the lead again after having lost it at the end of May. Looking at the long term trend, Huckabee has been gaining against Clinton in North Carolina for the last year or so. Now, is this just Huckabee, or part of a larger trend against Clinton?
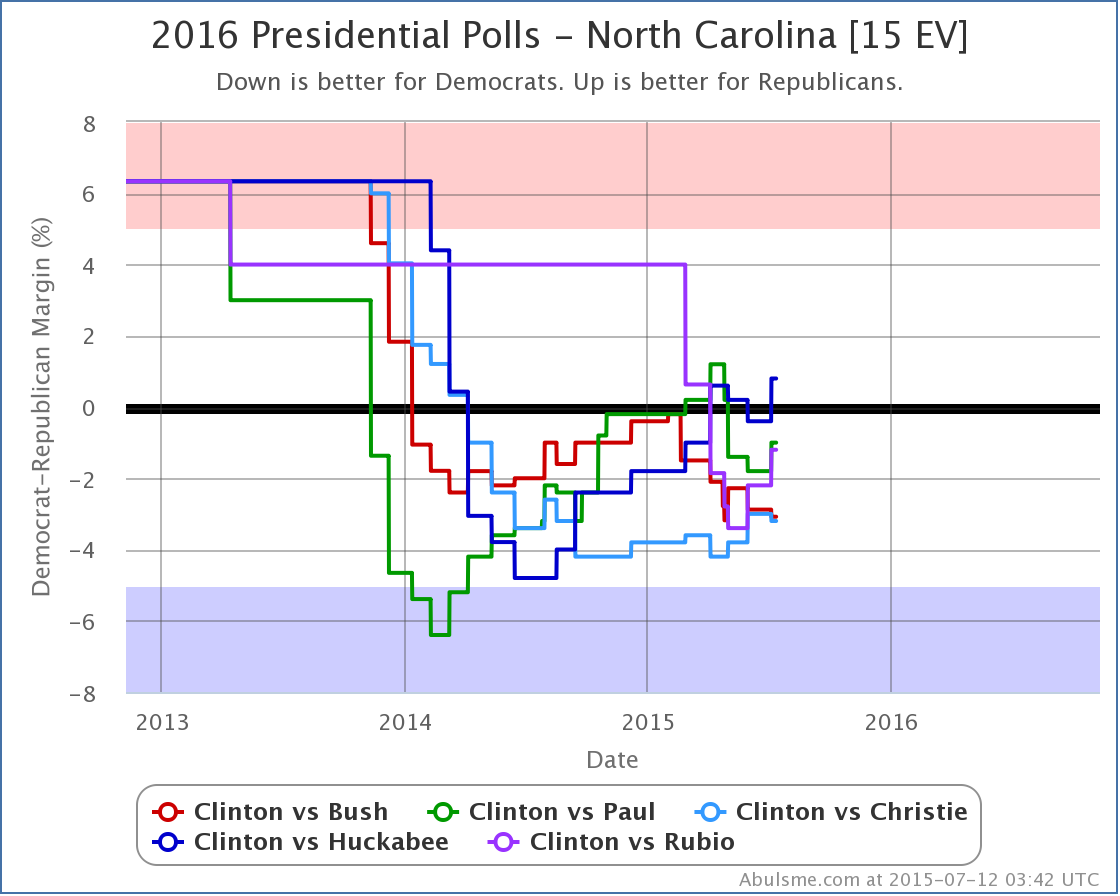
Lets look at how each of these five candidates has done against Clinton in North Carolina over the last six months, namely comparing where they stand today (July 12) vs where they were six months ago (January 12).
- Clinton vs Huckabee: Clinton by 1.8% -> Huckabee by 0.8% (2.6% Huckabee gain)
- Clinton vs Christie: Clinton by 3.8% -> Clinton by 3.2% (0.6% Christie gain)
- Clinton vs Paul: Clinton by 0.2% -> Clinton by 1.0% (0.8% Clinton gain)
- Clinton vs Bush: Clinton by 0.4% -> Clinton by 3.1% (2.7% Clinton gain)
- Clinton vs Rubio: Rubio by 4.0% -> Clinton by 1.2% (5.2% Clinton gain)
So, no. There hasn’t been an across the board Republican gain here, at least not over the last six months. (There is a bit more of move toward the Republicans if you look back a whole year.) Over six months though, we have Huckabee and Christie doing better against Clinton, while Paul and Bush are doing worse.
(You can discount the Rubio results, as six months ago there was only one actual Clinton vs Rubio poll in NC, so this was primarily movement toward the real Rubio numbers away from the average of previous election results, rather than actual movement in Clinton vs Rubio.)
Given this, there might really be something to the notion that Huckabee may be getting some resonance in North Carolina that Bush is not.
Regardless though, North Carolina is “close” for all five of these candidates against Clinton. It could very easily go either way. The differences between these five candidate pairs aren’t actually all that huge. North Carolina is looking like it will definitely be one of the swing states this cycle.
Looking back at Huckabee for a minute, we can see how this changes his “expected” result vs Clinton:
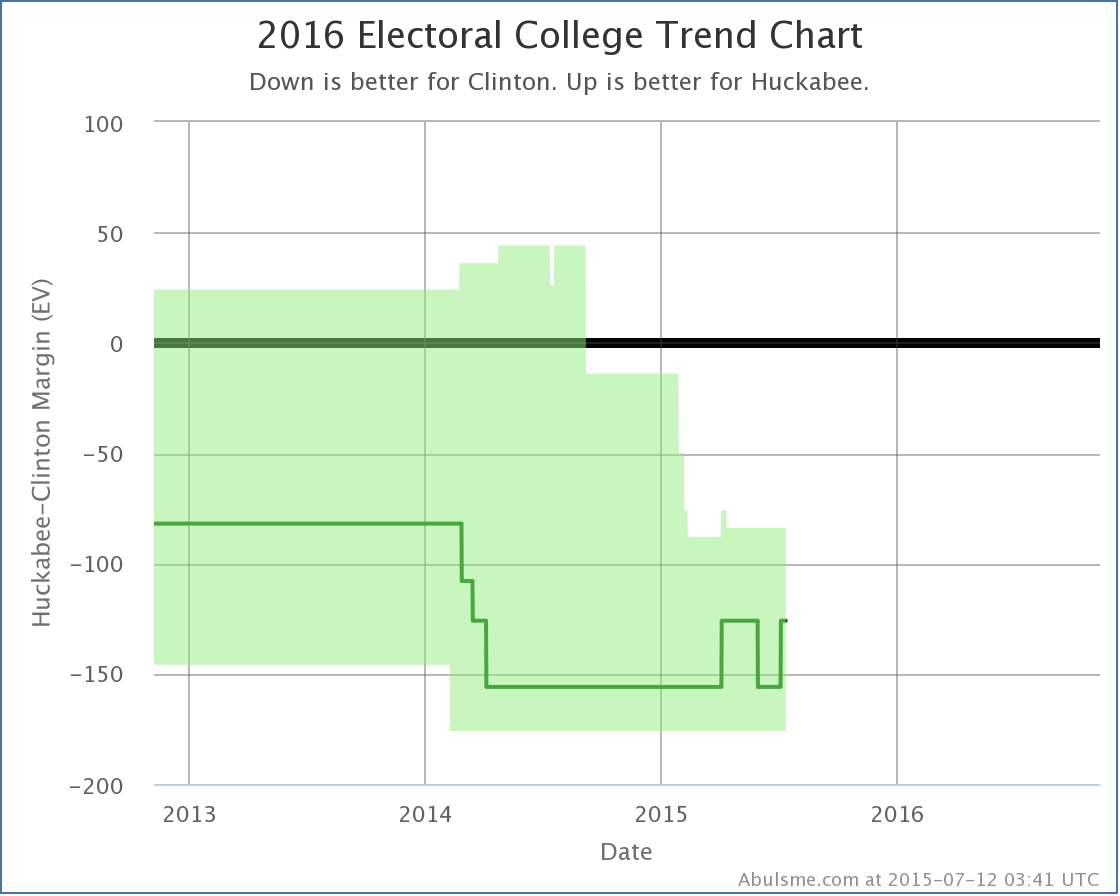
With North Carolina back in his column, if each candidate won every state they are currently ahead in, we end up with… Clinton 332 to Huckabee 206. This is a 126 electoral vote win for Clinton.
This is also an exact match for the 2012 election results, which were Obama 332 to Romney 206. Not only do the numbers match, but every single state matches. So with today’s polls, with Clinton and Huckabee, we essentially end up with an exact rerun of 2012.
Interestingly though, if you look at just the “expected” results such as the above, and not the “best cases” for each of the Republicans (where you give them all the states where Clinton is ahead by less than 5% too) then at the moment, somewhat shockingly I think… Huckabee is actually out performing each of the other four Republicans in the five best polled candidate combinations:
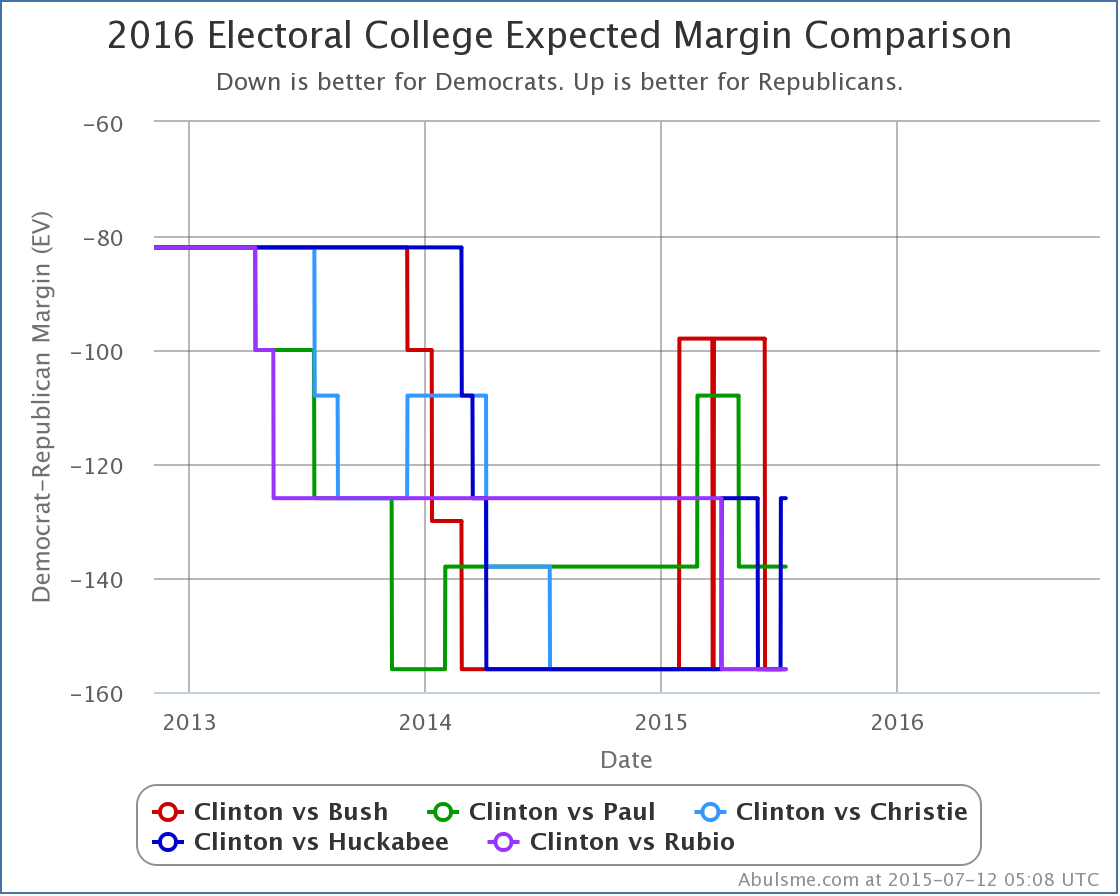
Of the five best polled candidates:
- Clinton vs Huckabee: Huckabee loses by 126 – exact match of 2012
- Clinton vs Paul: Paul loses by 138 – Paul gets all Romney states except NC (15 ev), but gains CO (9 ev)
- Clinton vs Bush, Christie and Rubio: Republican loses by 156 – Republican gets all Romney states except NC (15 ev)
So, with all the polling and back and forth so far and all my various squiggly lines… at least as of today… the only states that are shifted from 2012 for any of these five candidates against Clinton are Colorado and North Carolina. Barely any change at all!
But, as I always try to make sure to mention: All of these numbers are “if the election was held today” numbers, and the election is most certainly not held today! (And there are still many states with little or no 2016 polling yet.)
There will be a lot of events between now and the election, and a lot of campaigning, and a lot more polling. Plenty of time for things to change… potentially a lot.
485.8 days until the first polls close as I post this. Stay tuned!
Note: This post is an update based on the data on my 2016 Electoral College Analysis Site. All of the charts and graphs seen here are from that site. Graphs, charts and raw data can be found there for the race nationally and in each state for every candidate combination that has been polled at the state level. In addition, comparisons of the best polled candidate combinations both nationally and each in each state are available. All charts above are clickable to go to the current version of the detail page the chart is from, which may contain more up to date information than the snapshots on this page, which were current as of the time of this post. Follow @ElecCollPolls on Twitter for specific poll details as I add them.