This is the website of Abulsme Noibatno Itramne (also known as Sam Minter).
Posts here are rare these days. For current stuff, follow me on Mastodon
|
The Electoral College voted on Monday December 19th. There were faithless electors this year, so the final results differed from the “earned” results reported in my “Final Forecast and Election Night Updates” post.
Despite the hopes of groups like the Hamilton Electors, the number of Republican faithless electors was nowhere near the 37 that would have been needed to send the election to the House. Only 2 Republican electors actually abandoned Trump. In fact, not only was the goal of stopping Trump not achieved, but the efforts backfired completely. In the end there were more Democratic defectors than Republican defectors, so Trump’s margin actually increased from a 74 electoral vote win to a 77 electoral vote win. Not quite what those campaigning for electors to vote independently were hoping for.
Lets look at the details of the final counts.
The last state called was Michigan on November 28th. The “earned” electoral vote based on the states won and lost at that point was:
- Donald Trump 306
- Hillary Clinton 232
When the electoral college voted, there were 7 faithless electors. 5 of these were Democratic and 2 were Republican. This was the largest number of faithless electors since 1872 when 63 electors pledged to Horace Greeley did not vote for him… because he had died between the November election and the December electoral college vote. Not counting 1872, since perhaps one shouldn’t count not voting for a dead candidate, this was the largest number of faithless electors ever.
The 7 faithless electors voted for a variety of different candidates, making the official totals:
- Donald Trump 304
- Hillary Clinton 227
- Colin Powell 3
- John Kasich 1
- Ron Paul 1
- Bernie Sanders 1
- Faith Spotted Eagle 1
An additional 3 Democratic electors attempted to be faithless, but were thwarted by state laws and procedures in Maine, Minnesota, and Colorado. It is possible some or all 3 of these electors may end up filing lawsuits over this. If lawsuits actually happen and are all successful (which we obviously can not say at this point), Clinton would lose 3 additional electoral votes, Sanders would gain 2, and Kasich would gain 1. If this were to happen, Trump’s winning margin would increase further to 80 electoral votes.
Normally, we think of the Vice Presidential race as locked with the Presidential race as part of “tickets”, but in fact as far as the electoral college is concerned, these are actually two separate votes, and the faithless electors also split their choices for Vice President. The Vice Presidential results were:
- Mike Pence 305
- Tim Kaine 227
- Elizabeth Warren 2
- Maria Cantwell 1
- Susan Collins 1
- Carly Fiorina 1
- Winona LaDuke 1
And with that, absent any minor adjustments from potential lawsuits by the three foiled Democratic faithless electors, or Congress doing something unexpected on January 6th, the 2016 electoral results are set.
Donald Trump wins.
Photo by Michael Vadon [CC BY-SA 2.0], via Wikimedia Commons
Yesterday’s update was preliminary, and I ended up using the delegate estimates provided by the AP which were used at the New York Times, Washington Post, and other places. My favorite source, Green Papers, had a different set of numbers. When I tried to calculate delegate numbers myself, I came up with yet another set of numbers. I ended up going with the AP numbers.
A little more than a day later and Green Papers updated, now matching what I had calculated myself. So I’m updating the estimates accordingly.
This moves us from:
8 Cruz, 7 Trump, 7 Rubio, 3 Carson, 1 Bush, 1 Paul
to
7 Cruz, 7 Trump, 6 Rubio, 3 Carson, 1 Bush, 1 Fiorina, 1 Kasich, 1 Paul.
The main change here is one less delegate each to Cruz and Rubio, with those delegates picked up at the bottom end by Fiorina and Kasich.
But wait! There is more! The Washington Post and Politico both add two additional delegates. The 27 allocated by the caucus results were already accounted for, so these would be two of the three “party leaders” who end up as automatic delegates. No indication of which party leader did what, but they add one additional delegate each to Cruz and Rubio.
The new Iowa totals become:
8 Cruz, 7 Rubio, 7 Trump, 3 Carson, 1 Bush, 1 Fiorina, 1 Kasich, 1 Paul.
Between these two changes, the net is simply adding the delegates for Fiorina and Kasich. This means 29 of the 30 Iowa delegates are now accounted for.
Note that even though Paul has “suspended his campaign”, he keeps his delegate unless he explicitly releases it.
The raw delegate count chart now looks like this:
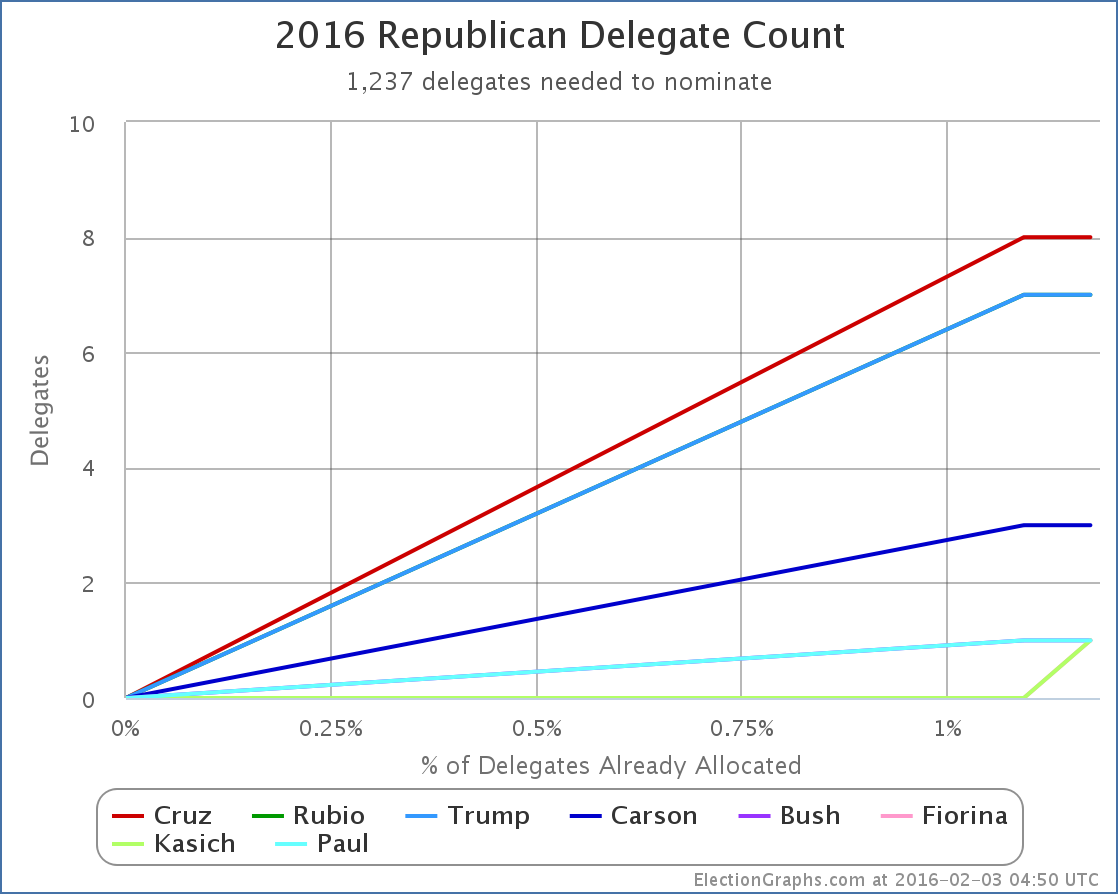
Just a little uptick at the end for Fiorina and Kasich to join Bush and Paul at the 1 delegate mark.
Flipping this over to look at “% of remaining needed to win”:
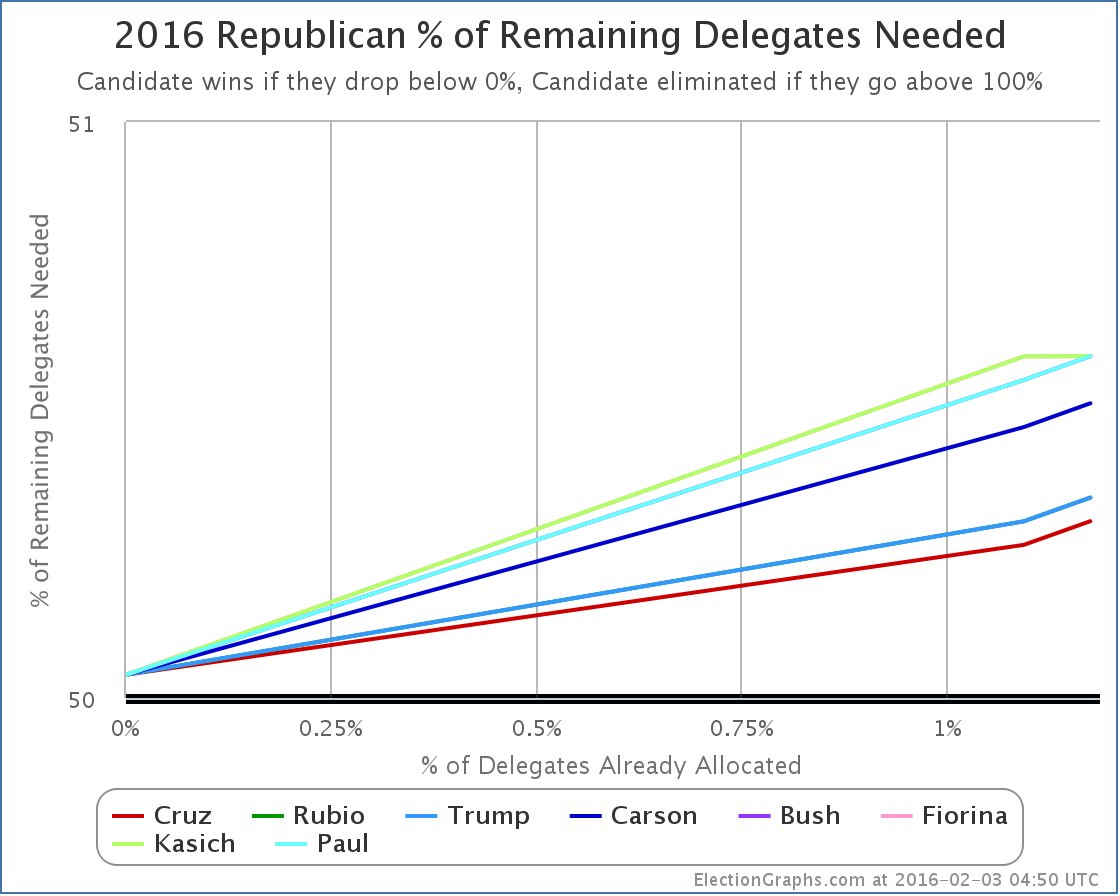
On this chart, lower is better. When you get down to 0% you win. If you get to 100% you are eliminated. Everybody is still heading upward, not downward, but it is still very early. The whole field here ranges from needing 50.31% of the remaining delegates, to needing 50.59% of the remaining delegates.
Looking specifically at New Hampshire, there are 20 delegates at stake. We are so early, and the % needed numbers so close, that this is easy. The number needed to be on track to win is 11 delegates. Anything less, and the candidate is actually going to be in a harder position in the next contest rather than an easier one.
Let’s game out New Hampshire based on the current RCP averages. Yes, yes, this is based on polling before New Hampshire. Things will change in the next six days. But this is just to model how it works.
The rules via The Green Papers:
- 20 National Convention delegates are to be bound proportionally to presidential contenders based on the primary vote statewide.
- A 10% threshold is required in order for a presidential contender to be allocated National Convention delegates.
- Allocate delegates based on the 20 Г— candidate’s vote Г· total statewide vote. Round to the nearest whole number.
- Any delegate positions that remain open are awarded to the candidate with the highest statewide vote total.
Assume each candidate gets exactly their poll average today. Only the candidates over 10% matter, so with RCP as of right now that is:
33.4% Trump, 12.2% Cruz, 10.8% Rubio, 10.4% Kasich
Converting this to delegates with the rounding rules above, you get:
7 Trump, 2 Cruz, 2 Kasich, 2 Rubio
This is only 13, so there are 7 delegates left. According to the last rule, these all go to the leader, so we end up with:
14 Trump, 2 Cruz, 2 Kasich, 2 Rubio
And therefore Trump would get 70% of the delegates despite only getting 33.7% of the vote. Trump’s line on the “% needed to win” would go down, while everybody else would go up.
After this hypothetical New Hampshire result, the overall race would be:
21 Trump, 10 Cruz, 9 Rubio, 3 Carson, 3 Kasich, 1 Bush, 1 Paul, 1 Fiorina.
Trump would still only have 42.9% of the delegates, which is not a majority, but Cruz would be way back at 20.4% and you’d have Trump starting to pull away from the pack. Still only 1.98% of delegates allocated at that point though, with lots of room for further changes.
The RCP average on February 3rd is NOT going to look like the actual results on Primary night. This is just an example.
The points to take away:
- The detailed delegate rules matter, you don’t necessarily have to win a popular vote majority to win a delegate majority.
- We’re still so very early, one contest can have a major effect on the delegate totals, and each state is very different, so don’t put much stock in extrapolating Iowa to future contests.
Of course New Hampshire will be here soon enough, and we’ll do this with the real results.
Note: This post is an update based on the data on ElectionGraphs.com. Election Graphs tracks both a poll based estimate of the Electoral College and a numbers based look at the Delegate Races. All of the charts and graphs seen in this post are from that site. Additional graphs, charts and raw data can be found there. All charts above are clickable to go to the current version of the detail page the chart is from, which may contain more up to date information than the snapshots on this page, which were current as of the time of this post. Follow @ElectionGraphs on Twitter or like Election Graphs on Facebook to see announcements of updates or to join the conversation. For those interested in individual general election poll updates, follow @ElecCollPolls on Twitter for all the polls as they are added.
Unlike the Democrats, the Republicans didn’t have years of superdelegates endorsing one candidate or another, so Iowa really was a clean slate. The very first delegates earned in the race for the 2016 Republican nomination. The headlines are of course that Trump underperformed the poll-based expectations letting Cruz slide to a win, while Rubio outperformed his expectations, coming in a close third. This is all true.
But it is also true that only a tiny fraction of the delegates have been allocated so far. None of the candidates got a majority in Iowa either. So nobody is actually yet on a track to overall victory. Cruz may be slightly ahead, but Trump and Rubio are right at his heels. Cruz is not in a dominating position. It really is a three person race.
Looking at the raw delegate graph quickly…
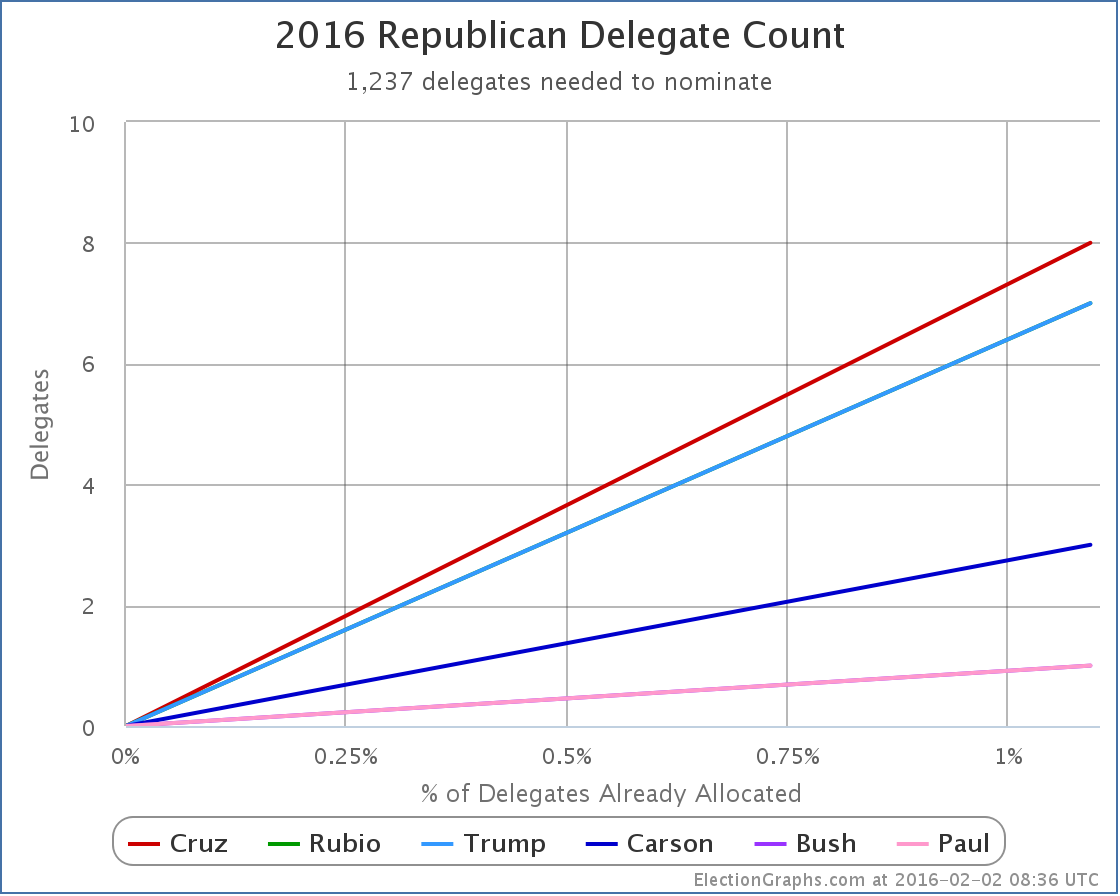
…you immediately notice that we just have a really boring graph with a few straight lines. And Rubio’s line and Trump’s line completely overlap too. As do Bush and Paul’s lines. That’s because this is our first real data point after everyone was just at zero.
All of the graphs are like this. So just this once, lets skip the graphs and look at the summary table instead:
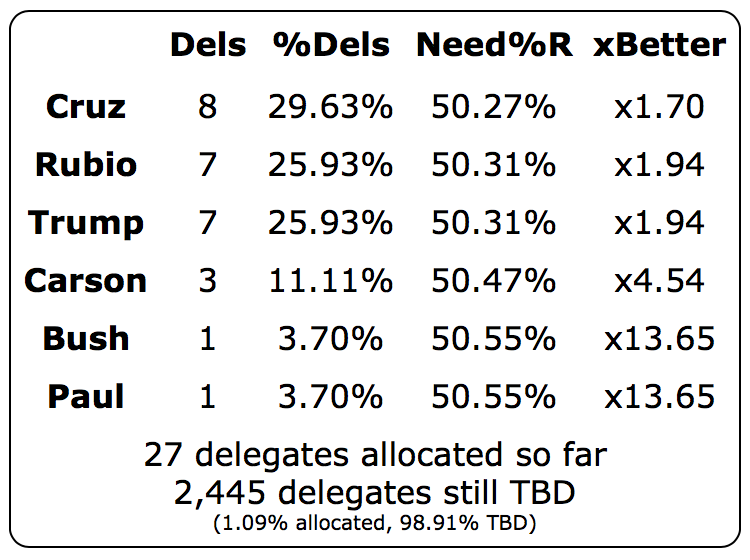
I’ll note here that Green Papers has slightly different numbers. But the New York Times, Washington Post, and CNN all agree with the estimates above, so for the moment that is what we’ll go with here.
It is clear that Cruz/Rubio/Trump are in a separate class here than Carson/Bush/Paul. But even these three would need to nearly double their performance to actually be on a track to win, because, well, you have to be getting more than half of the delegates to win outright. 25% to 30% won’t get you there. So at some point, somebody has to start going over the 50% mark if there is going to be a winner.
There is plenty of time for that of course. Nobody is predicting a contested convention quite yet, as much fun as that would be.
We probably won’t see anyone over 50% after New Hampshire either, but how close we get may depend on the viability thresholds. In New Hampshire on the Republican side you need to get 10% of the popular vote to be eligible for delegates. Although this will definitely change in response to the Iowa results, at the moment RCP has Trump at 33.2%, Cruz at 11.5%, Kasich at 11.5%, Bush at 10.3%, and Rubio at 9.5%. The rest are pretty far from 10%. But that is four candidates all within a couple percent of 10%.
Depending on which of those ends up right above or right below the 10% threshold, you could see very different delegate results coming out of New Hampshire. Most likely, we’ll have three or four candidates over 10% and a mix of delegates, but in the extreme case, if all but Trump drops under 10%, then Trump gets all the delegates. So a wide range of things is possible based on really small movements from the current positions in the polls.
Final points here though to the people saying Iowa proves that Trump is done…
- Trump was pretty close in Iowa. A one delegate difference means almost nothing.
- Although the Iowa results may diminish it, Trump starts with a big lead in New Hampshire.
- Only 1.09% of the Republican delegates have been determined so far.
We have a three way race right now. It is not inconceivable that a 4th candidate could do well enough in New Hampshire to join that group. Things are just as up in the air and chaotic on the Republican side as they were before Iowa. Anything could still happen.
Stay tuned.
Note: This post is an update based on the data on ElectionGraphs.com. Election Graphs tracks both a poll based estimate of the Electoral College and a numbers based look at the Delegate Races. All of the charts and graphs seen in this post are from that site. Additional graphs, charts and raw data can be found there. All charts above are clickable to go to the current version of the detail page the chart is from, which may contain more up to date information than the snapshots on this page, which were current as of the time of this post. Follow @ElectionGraphs on Twitter or like Election Graphs on Facebook to see announcements of updates or to join the conversation. For those interested in individual general election poll updates, follow @ElecCollPolls on Twitter for all the polls as they are added.
It is getting boring to keep saying “Republican getting stronger against Clinton”, but it is time for yet another update saying just that. As has been common lately, the Republican in question is Rubio, so lets look at these moves:
North Carolina
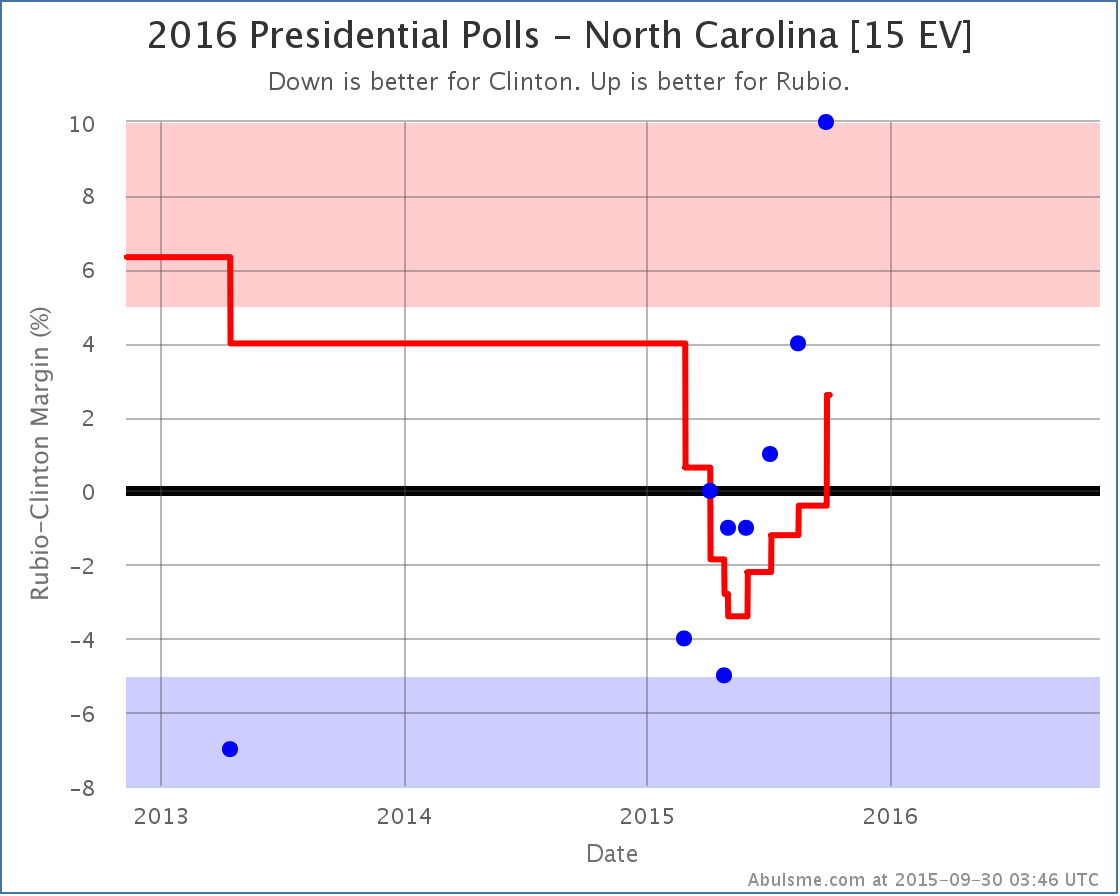
Look at that trend! It just gets worse and worse for Clinton. Every new poll in the last few months has been worse than the poll before. And with the latest, the average flips to Rubio’s side of the line.
North Carolina was never going to be a blow out for Clinton, but it was looking for awhile that she was in a good position to pull out a narrow win. That possibility seems to be evaporating quickly.
Michigan
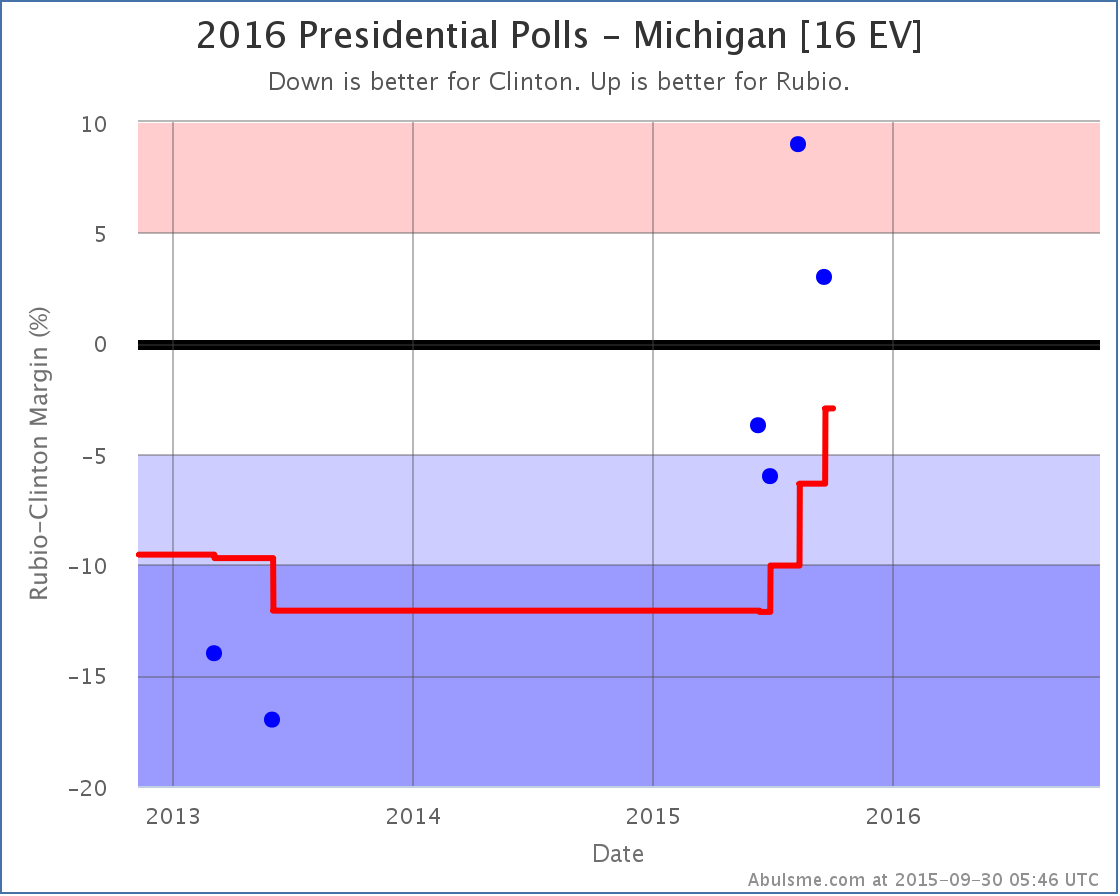
There are less polls to back it up, but the move in Michigan is potentially more dramatic. In a few months the average has gone from a strong Clinton lead, to Michigan essentially being a toss up.
Once again, not a good trend for Clinton. Michigan has not gone Republican since voting for George HW Bush in 1988. In 5 of those 6 elections the winning margin for the Democrats was over 5%. In two of them it was over 10%. A close Michigan means a Clinton in trouble.
National Overview
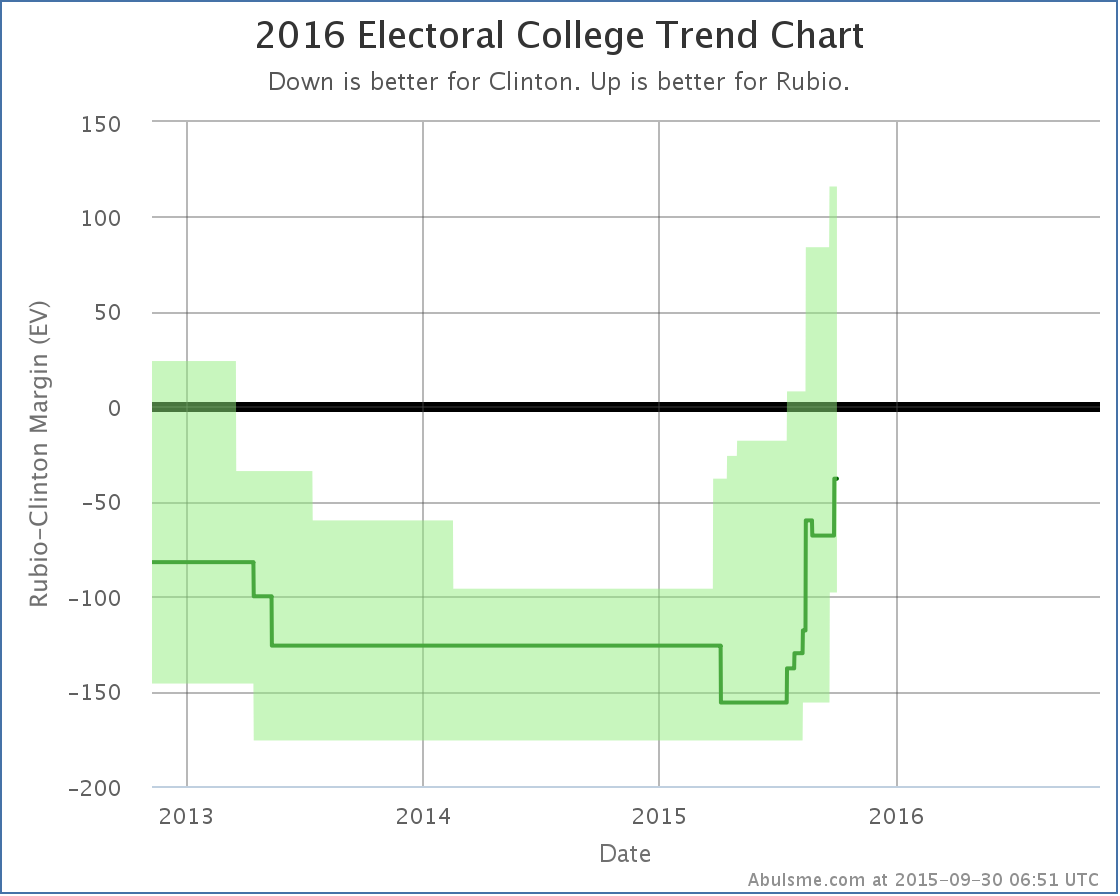
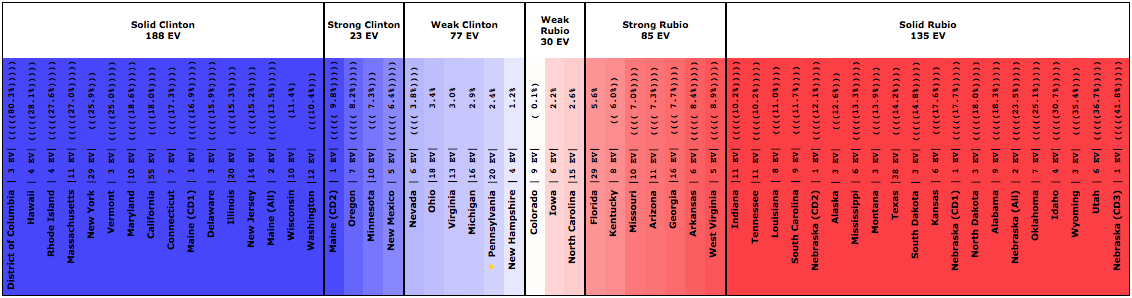
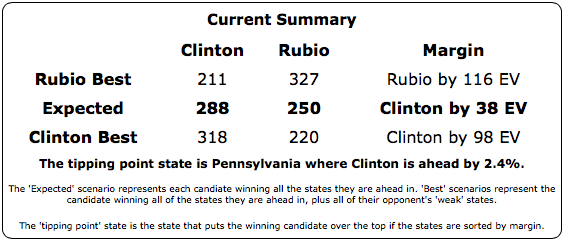
Yes, if everybody wins the states where they are leading in my poll average, Clinton still wins… barely. But there are a HUGE number of states where it is close. In this matchup, nine states are in play and the range of possible outcomes is very wide. Right now Rubio’s best case (if he sweeps all the close states) is actually better than Clinton’s best case (if she sweeps the close states).
Clinton still has an advantage here, but just by the slimmest of margins. There is a long way to the election, but for the moment, at least in the Clinton vs Rubio matchup, this is a close race…
Other Candidates
So Rubio is doing well against Clinton, and that is the only one of the five best polled candidate combinations with a change today, but a quick look at the comparison is still useful.
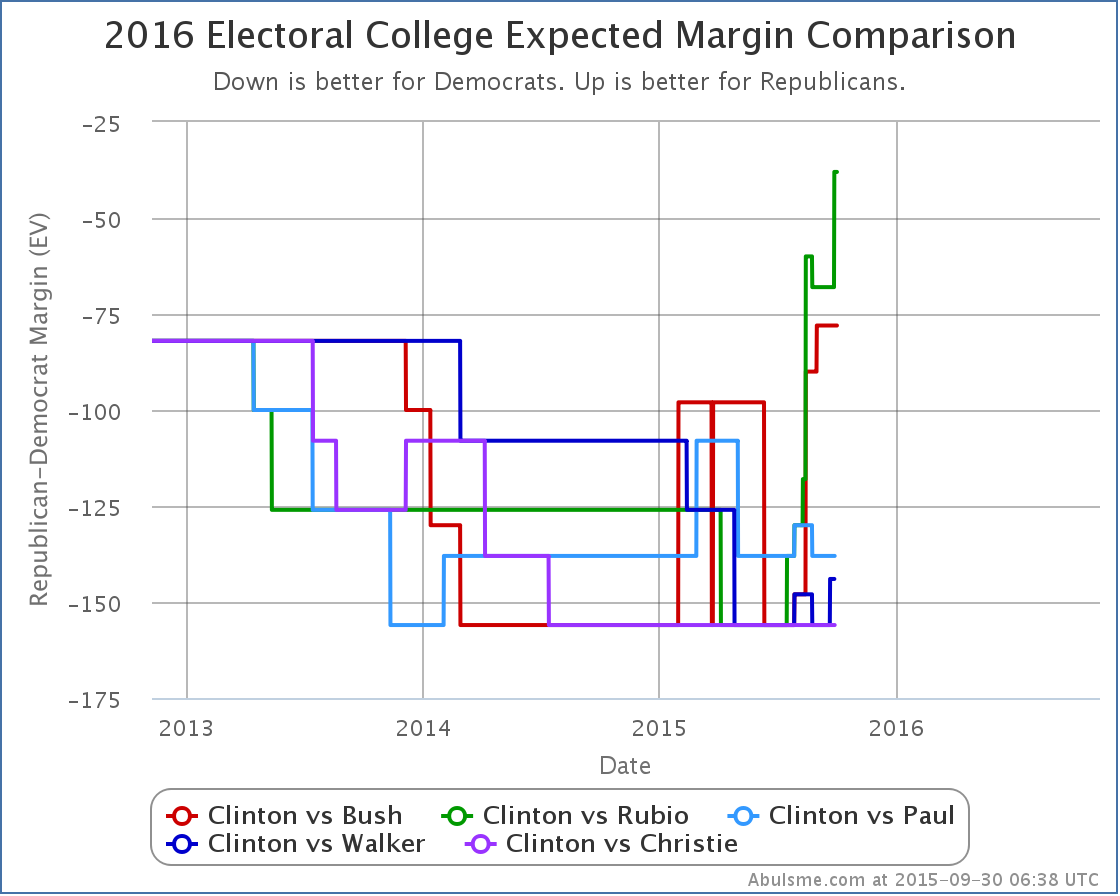
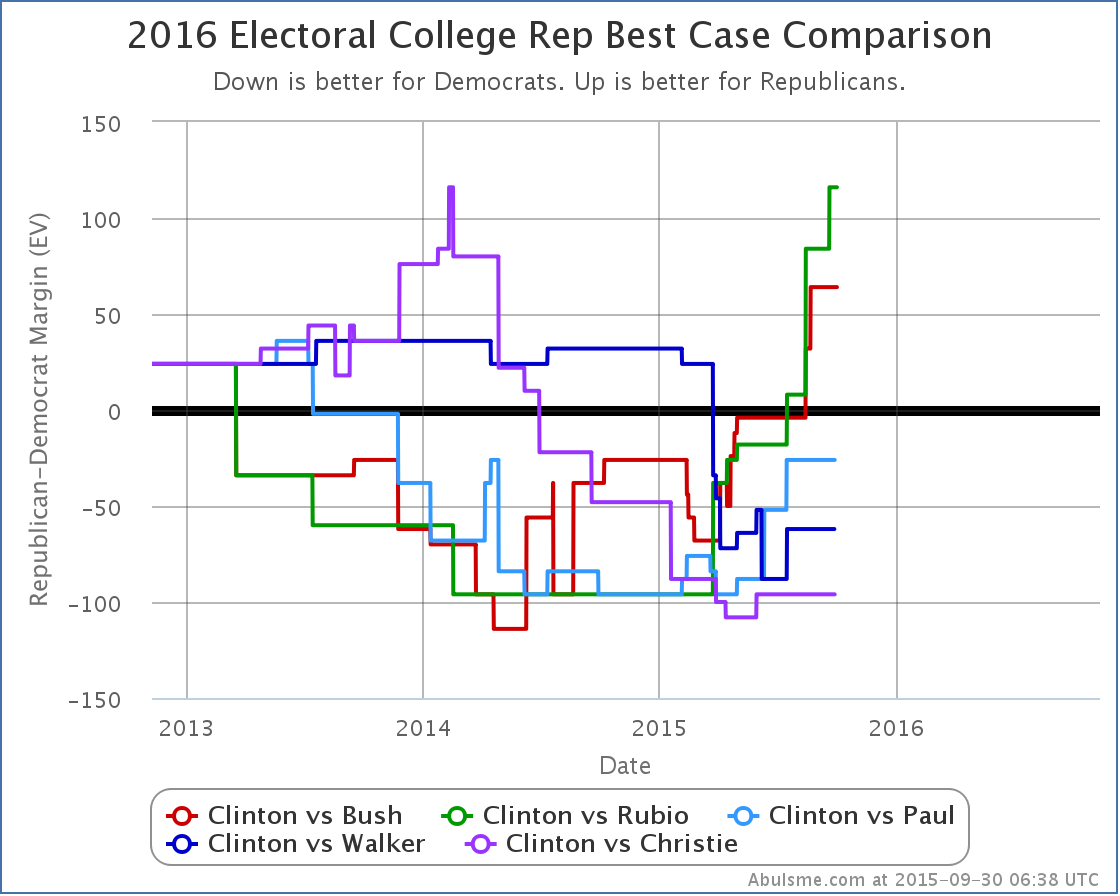
Highlighting these two comparisons specifically because of the Rubio changes today, but similar trends show up for the other comparisons. Of the five best polled combinations, Bush and Rubio are standing out and have been dramatically improving their positions vs Clinton. Paul, Walker and Christie… have not. At least not lately. Of course, Walker has already dropped out at this point, and Christie and Paul are on life support, with their national Real Clear Politics polling averages at 3% or less right now. So they just aren’t getting the attention… or the polling volume lately… of Bush and Rubio.
As I’ve mentioned before, other candidates are getting a lot more attention now, but they are still way behind these five in the arbitrary polling quality metric I use. They just haven’t had enough sustained polling to get a comparable picture yet. That will change if the folks like Trump and Carson and Fiorina remain viable and folks like Paul, Walker and Christie fade away. Same thing for Sanders and Biden. It just takes a bit of time to get enough good state polls to start paying serious attention to the results in an analysis like this.
405.1 days until polls start to close.
Note: This post is an update based on the data on ElectionGraphs.com. All of the charts and graphs seen here are from that site. Graphs, charts and raw data can be found there for the race nationally and in each state for every candidate combination that has been polled at the state level. In addition, comparisons of the best polled candidate combinations both nationally and each in each state are available. All charts above are clickable to go to the current version of the detail page the chart is from, which may contain more up to date information than the snapshots on this page, which were current as of the time of this post. Follow @ElecCollPolls on Twitter for specific poll details as I add them.
This week on the Curmudgeon’s Corner podcast, Sam is joined by guest cohost Bruce. Together they discuss the Volkswagen cheating debacle, the situation with Syria and Syrian refugees, and of course this week’s developments in the 2016 Presidential race. In the final lightning round they also cover the Super Moon Eclipse, the Fed’s interest rate decision, that kid who made the clock, and more!
Click to listen or subscribe… then let us know your own thoughts!

Recorded 2015-09-24
Length this week – 1:51:54
 1-Click Subscribe in iTunes 1-Click Subscribe in iTunes
 View Podcast in iTunes View Podcast in iTunes
 View Raw Podcast Feed View Raw Podcast Feed
 Download MP3 File Download MP3 File
 Follow the podcast on Facebook Follow the podcast on Facebook
Show Details:
- (0:00:10-0:10:38) But First
- No Ivan today, but we have Bruce
- This Week’s Agenda
- In House pre-School
- School Scheduling Craziness
- (0:11:40-0:26:02) Volkswagen Cheating
- What they did
- Possible Fixes
- Impact on VW
- What were they thinking?
- (0:26:41-0:48:13) Syria
- Refugee Crisis
- Turkish Connection
- What do you do?
- Russian Involvement
- Assad must go?
- Coordination with Russia
- (0:49:35-1:30:27) Election 2016
- Rand Paul
- The Xenophobic Racist Party
- Primary and Caucus Rules
- Carson on Muslims
- Walker Drops Out
- Republican Polling since the Second Debate
- Democratic Polling
- Deadlines for Shadow Candidates
- Clinton Declines
- More on Clinton Email
- (1:31:07-1:51:34) Lightning Round
- Super Moon Eclipse
- Queen Elizabeth Milestone
- Federal Reserve Interest Rate Decisions
- TV Show: Best of Carson
- Pope Visit / Chinese President Visit
- The kid who made the clock
On this week’s Curmudgeon’s Corner podcast, Sam and Ivan do it again, laying down a commentary track for the second Republican debate. Yes, the whole thing. All three hours of it. We kibitz as Trump and Carson and Bush and Cruz and Rubio and all the rest argue about the issues of the day. Oh, and of course, Fiorina. Ivan’s nemesis Fiorina. Ivan always has nice things to say about her. You’ve probably seen the debate, now listen to our take!
Click to listen or subscribe… then let us know your own thoughts!
Recorded 2015-09-18
Length this week – 3:13:32
1-Click Subscribe in iTunes
View Podcast in iTunes
View Raw Podcast Feed
Download MP3 File
Follow the podcast on Facebook
Show Details:
- (0:00:10-1:01:04) Debate Segment I
- Intro from Sam and Ivan
- Candidate Self-Introductions
- Trust Trump with Red Button?
- Outsiders vs Insiders
- Russia / Iran / China / Syria
- Should Kim Davis follow the law?
- Planned Parenthood and Government Shutdowns
- Fiorina’s Face
- (1:02:20-1:42:06) Debate Segment II
- Immigration
- Fiorina/Trump Business Records
- Tax Plans and Budgets
- Minimum Wage
- Political Styles
- (1:43:13-2:16:07) Debate Segment III
- Trump knowing Foreign Policy
- Would Jeb be a repeat of 41 and 43 on Foreign Policy?
- Iraq / Syria / Afghanistan
- Supreme Court / Abortion
- (2:16:46-2:42:24) Debate Segment IV
- Marijuana
- Guns
- Social Security
- Climate Change
- Vaccines and Autism
- (2:43:02-3:03:32) Debate Segment V
- Woman on the $10 bill
- Secret Service Codenames
- How will the world be different after your presidency?
- (3:04:33-3:13:12) Wrap Up
- Sam and Ivan predict the impact of the debate
Well, last time I noted the “First good news for Clinton in months!“. I mentioned then that one data point does not make a trend. And today, with the next change worth noting to the five best polled candidate combinations, we indeed don’t get more good news for Clinton. Instead, this time we get Iowa flipping to Bush:
Only two of the last five polls in Iowa show a Bush lead, but they both show big leads. When averaged out, you have a 1.4% Bush margin… and a trend which has been moving away from Clinton since February. If the moves toward Hillary in New Hampshire mentioned in that last post were the start of any bottoming out for Clinton, there is no evidence of it here in Iowa. Indeed, if anything, the trend away from Clinton seems to be accelerating.
In the national Bush vs Clinton view, Bush is now losing by 78 electoral votes in the “expected” case where each candidate wins every state where they lead the poll averages. Yes, this is still a loss, but it is better than Bush has done in this matchup since the start of polling for 2016.
Looking at how Bush is doing compared to the rest of the best polled Republicans, Rubio is still doing better against Clinton, but Bush isn’t far behind. Huckabee, Paul and Walker’s margins against Clinton are significantly worse. In this particular view, they aren’t really gaining on Clinton at all. This doesn’t give the full picture though, as a quick look at the tipping point shows:
Bottom line, despite the move in her direction last time, the overall trends continue to be against Clinton. When and if this deterioration stops, and how that affects the primary races, is the big question of the campaign at the moment.
428.1 days until the first general election polls close.
Note: This post is an update based on the data on ElectionGraphs.com. All of the charts and graphs seen here are from that site. Graphs, charts and raw data can be found there for the race nationally and in each state for every candidate combination that has been polled at the state level. In addition, comparisons of the best polled candidate combinations both nationally and each in each state are available. All charts above are clickable to go to the current version of the detail page the chart is from, which may contain more up to date information than the snapshots on this page, which were current as of the time of this post. Follow @ElecCollPolls on Twitter for specific poll details as I add them.
I’ve mentioned a number of times at this point that Clinton has had a long streak of bad news. The last time one of my updates was unambiguously positive for Clinton was back in May! That streak ends today, with movement in New Hampshire prompted by a new PPP poll.
Three of the top five best polled candidate combinations flipped from “Weak Republican” to “Weak Clinton” because of this update:
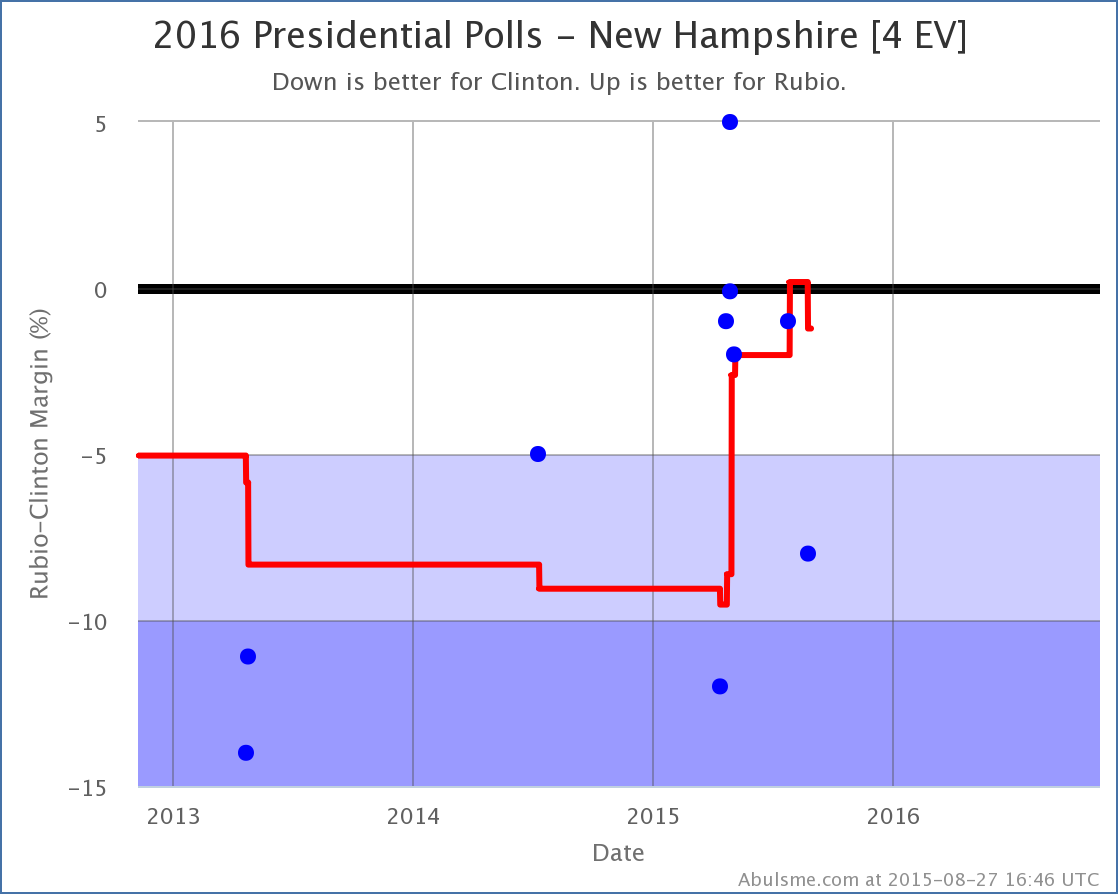
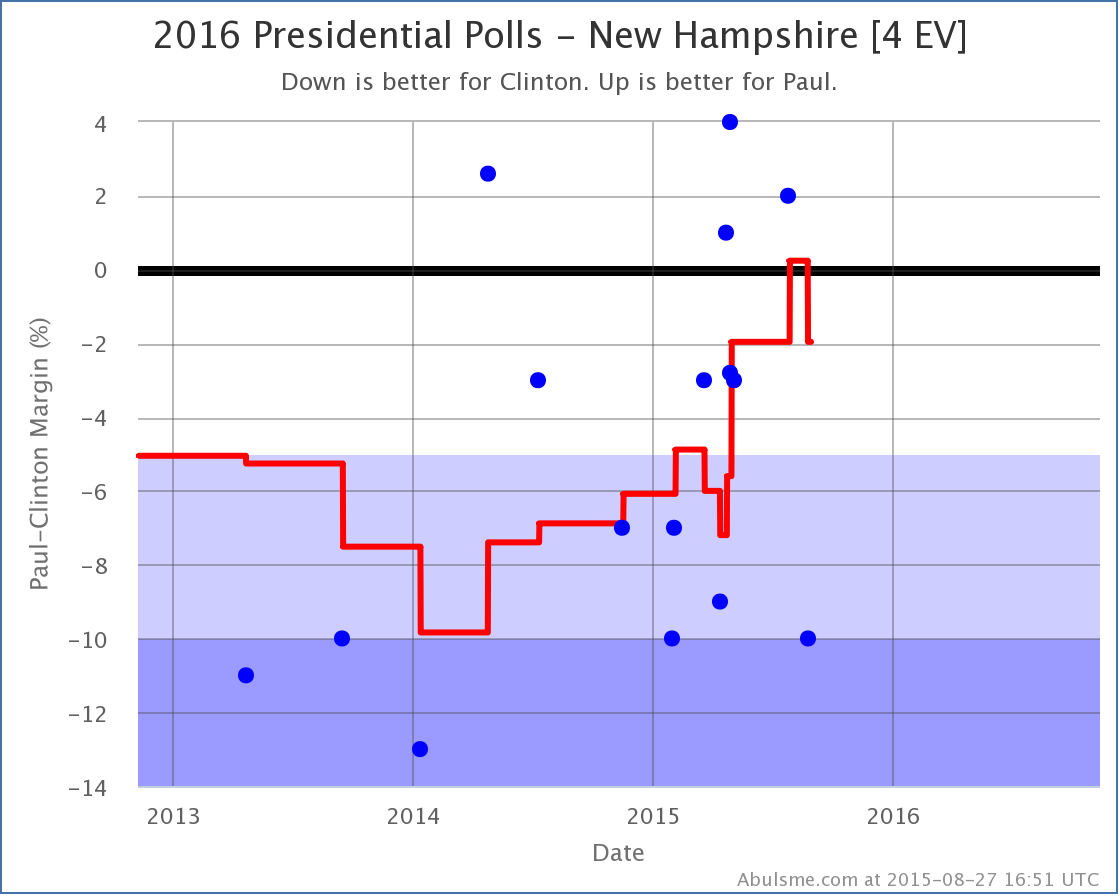
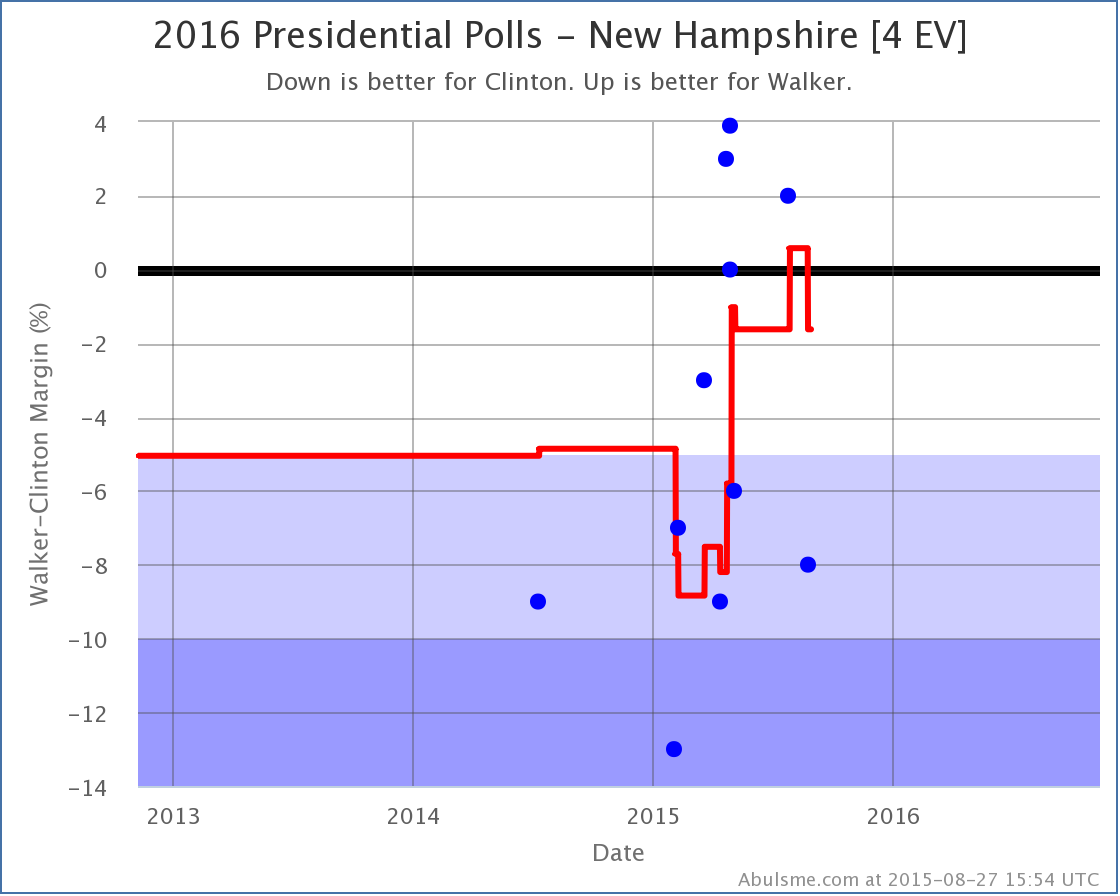
So for Rubio, Paul and Walker, New Hampshire flips back to blue (although not by much). Clinton vs Bush just narrowly avoided doing the same thing, as Bush’s margin declined from 1.6% to 0.2%, but didn’t quite pass over the line.
New Hampshire is a little state. Only 4 electoral votes. If you look at the “expected cases” this just makes a small move for each of these three candidates:
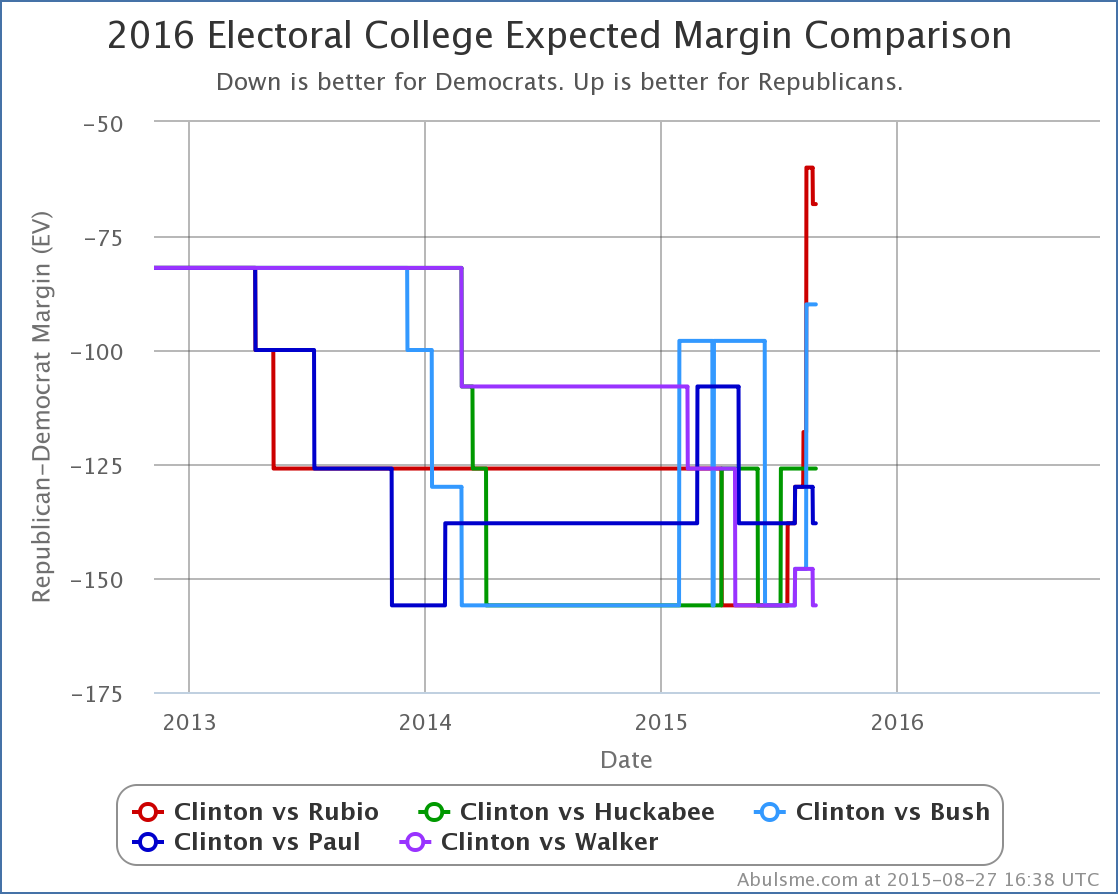
As a move, this isn’t all that much. And Clinton is significantly ahead on this metric against all five Republicans. So New Hampshire’s electoral votes aren’t determining the outcome here.
But after three months solid of posts where I’ve been talking about how the Republican position is getting stronger, and Clinton’s position was getting weaker, is there significance to a move, any move, actually going in Clinton’s direction? Well, maybe. But one point does not make a trend.
This could be an indicator that Clinton has bottomed for now and we’re not going to see further declines for the time being. Or, just as easily, perhaps these PPP results are a significant outlier, and not representative of an actual change of mood in New Hampshire, in which case the next New Hampshire polls may pull the state back into the red zone.
As usual, we will just have to wait and see. In the meantime though, Clinton’s losing streak has been broken.
493.0 days until polls start closing.
Note: This post is an update based on the data on ElectionGraphs.com. All of the charts and graphs seen here are from that site. Graphs, charts and raw data can be found there for the race nationally and in each state for every candidate combination that has been polled at the state level. In addition, comparisons of the best polled candidate combinations both nationally and each in each state are available. All charts above are clickable to go to the current version of the detail page the chart is from, which may contain more up to date information than the snapshots on this page, which were current as of the time of this post. Follow @ElecCollPolls on Twitter for specific poll details as I add them.
This week on the Curmudgeon’s Corner podcast Sam discusses his fever addled trip home from last week’s vacation, then Sam and Ivan settle in to discuss Election 2016, first the Democrats, then the Republicans. We cover everything from Larry Lessig and Al Gore, to Clinton emails, Bush on Iraq, birthright citizenship and what happens if Trump actually wins.
Recorded 2015-08-21
Length this week – 1:30:58
1-Click Subscribe in iTunes
View Podcast in iTunes
View Raw Podcast Feed
Download MP3 File
Follow the podcast on Facebook
Show Details:
- 0:00:10 – 0:24:53: But First
- Some Walking
- Positive Buzz
- Sick Traveler
- 0:25:55 – 0:54:40: Election 2016 – Democrats
- Larry Lessig PR Stunt
- Al Gore trial balloon
- Clinton drops below 50%!
- Will Joe Biden run?
- Clinton email again
- 0:55:25 – 1:30:39: Election 2016- Republicans
- Paul Staffer Legal Trouble
- Bush Foreign Policy Speech
- Birthright citizenship / Immigration
- Trump driving away potential Republican voters?
- Trump vs Klum
- Other Republicans sucking up to Trump?
- Trump Base Expanding?
- Scenarios where Trump wins the nomination
- Bush money drying up?
Two sets of changes worth noting today triggered by new PPP polls in Iowa and Missouri. The streak of changes going against Clinton and in favor of the various Republicans continues. As I mentioned before, the last time one of my updates was unequivocally good news for Clinton was in May!
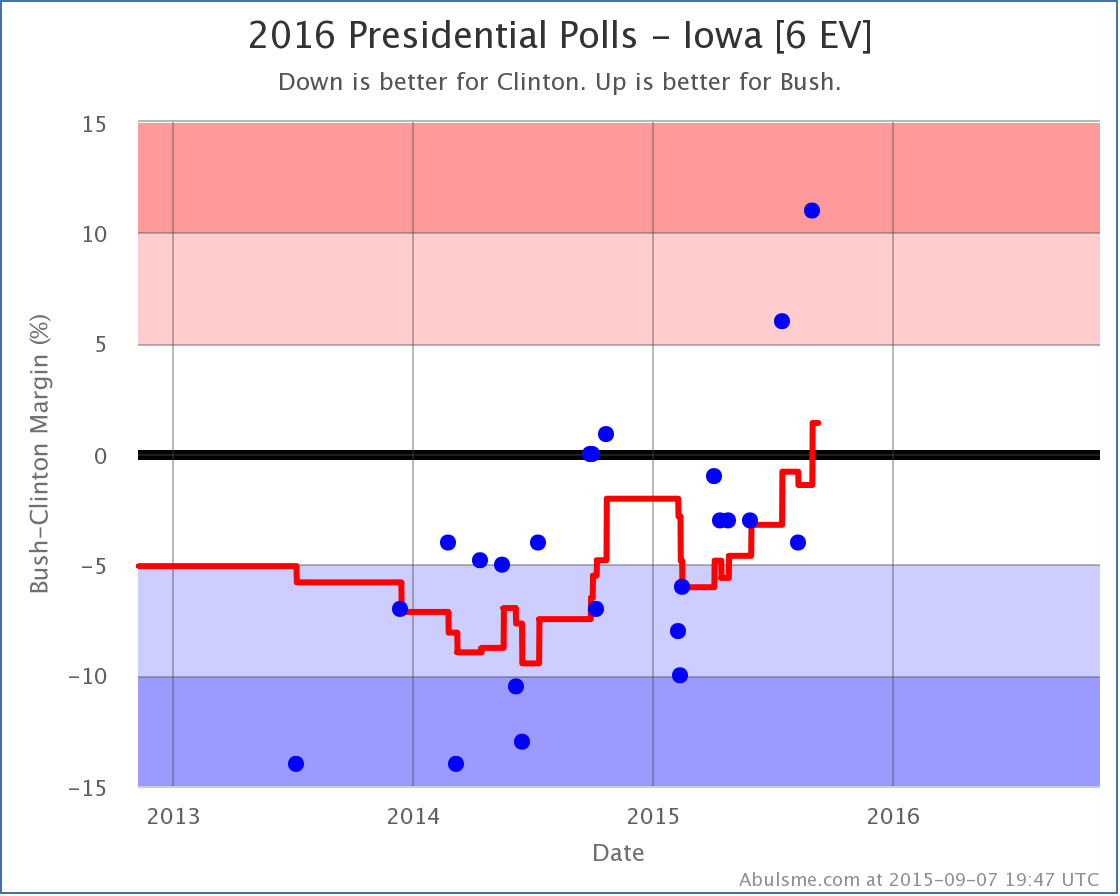
Iowa
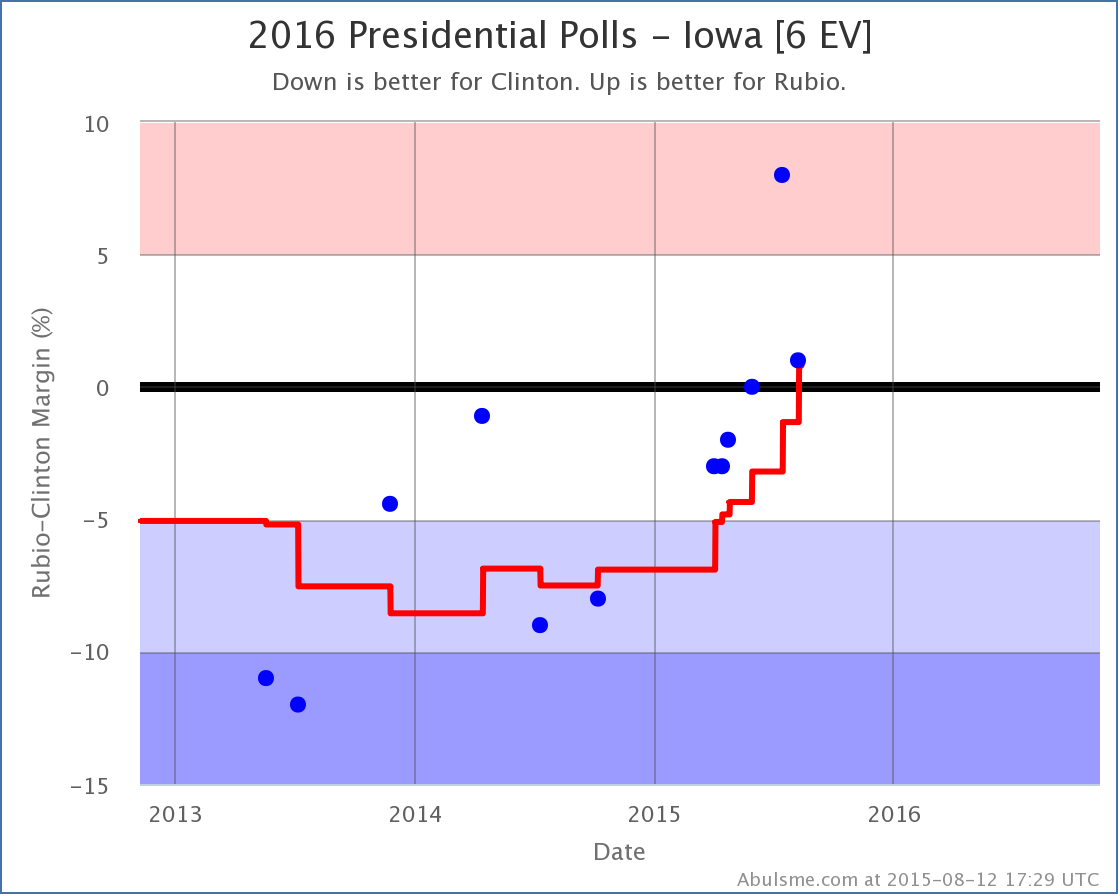
The July Qunnipiac Poll showing Rubio with an 8% is looking kind of like an outlier, and without it we wouldn’t be quite there yet, but there has been a clear trend toward Rubio in the average going back a year. With the newest poll (plus that possible outlier) the average moves from “Weak Clinton” to “Weak Rubio”. This changes the “expected” result in this matchup:
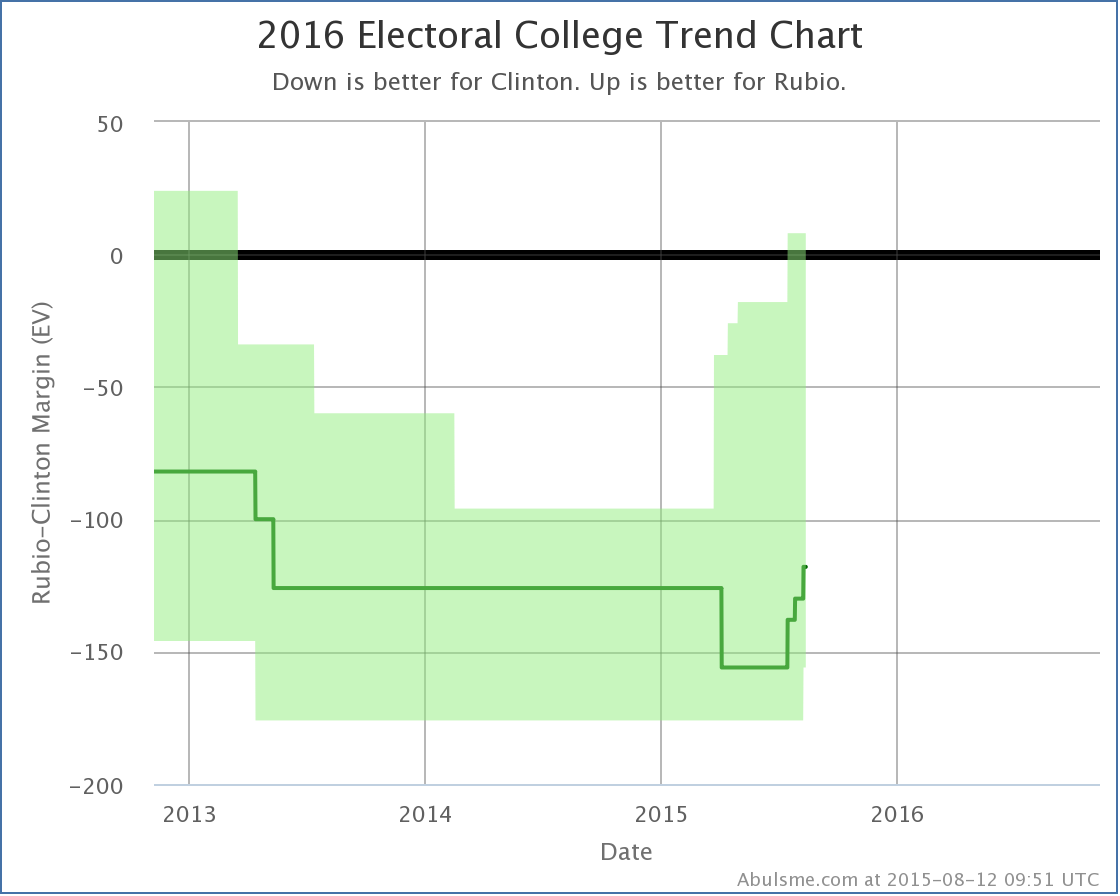
The expected result is now Clinton 328 to Rubio 210, which is a 118 electoral point loss by Rubio. Now, while this is still of course a significant loss, it is significant because it beats Romney’s 126 electoral vote loss against Obama in 2012. The last time one of the five best polled candidate combinations had the Republican outperforming Romney was back in June when Bush had pulled his expected loss down to only 98 electoral votes.
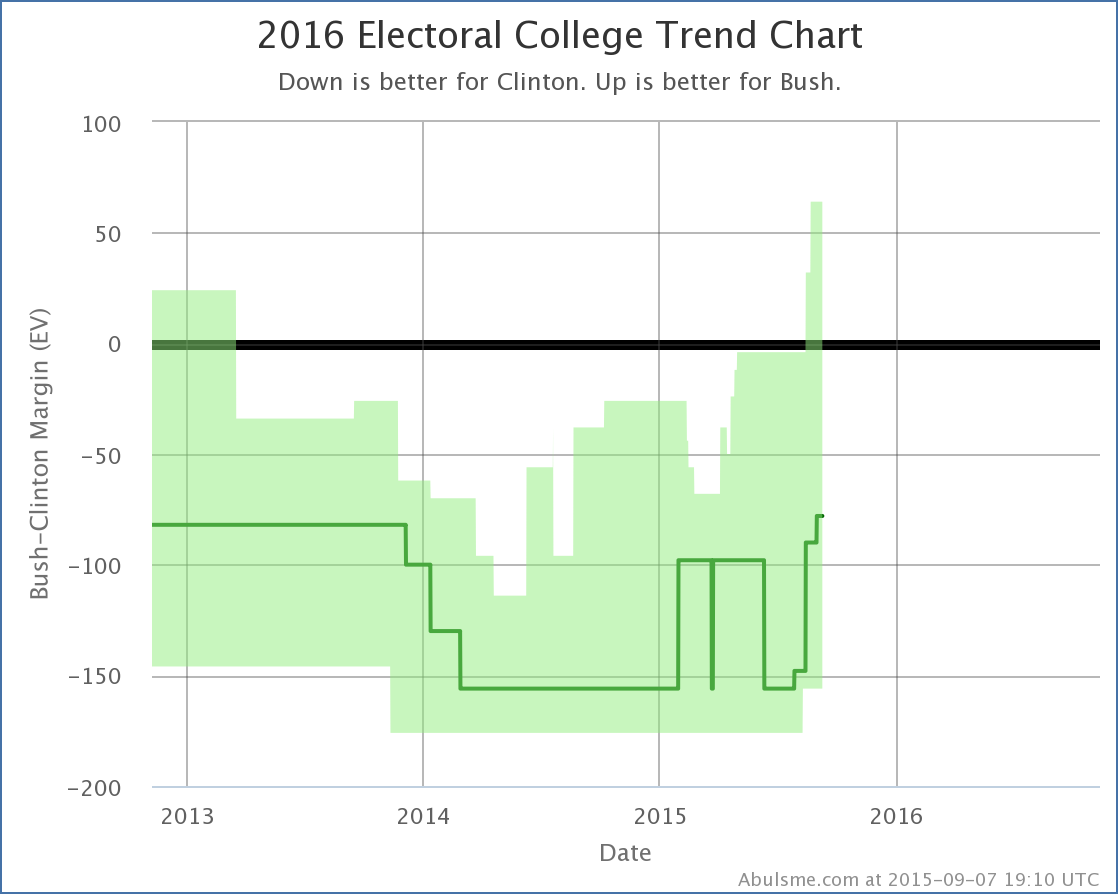
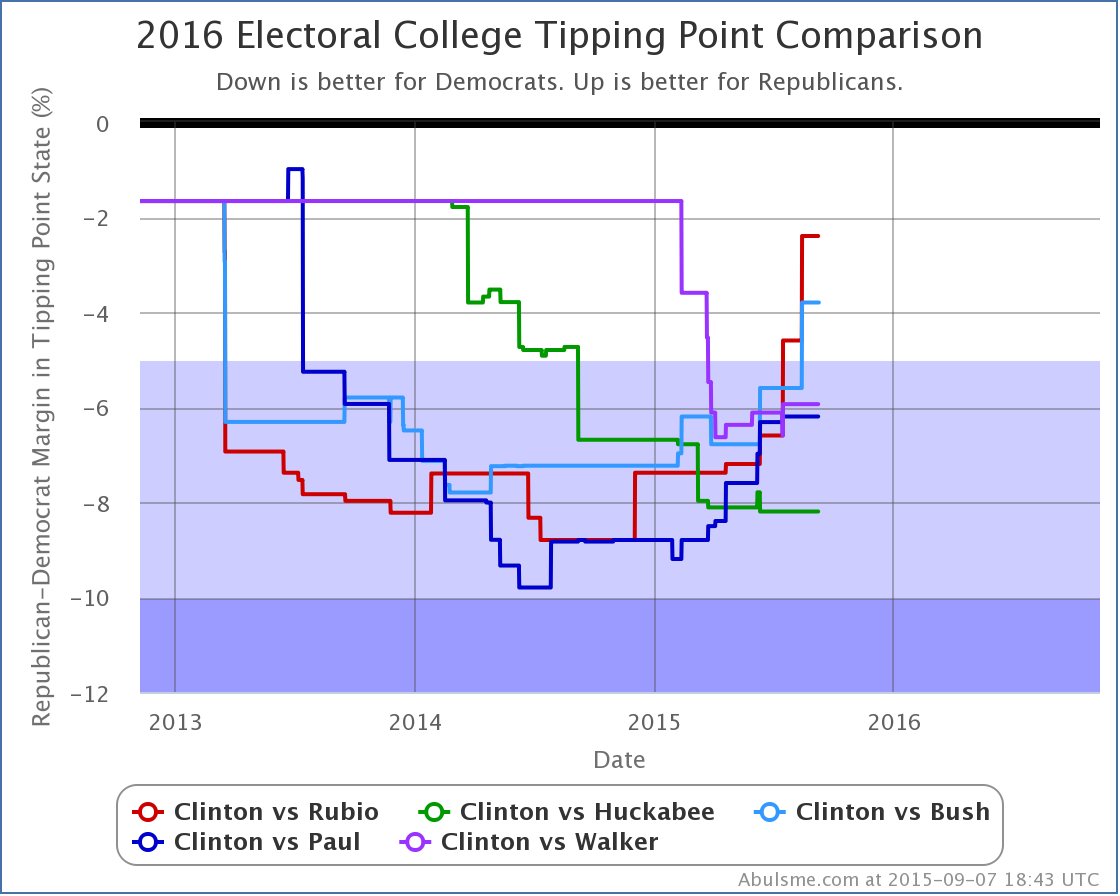
While there has been a general drumbeat of bad news for Clinton in my updates for the last three months, this particular chart doesn’t yet show an clear and indisputable breakout move beyond the range where these candidates have been bouncing around. If you only look at the changes since June, it starts to look like a trend though, and given the movement in other metrics, it is still reasonable to interpret this as a bad trend for Clinton.
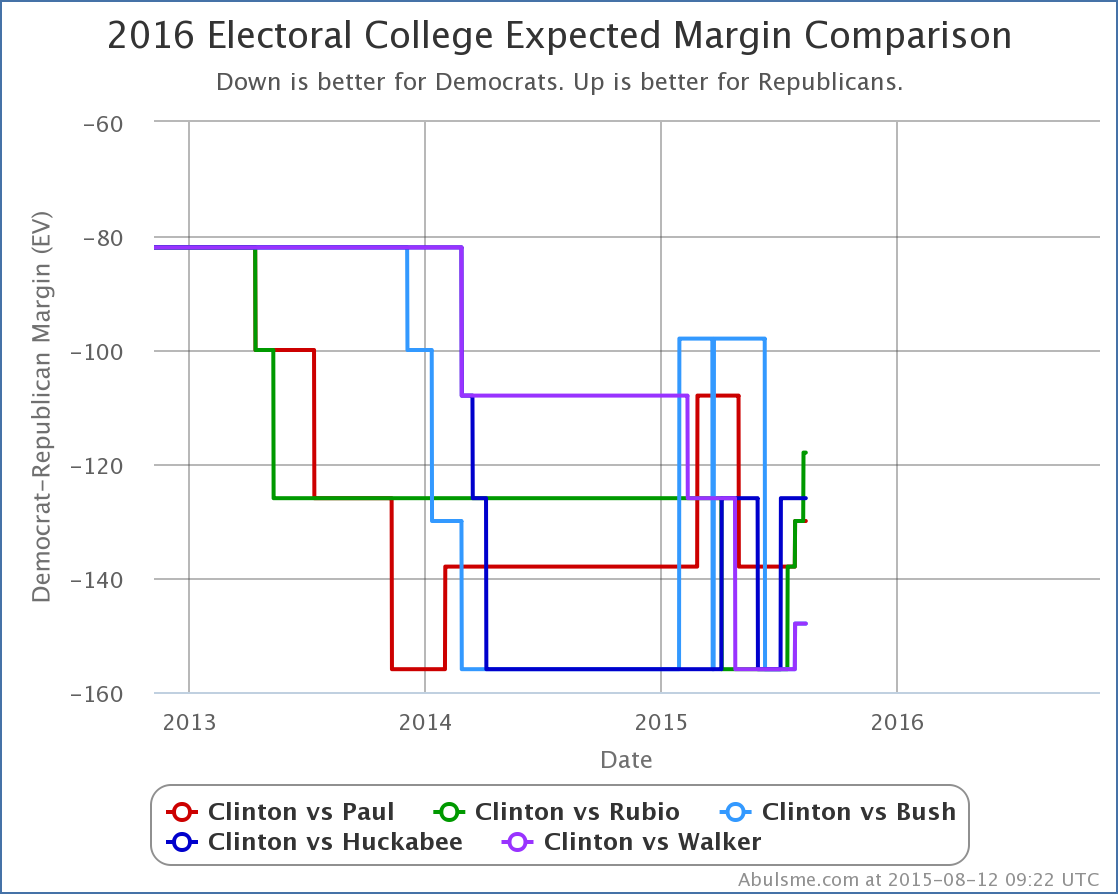
The question though will be if the Republicans can start an actual breakout move where instead of talking about how it looks like they might beat Romney, we start talking about how it looks like they might beat Clinton. We aren’t close to that yet.
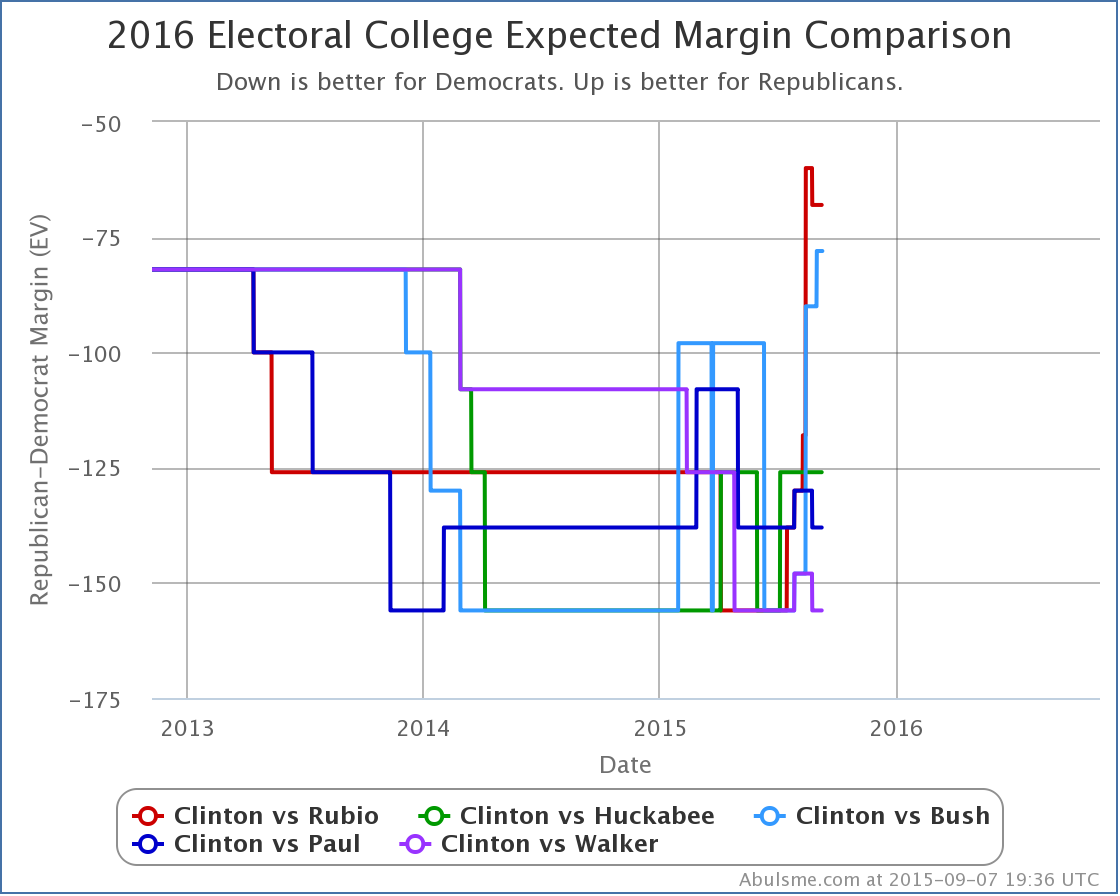
One thing people have been speculating about has been if the prominence of Trump on the Republican side right now is actually harming the party overall, specifically in terms of the ability of the other candidates to compete against Clinton. So far, there is no evidence for that at all in the numbers we track here.
Missouri
When I officially launched the election tracking site and posted my first analysis for 2016 I mentioned that if you looked at the average results for the last five general elections… the data I used to “seed” the analysis before there were actual state polls… there were only SIX states where the average margin in these five elections was less than 5%. They were Nevada (Dem+2.8%), Ohio (Dem+1.7%), Florida (Dem+0.9%), Colorado (Rep+0.0%), Virginia (Rep+1.6%) and Missouri (Rep+2.8%). All of these states were polled long ago, some many times… except Missouri. Today’s PPP poll is the first 2016 polling for Missouri that I am aware of. So finally, we get a current view of the state.
Missouri was basically on this “Close State” list because Bill Clinton won the state by 6.3% in 1996, the oldest of the five elections I used for the initial average. Since then the Republicans won by 3.3%, 7.2%, 0.1%, and 9.4%. OK, that 0.1% in 2008 was really close. And the 3.3% in 2000 wasn’t a complete blow out. But in general it seems like the trend has been redder in Missouri.
The new poll tested Clinton against 11 different Republicans. She lost by between 7% and 15% depending on which Republican you looked at. (They also tested Sanders against 4 Republicans with similar results.)
Bottom line, looks like 2016 is looking a lot more like 2012 or 2004 than 2008 or 2000. That is, a pretty strongly Republican state. Now, it is just one poll, but the results are strong enough that the state immediately moved from “Weak Republican” to “Strong Republican” for all five of the best polled candidate combinations. (And actually for all the rest of the combinations they polled too.)
The chart of this isn’t actually all that interesting on a state level. But Missouri no longer being a close state means that Clinton’s “best case” against all five Republicans weakens a little bit, so lets have a quick look at that graph:
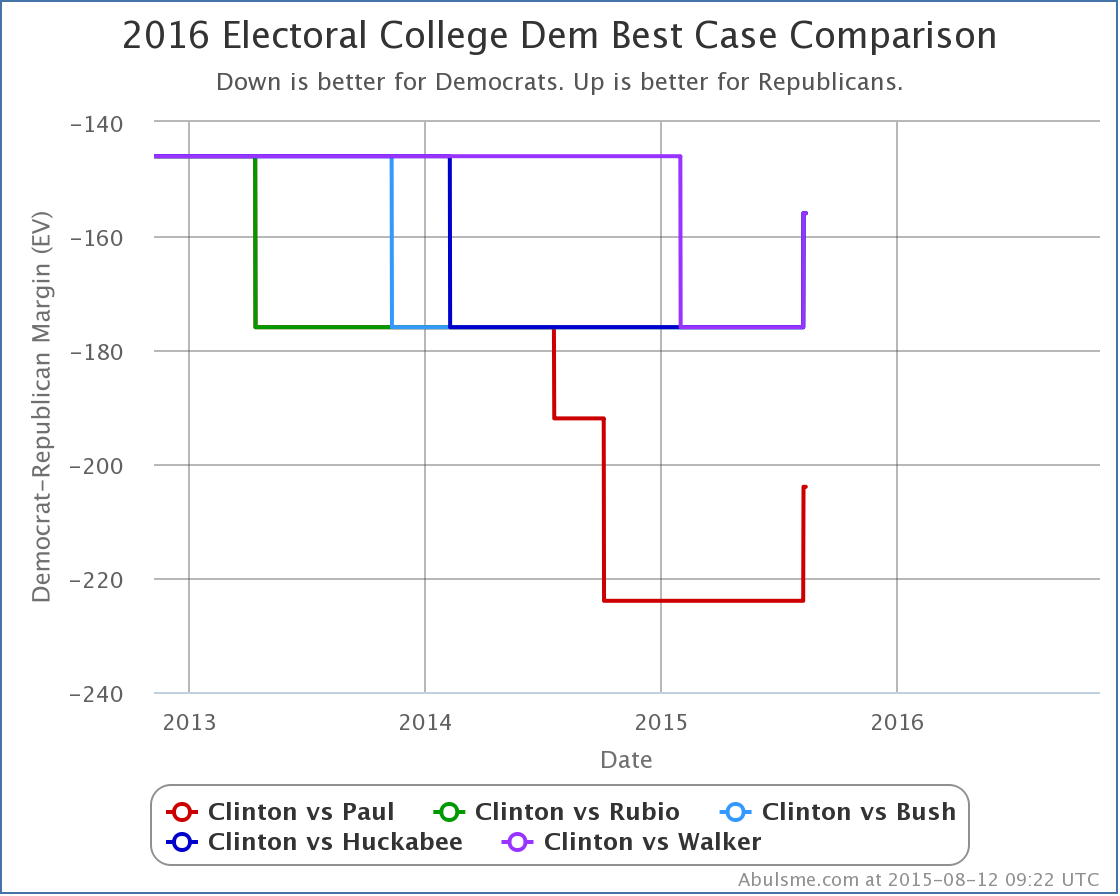
You don’t see a lot of volatility in this chart, simply because there are a lot fewer polls of the states that make a difference here. You see a lot of polls around the tipping point, and around the states that are really close, because they give insight into if the Republicans are catching up. Given the current state of Clinton’s lead, polling of the states Republicans are generally already ahead in only gives insight into how much extra Clinton could win by if everything possible went her way, which is fundamentally less interesting.
Never the less, with Missouri’s 10 electoral votes out of play at the moment, Clinton’s best case margin drops by 20 electoral votes against all these candidates. In the case where she wins all the states she is ahead in, plus all the states where the Republican currently leads by less than 5%, she now beats Paul by 204 electoral votes. Rubio, Bush, Huckabee and Walker get beaten by a more modest 156 electoral votes. These are of course pretty good margins in today’s polarized electorate. But to get to these kinds of numbers, just about everything would have to go Clinton’s way… which is not the trend today.
But of course, we have 454.2 days until the election. Lots can change in 454.2 days. :-)
Best Polled List
I should also mention that the “best polled” list got shuffled a bit with the latest updates. Clinton vs Paul once again grabs the “best polled” spot and becomes the default view on election2016.abulsme.com. Meanwhile Clinton vs Christie drops to 6th place and out of the group we highlight here, replaced by Clinton vs Huckabee returning to the top five after a short absence. Clinton vs Huckabee is just barely out of the top 5, but any other candidate combinations are far behind in terms of the volume and breadth of available polling on the state level at the moment. We’re currently giving the most attention here to Clinton vs Paul, Rubio, Bush, Huckabee and Walker.
Note: This post is an update based on the data on my 2016 Electoral College Analysis Site. All of the charts and graphs seen here are from that site. Graphs, charts and raw data can be found there for the race nationally and in each state for every candidate combination that has been polled at the state level. In addition, comparisons of the best polled candidate combinations both nationally and each in each state are available. All charts above are clickable to go to the current version of the detail page the chart is from, which may contain more up to date information than the snapshots on this page, which were current as of the time of this post. Follow @ElecCollPolls on Twitter for specific poll details as I add them.
|
|