This is the website of Abulsme Noibatno Itramne (also known as Sam Minter).
Posts here are rare these days. For current stuff, follow me on Mastodon
|
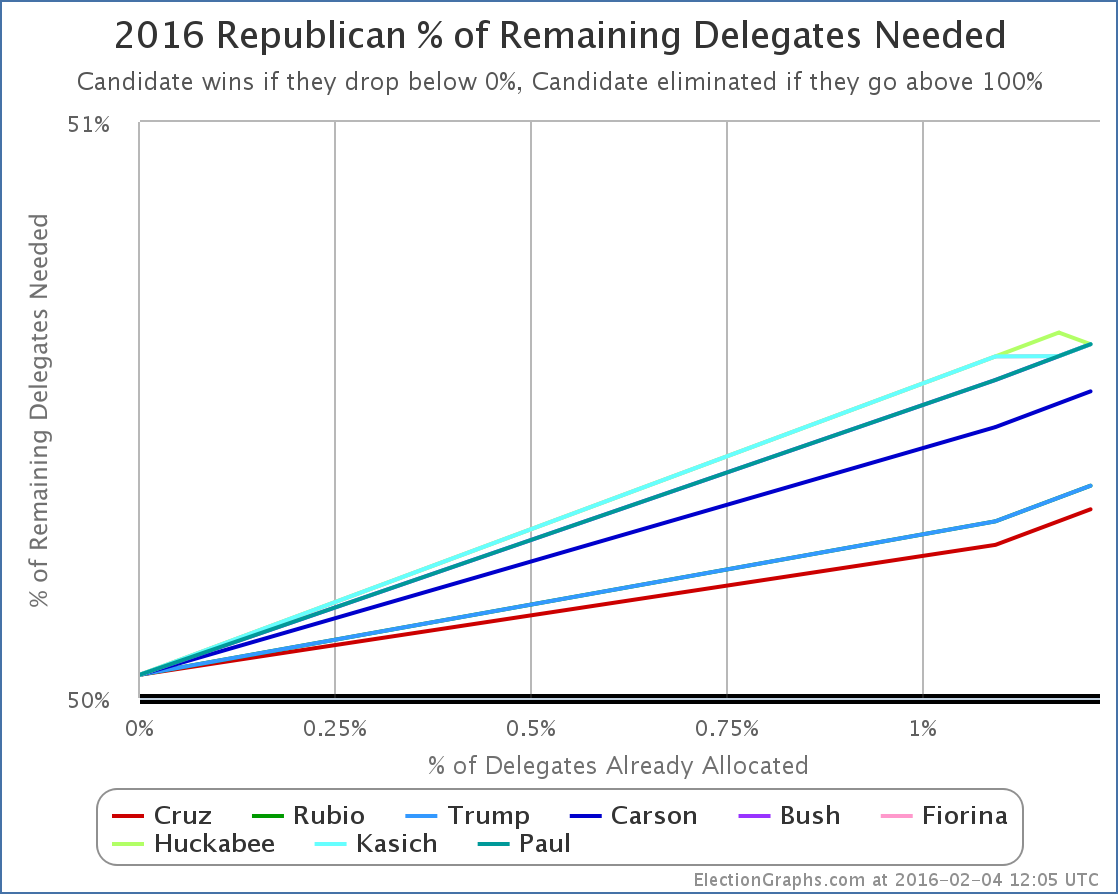
The Iowa results on the Republican side were officially certified on Wednesday, earlier than anybody expected, and with a surprise. Almost every source believed 27 delegates would be decided by the caucus results, but the remaining 3 “automatic delegates” who are party leaders, would attend the convention unbound and able to support whoever they wished. But it looks like those three delegates will be bound by the caucus results as well.
When you do the required math on 30 delegates instead of 27, everything remains the same, except Huckabee gets a delegate too.
Updating the chart showing the “% of remaining needed to win” graph:
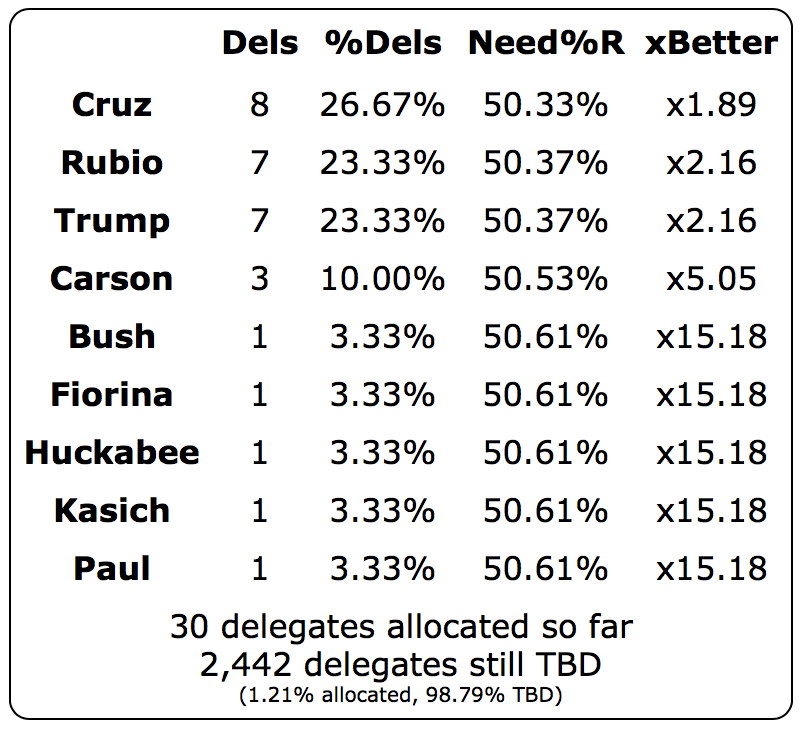
And the raw numbers:
Huckabee and Paul have suspended their campaigns, but since these are bound delegates, they keep them unless the candidates officially release them. I haven’t seen a report of that yet, so won’t remove them from the list at this point. Not that it matters much for single delegates. This is a much more important factor when candidates drop out later in the race once they have already accumulated a significantly sized chunk of delegates.
Huckabee’s one delegate makes no difference to the analysis I posted Tuesday or the follow up from Wednesday.
We still have three candidates showing strength going into New Hampshire It is within the realm of possibility that New Hampshire will add a fourth to that list, but just as likely it will solidify the “three way race” picture. And as I outlined in the Wednesday post the specific New Hampshire delegate rules matter a lot. Specifically the rules essentially give extra bonus delegates to the winner, and don’t allow delegates at all for anyone coming in under 10%. This is a recipe to transform a plurality win to a healthy delegate majority.
So if you are watching the polls as they start to include post-Iowa data, watch carefully not only who is in the lead, but exactly who is above or below the 10% threshold, because that will make a huge difference in the delegate counts.
And an 8-7-7 split with only 1.21% of delegates determined is essentially a tie. And a tie that will soon be overwhelmed numerically by the results from New Hampshire and beyond. So don’t get sucked too deeply into the spin from all quarters taking about who is up and who is doomed. It is still too early for that. (Well, at least if you don’t drop out.)
Five days until New Hampshire.
Note: This post is an update based on the data on ElectionGraphs.com. Election Graphs tracks both a poll based estimate of the Electoral College and a numbers based look at the Delegate Races. All of the charts and graphs seen in this post are from that site. Additional graphs, charts and raw data can be found there. All charts above are clickable to go to the current version of the detail page the chart is from, which may contain more up to date information than the snapshots on this page, which were current as of the time of this post. Follow @ElectionGraphs on Twitter or like Election Graphs on Facebook to see announcements of updates or to join the conversation. For those interested in individual general election poll updates, follow @ElecCollPolls on Twitter for all the polls as they are added.
On this week’s Curmudgeon’s Corner podcast, Sam and Ivan do it again, laying down a commentary track for the second Republican debate. Yes, the whole thing. All three hours of it. We kibitz as Trump and Carson and Bush and Cruz and Rubio and all the rest argue about the issues of the day. Oh, and of course, Fiorina. Ivan’s nemesis Fiorina. Ivan always has nice things to say about her. You’ve probably seen the debate, now listen to our take!
Click to listen or subscribe… then let us know your own thoughts!

Recorded 2015-09-18
Length this week – 3:13:32
 1-Click Subscribe in iTunes 1-Click Subscribe in iTunes
 View Podcast in iTunes View Podcast in iTunes
 View Raw Podcast Feed View Raw Podcast Feed
 Download MP3 File Download MP3 File
 Follow the podcast on Facebook Follow the podcast on Facebook
Show Details:
- (0:00:10-1:01:04) Debate Segment I
- Intro from Sam and Ivan
- Candidate Self-Introductions
- Trust Trump with Red Button?
- Outsiders vs Insiders
- Russia / Iran / China / Syria
- Should Kim Davis follow the law?
- Planned Parenthood and Government Shutdowns
- Fiorina’s Face
- (1:02:20-1:42:06) Debate Segment II
- Immigration
- Fiorina/Trump Business Records
- Tax Plans and Budgets
- Minimum Wage
- Political Styles
- (1:43:13-2:16:07) Debate Segment III
- Trump knowing Foreign Policy
- Would Jeb be a repeat of 41 and 43 on Foreign Policy?
- Iraq / Syria / Afghanistan
- Supreme Court / Abortion
- (2:16:46-2:42:24) Debate Segment IV
- Marijuana
- Guns
- Social Security
- Climate Change
- Vaccines and Autism
- (2:43:02-3:03:32) Debate Segment V
- Woman on the $10 bill
- Secret Service Codenames
- How will the world be different after your presidency?
- (3:04:33-3:13:12) Wrap Up
- Sam and Ivan predict the impact of the debate
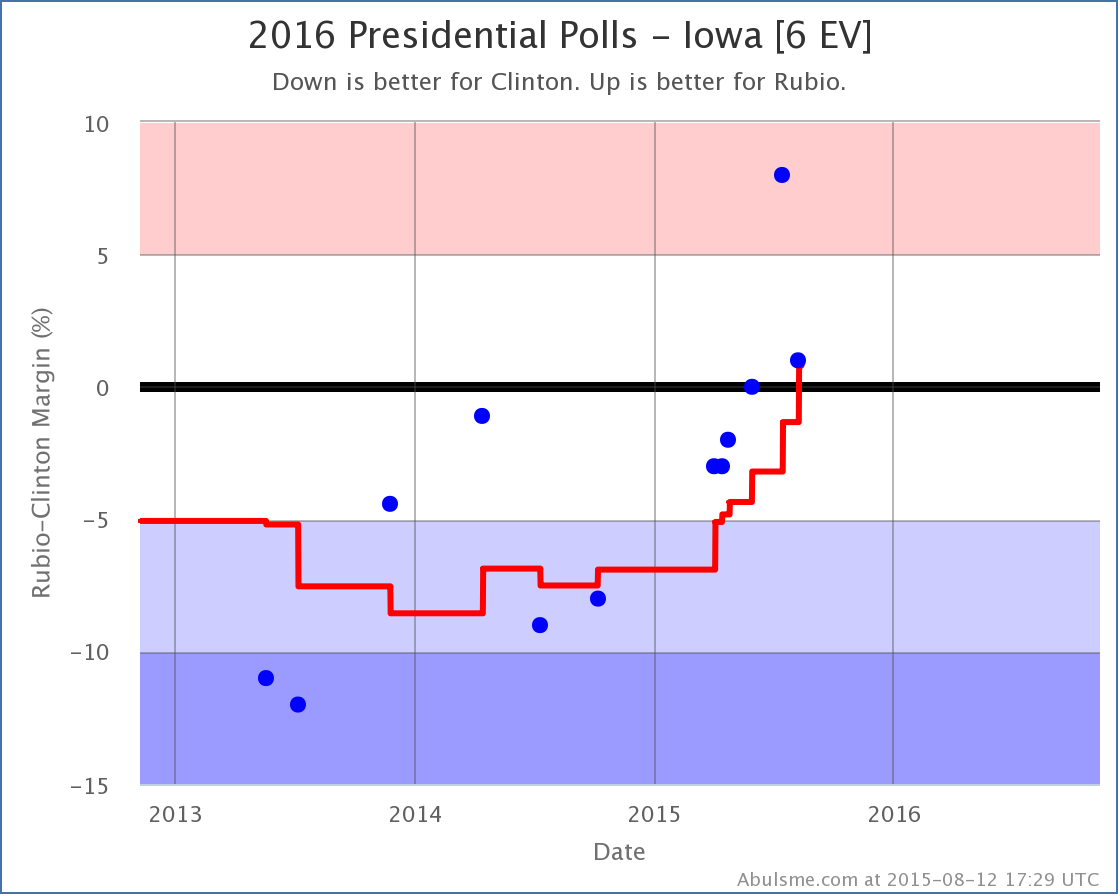
Well, last time I noted the “First good news for Clinton in months!“. I mentioned then that one data point does not make a trend. And today, with the next change worth noting to the five best polled candidate combinations, we indeed don’t get more good news for Clinton. Instead, this time we get Iowa flipping to Bush:
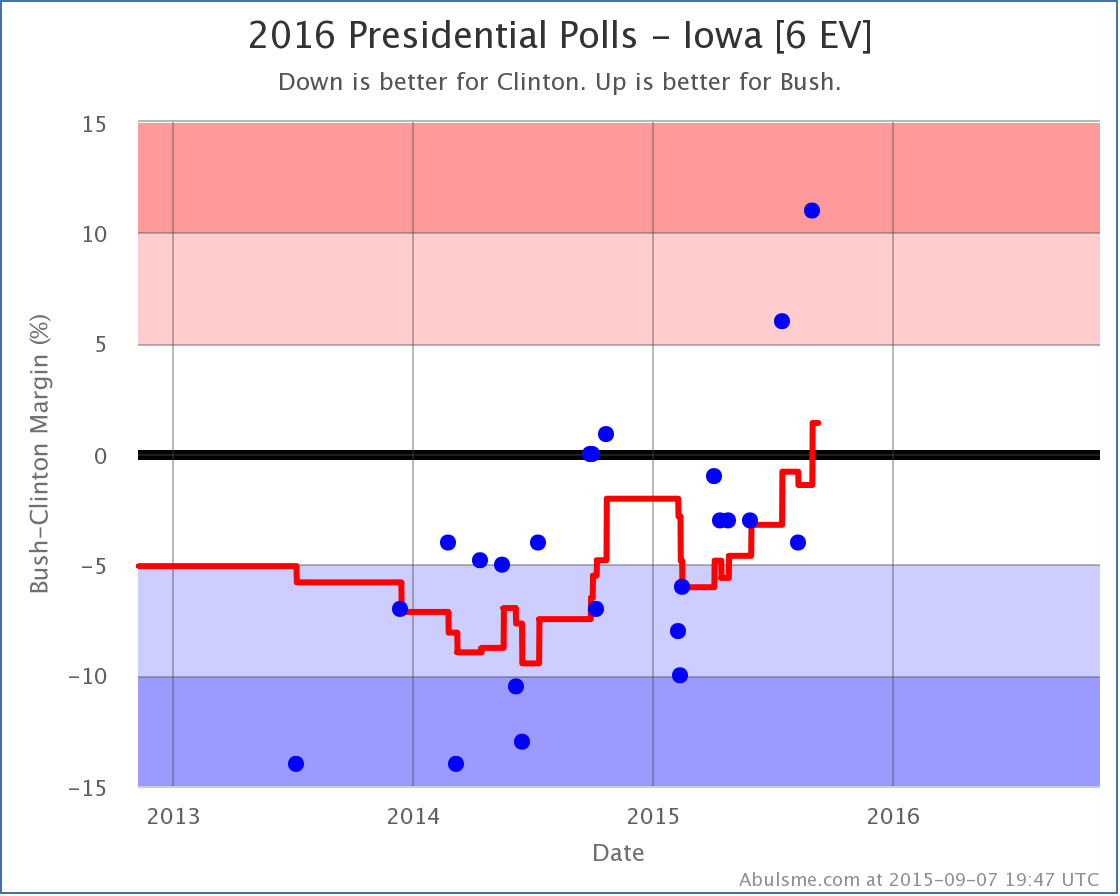
Only two of the last five polls in Iowa show a Bush lead, but they both show big leads. When averaged out, you have a 1.4% Bush margin… and a trend which has been moving away from Clinton since February. If the moves toward Hillary in New Hampshire mentioned in that last post were the start of any bottoming out for Clinton, there is no evidence of it here in Iowa. Indeed, if anything, the trend away from Clinton seems to be accelerating.
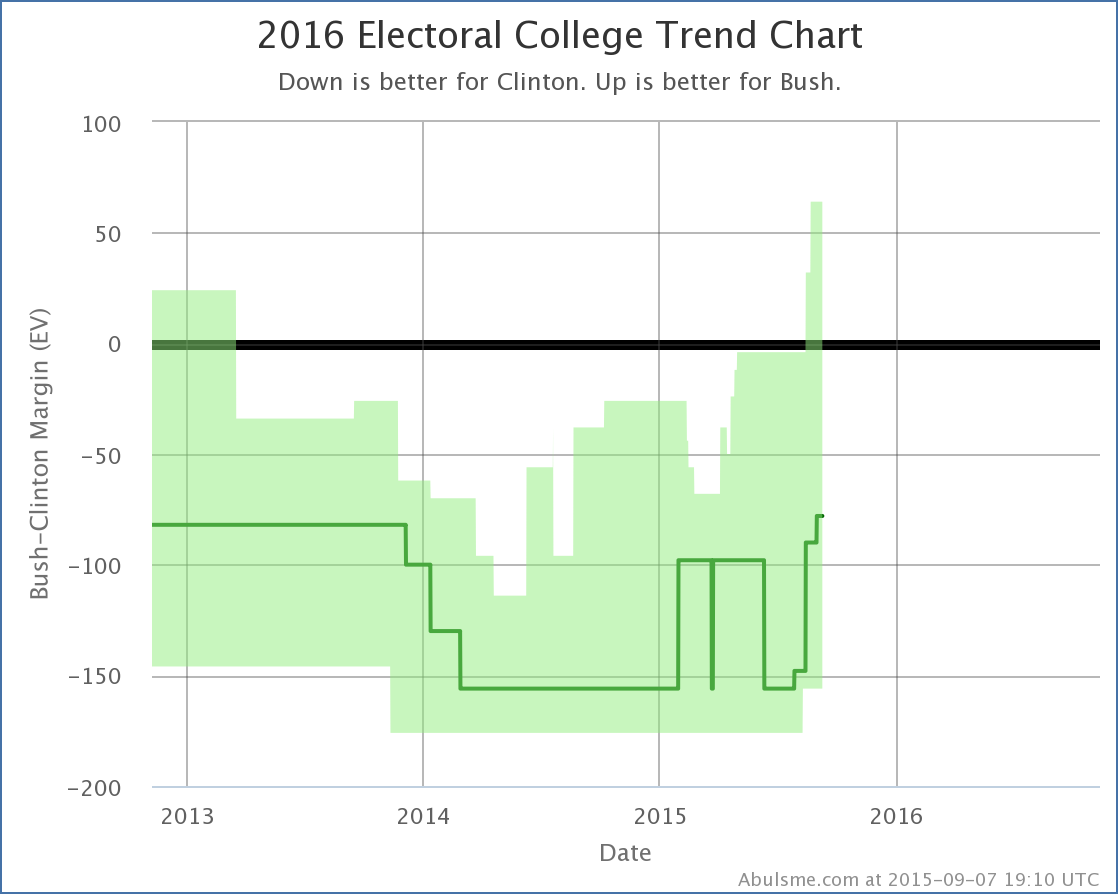
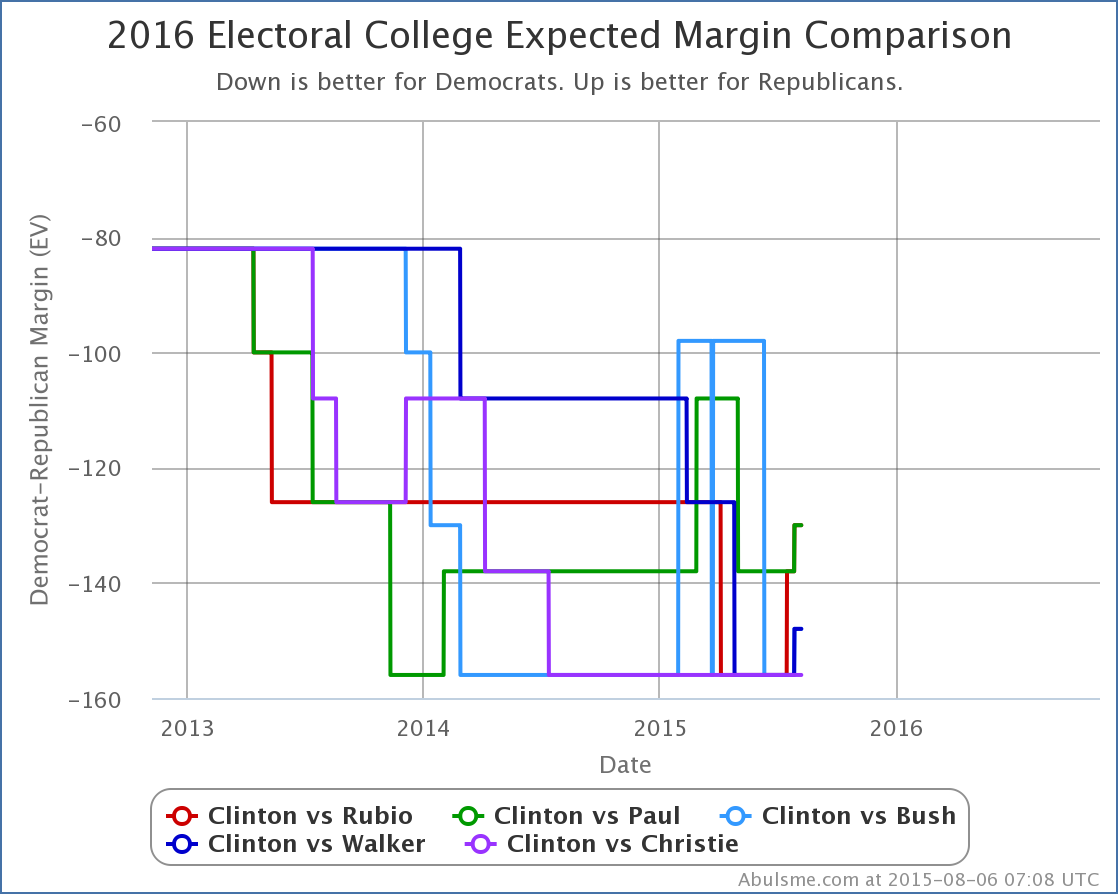
In the national Bush vs Clinton view, Bush is now losing by 78 electoral votes in the “expected” case where each candidate wins every state where they lead the poll averages. Yes, this is still a loss, but it is better than Bush has done in this matchup since the start of polling for 2016.
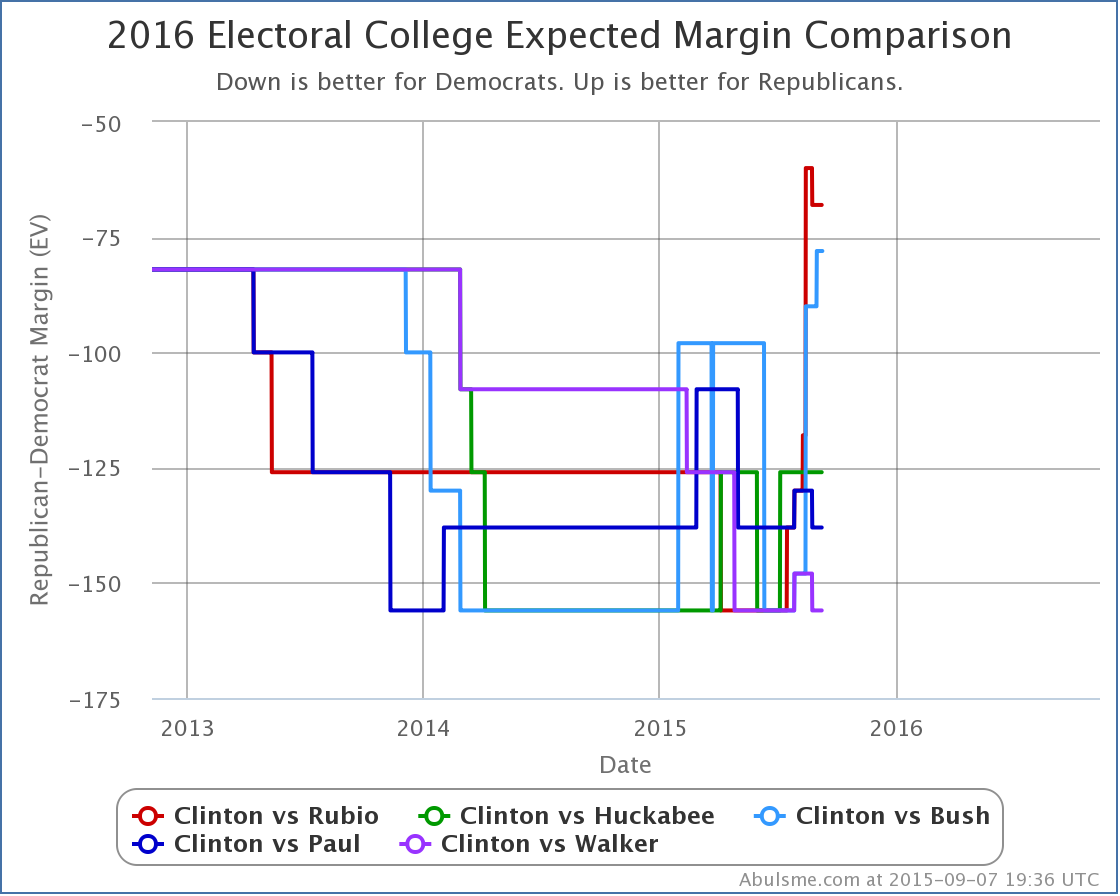
Looking at how Bush is doing compared to the rest of the best polled Republicans, Rubio is still doing better against Clinton, but Bush isn’t far behind. Huckabee, Paul and Walker’s margins against Clinton are significantly worse. In this particular view, they aren’t really gaining on Clinton at all. This doesn’t give the full picture though, as a quick look at the tipping point shows:
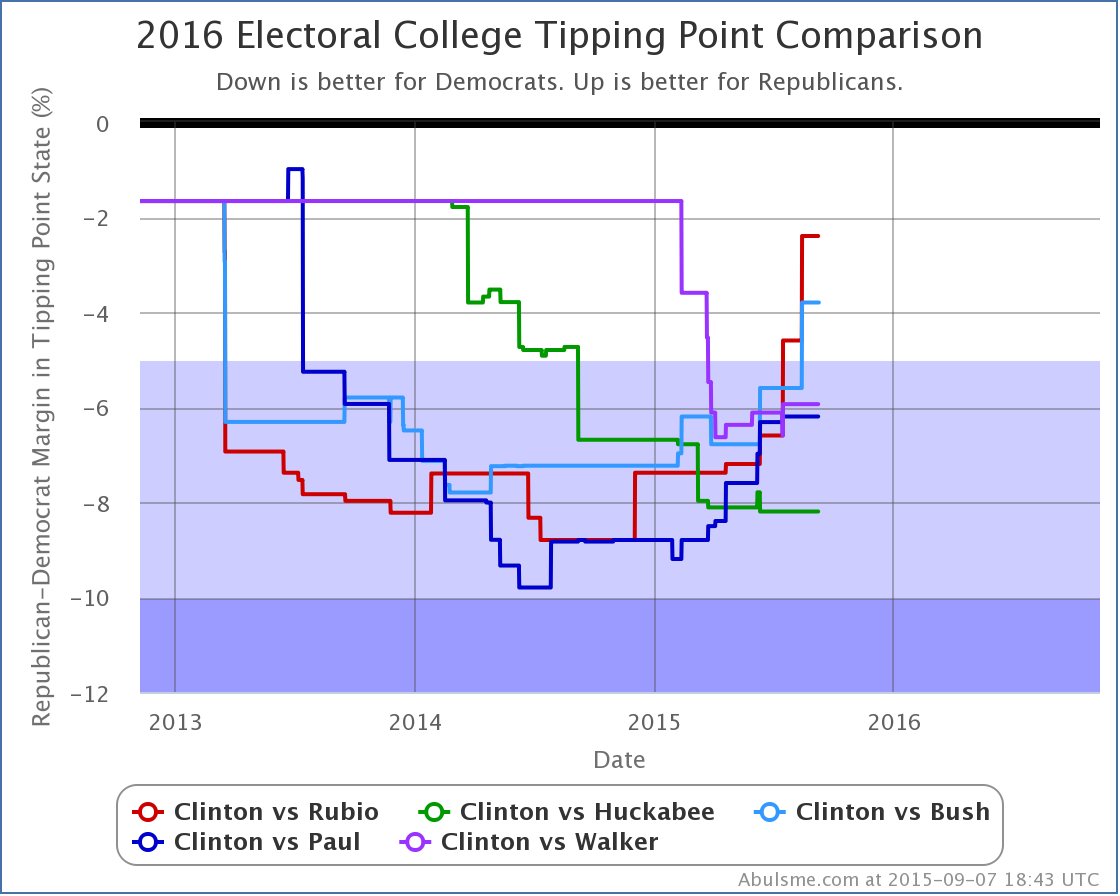
Bottom line, despite the move in her direction last time, the overall trends continue to be against Clinton. When and if this deterioration stops, and how that affects the primary races, is the big question of the campaign at the moment.
428.1 days until the first general election polls close.
Note: This post is an update based on the data on ElectionGraphs.com. All of the charts and graphs seen here are from that site. Graphs, charts and raw data can be found there for the race nationally and in each state for every candidate combination that has been polled at the state level. In addition, comparisons of the best polled candidate combinations both nationally and each in each state are available. All charts above are clickable to go to the current version of the detail page the chart is from, which may contain more up to date information than the snapshots on this page, which were current as of the time of this post. Follow @ElecCollPolls on Twitter for specific poll details as I add them.
Two sets of changes worth noting today triggered by new PPP polls in Iowa and Missouri. The streak of changes going against Clinton and in favor of the various Republicans continues. As I mentioned before, the last time one of my updates was unequivocally good news for Clinton was in May!
Iowa
The July Qunnipiac Poll showing Rubio with an 8% is looking kind of like an outlier, and without it we wouldn’t be quite there yet, but there has been a clear trend toward Rubio in the average going back a year. With the newest poll (plus that possible outlier) the average moves from “Weak Clinton” to “Weak Rubio”. This changes the “expected” result in this matchup:
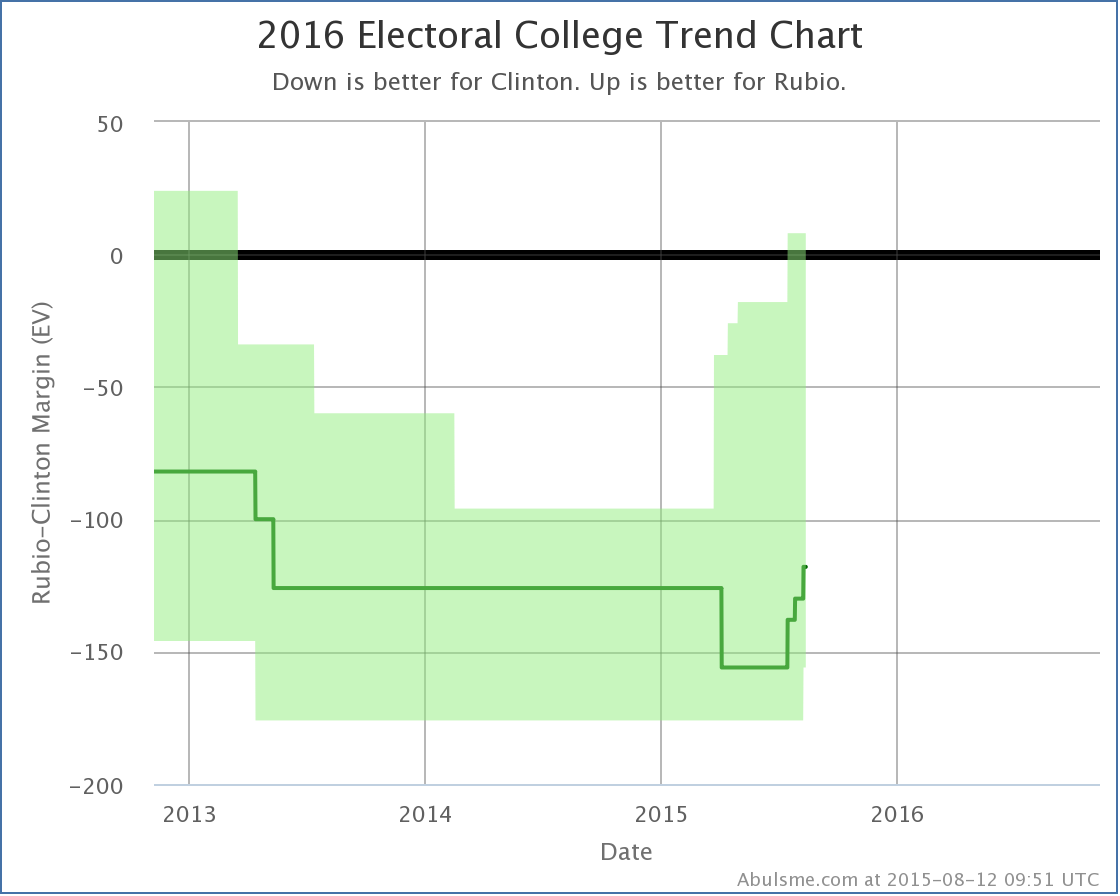
The expected result is now Clinton 328 to Rubio 210, which is a 118 electoral point loss by Rubio. Now, while this is still of course a significant loss, it is significant because it beats Romney’s 126 electoral vote loss against Obama in 2012. The last time one of the five best polled candidate combinations had the Republican outperforming Romney was back in June when Bush had pulled his expected loss down to only 98 electoral votes.
While there has been a general drumbeat of bad news for Clinton in my updates for the last three months, this particular chart doesn’t yet show an clear and indisputable breakout move beyond the range where these candidates have been bouncing around. If you only look at the changes since June, it starts to look like a trend though, and given the movement in other metrics, it is still reasonable to interpret this as a bad trend for Clinton.
The question though will be if the Republicans can start an actual breakout move where instead of talking about how it looks like they might beat Romney, we start talking about how it looks like they might beat Clinton. We aren’t close to that yet.
One thing people have been speculating about has been if the prominence of Trump on the Republican side right now is actually harming the party overall, specifically in terms of the ability of the other candidates to compete against Clinton. So far, there is no evidence for that at all in the numbers we track here.
Missouri
When I officially launched the election tracking site and posted my first analysis for 2016 I mentioned that if you looked at the average results for the last five general elections… the data I used to “seed” the analysis before there were actual state polls… there were only SIX states where the average margin in these five elections was less than 5%. They were Nevada (Dem+2.8%), Ohio (Dem+1.7%), Florida (Dem+0.9%), Colorado (Rep+0.0%), Virginia (Rep+1.6%) and Missouri (Rep+2.8%). All of these states were polled long ago, some many times… except Missouri. Today’s PPP poll is the first 2016 polling for Missouri that I am aware of. So finally, we get a current view of the state.
Missouri was basically on this “Close State” list because Bill Clinton won the state by 6.3% in 1996, the oldest of the five elections I used for the initial average. Since then the Republicans won by 3.3%, 7.2%, 0.1%, and 9.4%. OK, that 0.1% in 2008 was really close. And the 3.3% in 2000 wasn’t a complete blow out. But in general it seems like the trend has been redder in Missouri.
The new poll tested Clinton against 11 different Republicans. She lost by between 7% and 15% depending on which Republican you looked at. (They also tested Sanders against 4 Republicans with similar results.)
Bottom line, looks like 2016 is looking a lot more like 2012 or 2004 than 2008 or 2000. That is, a pretty strongly Republican state. Now, it is just one poll, but the results are strong enough that the state immediately moved from “Weak Republican” to “Strong Republican” for all five of the best polled candidate combinations. (And actually for all the rest of the combinations they polled too.)
The chart of this isn’t actually all that interesting on a state level. But Missouri no longer being a close state means that Clinton’s “best case” against all five Republicans weakens a little bit, so lets have a quick look at that graph:
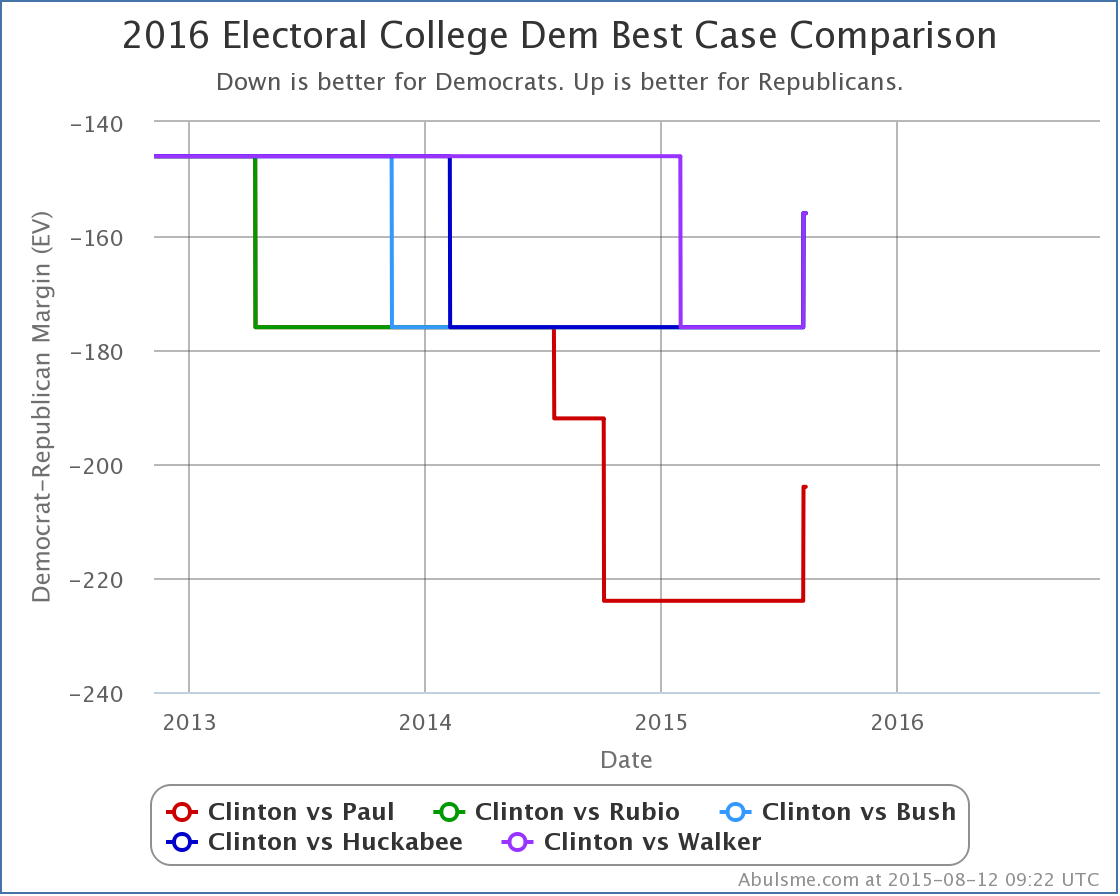
You don’t see a lot of volatility in this chart, simply because there are a lot fewer polls of the states that make a difference here. You see a lot of polls around the tipping point, and around the states that are really close, because they give insight into if the Republicans are catching up. Given the current state of Clinton’s lead, polling of the states Republicans are generally already ahead in only gives insight into how much extra Clinton could win by if everything possible went her way, which is fundamentally less interesting.
Never the less, with Missouri’s 10 electoral votes out of play at the moment, Clinton’s best case margin drops by 20 electoral votes against all these candidates. In the case where she wins all the states she is ahead in, plus all the states where the Republican currently leads by less than 5%, she now beats Paul by 204 electoral votes. Rubio, Bush, Huckabee and Walker get beaten by a more modest 156 electoral votes. These are of course pretty good margins in today’s polarized electorate. But to get to these kinds of numbers, just about everything would have to go Clinton’s way… which is not the trend today.
But of course, we have 454.2 days until the election. Lots can change in 454.2 days. :-)
Best Polled List
I should also mention that the “best polled” list got shuffled a bit with the latest updates. Clinton vs Paul once again grabs the “best polled” spot and becomes the default view on election2016.abulsme.com. Meanwhile Clinton vs Christie drops to 6th place and out of the group we highlight here, replaced by Clinton vs Huckabee returning to the top five after a short absence. Clinton vs Huckabee is just barely out of the top 5, but any other candidate combinations are far behind in terms of the volume and breadth of available polling on the state level at the moment. We’re currently giving the most attention here to Clinton vs Paul, Rubio, Bush, Huckabee and Walker.
Note: This post is an update based on the data on my 2016 Electoral College Analysis Site. All of the charts and graphs seen here are from that site. Graphs, charts and raw data can be found there for the race nationally and in each state for every candidate combination that has been polled at the state level. In addition, comparisons of the best polled candidate combinations both nationally and each in each state are available. All charts above are clickable to go to the current version of the detail page the chart is from, which may contain more up to date information than the snapshots on this page, which were current as of the time of this post. Follow @ElecCollPolls on Twitter for specific poll details as I add them.
On this week’s Curmudgeon’s Corner podcast Sam and Ivan throw the usual format out the window and instead give the MST3K treatment to the Republican Debate. If you don’t know what that means, what happened is we played the debate, and recorded our thoughts and reactions to it in real time. So if you didn’t watch the straight up debate already, or even if you did, listen to our commentary now! Oh yeah, and at the beginning we talked a bit about a couple of recent robberies too.
Recorded 2015-08-07
Length this week – 2:24:50
1-Click Subscribe in iTunes
View Podcast in iTunes
View Raw Podcast Feed
Download MP3 File
Follow the podcast on Facebook
Show Details:
- Break-ins and Robberies
- Republican Debate Segment 1
- Intros
- Support Nominee?
- Electibility
- Immigration
- Republican Debate Segment 2
- Immigration
- Terror and National Security
- Obamacare and role of Federal Government
- Republican Debate Segment 3
- Hillary Clinton
- Economy, Jobs and Money
- Iran Deal
- Republican Debate Segment 4
- Republican Debate Segment 5
- Republican Debate Segment 6
- Wrap Up Analysis
First of all, a little bookkeeping. With the latest batch of polls, the “five best polled candidate combinations” gets shuffled up a bit. Clinton vs Huckabee falls off the top five (bye Huck!), replaced by Clinton vs Walker. Meanwhile, Clinton vs Rubio moves into the “best polled” slot, becoming the default view on the election2016.abulsme.com site. So, for the moment, that means the candidate combinations I’ll talk about in these updates are Clinton vs Rubio, Paul, Bush, Walker and Christie. Huckabee honestly is very close behind in the #6 spot. After that though there is a pretty big gap in polling before we get to the next combinations. There may be lots of talk about Trump lately. Or of Biden or Sanders as Clinton alternatives. Or of the other ELEVEN Republican candidates. But in comparison to the combinations I mentioned earlier, state level polling involving those folks is still pretty sparse. We’ll talk about the rest of the candidates if and when there is good enough polling on them to get them into the top five. Or at least close.
OK, with that out of the way, the main news from the latest polls. Specifically, with a WMUR poll in New Hampshire added in, this happened:
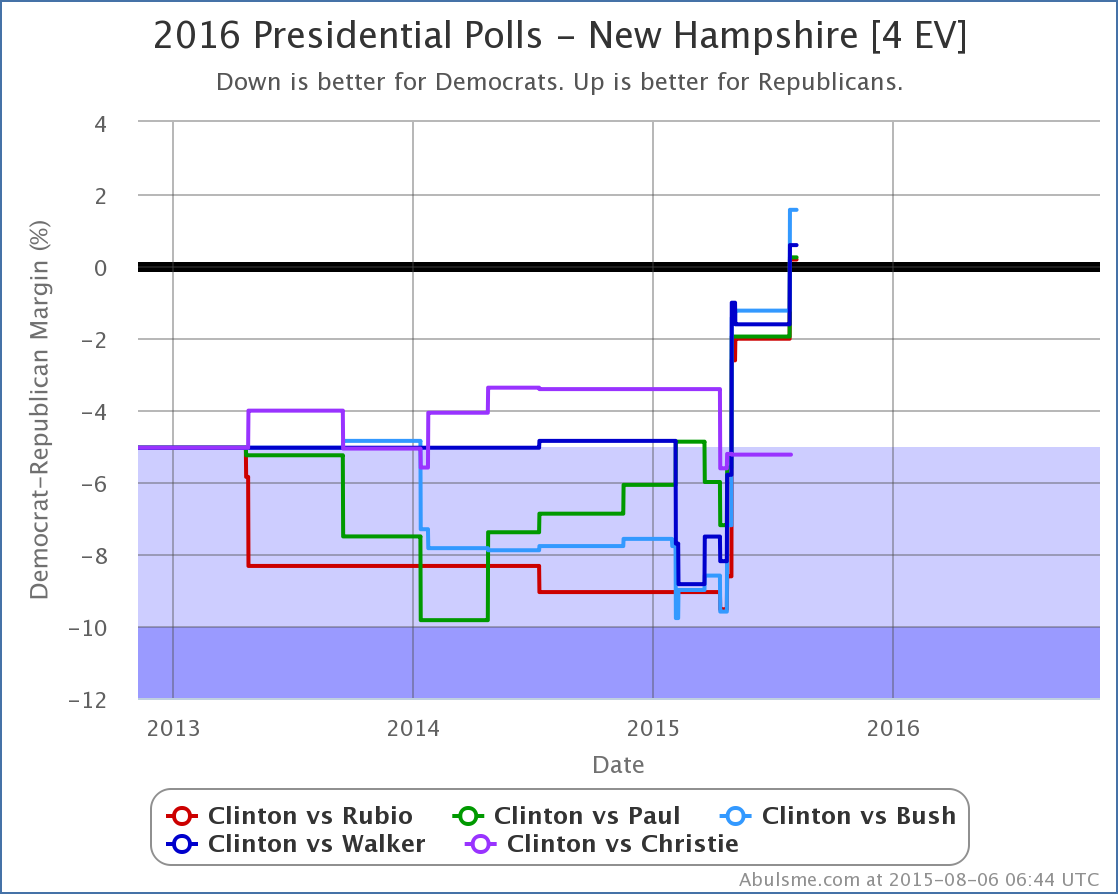
Rubio, Paul, Bush, and Walker all took the lead in New Hampshire as measured by my poll average. Just barely. But still. They are now in the lead. Christie wasn’t polled this time, but was lagging the others quite a bit anyway.
Just a few months ago, New Hampshire was looking like it was pretty reliably “Strong Clinton” against almost all Republican challengers. (The exception being Christie amusingly enough, since he is now the weakest of the bunch.) This is a pretty big move. It seems to be parallel across many candidates, so it is likely this is more a case of Clinton getting weaker than anything any Republican candidate is doing specifically.
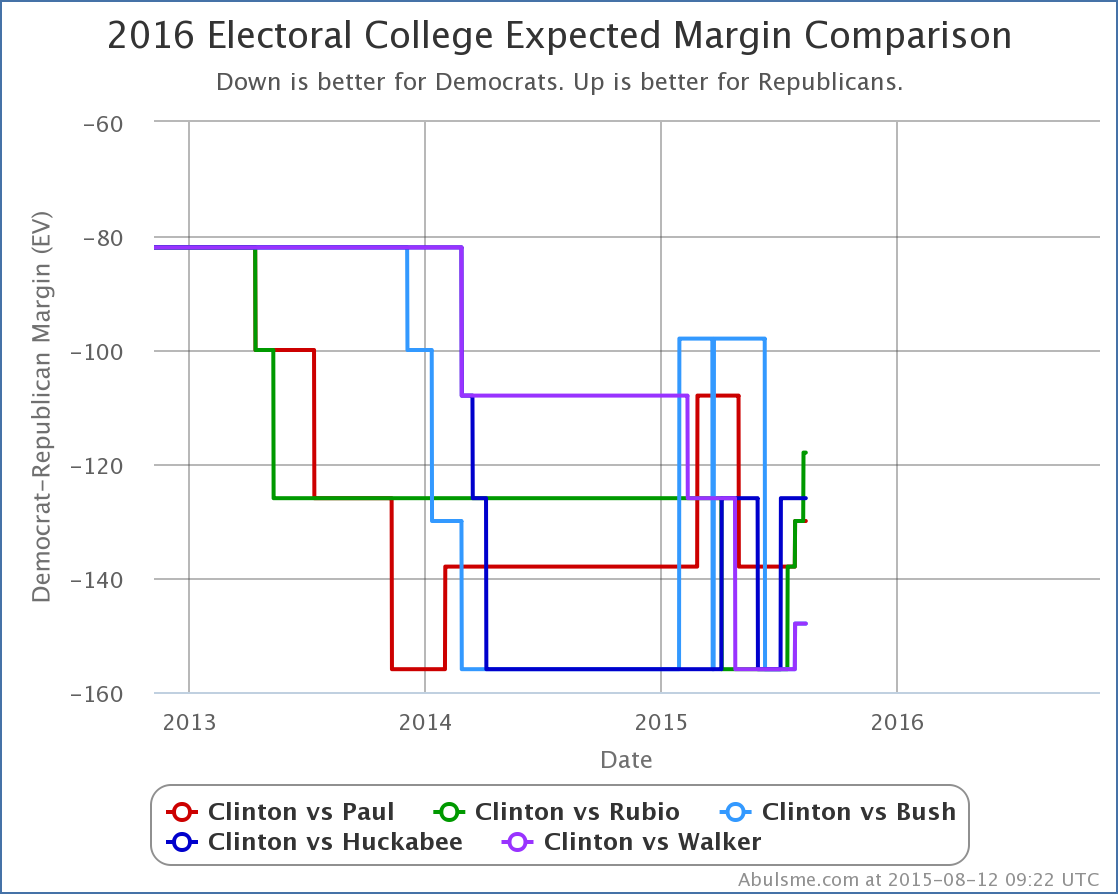
So what does New Hampshire flipping do to the “expected” results if the election was held today?
Well, OK, a couple bumps there at the end. Even with this though, this particular chart doesn’t show a clear trend. All the lines are bouncing around, but aren’t clearly trending in one direction or another.
But, looking more generally at my Electoral College updates, the last time I did one that was fully and unreservedly about something moving in Clinton’s direction was in May! From the end of May, through June, through July, and now into August, every update has been about Republican gains. (There were a couple Clinton gains in the mix, but there were always overshadowed by moves toward the Republicans that happened at the same time.)
Despite this, everything points to Clinton still being way ahead overall. As one example of this, even with New Hampshire, none of the five candidates on the chart above even match Romney’s performance in 2012. The best of the bunch in “expected result”, Rubio and Paul, still lose to Clinton by 130 electoral votes.
Clinton can’t be happy with the trend though. Yes, things are expected to tighten. But I’m sure she would prefer if they didn’t anyway!
We still have lots of time until the election. The first Republican debates are coming up later today. Obviously the main thing people will be watching for are how it may impact the standing of the various candidates in the Republican race, but Democrats and Independents are watching too, so don’t be surprised if there are effects on the general election matchup too.
And of course, this is just the beginning of debate season. Many more to come…
460.7 days until the first general election polls close.
Note: This post is an update based on the data on my 2016 Electoral College Analysis Site. All of the charts and graphs seen here are from that site. Graphs, charts and raw data can be found there for the race nationally and in each state for every candidate combination that has been polled at the state level. In addition, comparisons of the best polled candidate combinations both nationally and each in each state are available. All charts above are clickable to go to the current version of the detail page the chart is from, which may contain more up to date information than the snapshots on this page, which were current as of the time of this post. Follow @ElecCollPolls on Twitter for specific poll details as I add them.
On this week’s Curmudgeon’s Corner Podcast instead of a handful of big topics, Ivan and Sam once again go full show Lightning Round! We talk Election 2016, Sandra Bland, Cecil the Lion, MH370, Movies, Books, Windows 10, Gun Control… and lots more… 26 separate topics this week by our count! One for every letter of the alphabet! So start singing your ABC’s and listen!
Recorded 2015-07-23
Length this week – 1:37:02
1-Click Subscribe in iTunes
View Podcast in iTunes
View Raw Podcast Feed
Download MP3 File
Follow the podcast on Facebook
Show Details:
- Intro
- Yard Camping
- Kids and Tech
- Lightning Round I
- Sanders, O’Malley and Black Lives Matter
- More Trump!
- Thinning the Republican Field
- Lightning Round II
- Sandra Bland
- Police Escalations
- Cecil the Lion
- Internet Mobs
- Clinton Emails again
- Huckabee on Ovens
- Lightning Round III
- Piece of MH370 found?
- Movie: Thomas and Friends: The Adventure Begins
- Kids and Cars
- Curmudgeon’s Corner Eight Years Old!
- Onstar Hacking
- Tech Earnings
- Windows 10
- Book: Autobiography of Mark Twain: Volume I
- Lightning Round IV
- Cuba Embassy Opens
- We’re on Stitcher!
- Louisiana Shooting and Gun Control
- Jonathan Pollard Parole
- Turkish Air Strikes
- Syria
- Upcoming Republican Debate
To get the headline out of the way… for the first time since officially launching my 2016 electoral college polling tracking back in November, one of the Republicans with a significant amount of state level polling is within reach of Clinton. We now see a scenario where “if the election was held today” and the Republican was to outperform their polling… but by an amount that is not inconceivable… then the Republican would win.
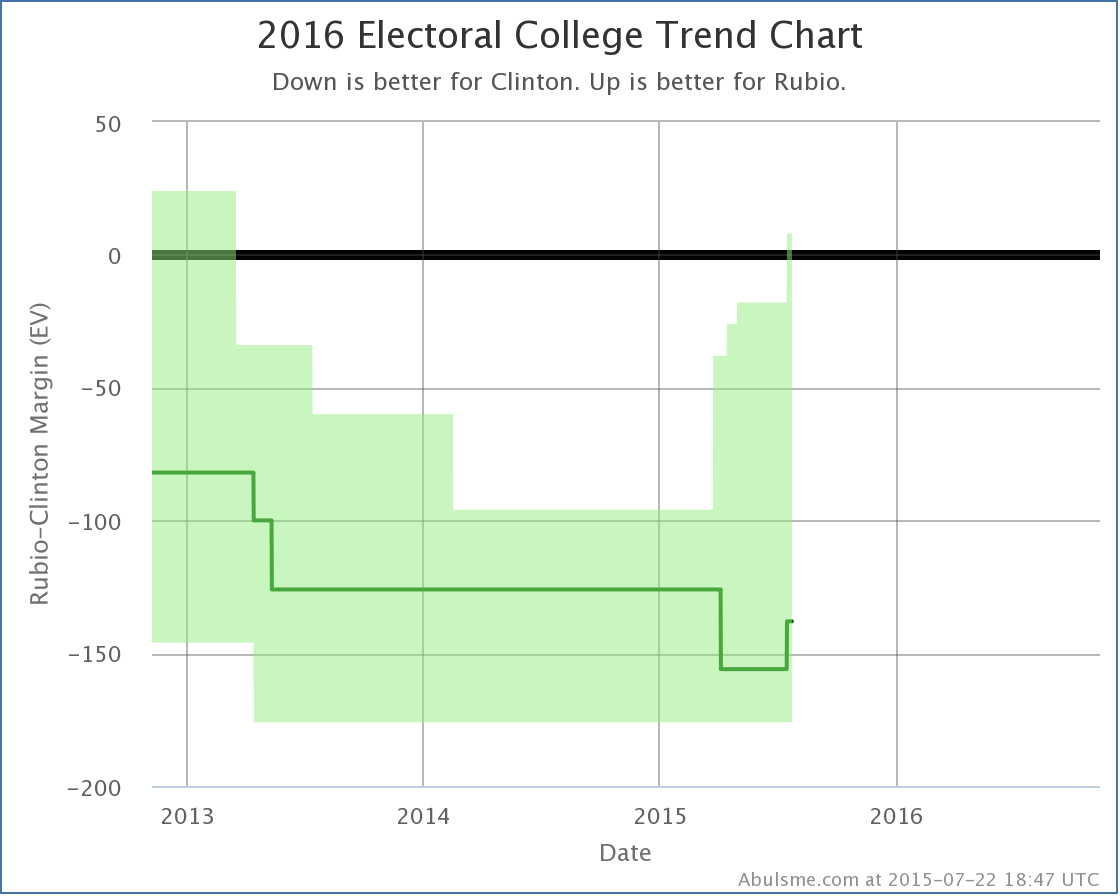
Specifically, while Clinton is still ahead against all five of the “best polled” Republicans challenging her (Bush, Rubio, Paul, Christie and Huckabee), if you give Rubio not only all the states he is already ahead in, but also all of the states where Clinton’s lead is less than 5%, then we end up with Clinton 265 to Rubio 273, a narrow 8 electoral vote victory for Rubio. The idea here is that a 5% lead is small enough that it can easily slip away under the right circumstances. So this does’t mean that Rubio is actually ahead, but it means that Rubio winning against Clinton is within the realm of the plausible.
This also shows up in the “tipping point”, which now shows a Clinton lead of less than 5% for the first time since our launch:
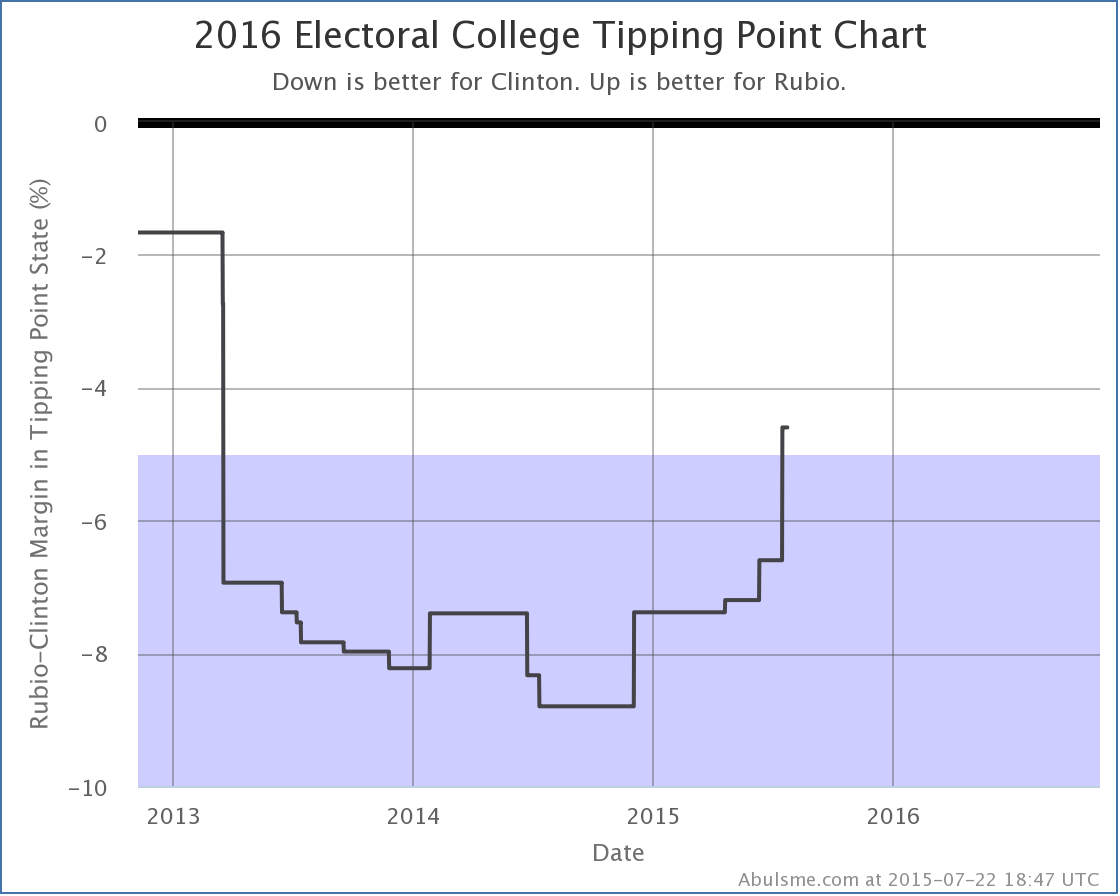
Rubio is the first Republican to manage this, but trends have been against Clinton in recent months. Bush is just barely short of this marker. His best case is to lose by only 4 electoral votes. If he makes one more state close, winning will also be within range. And Paul isn’t that much further behind.
Yes, yes, Clinton is still significantly ahead, the best any Republican does if you just give them the states they are actually ahead in is to match Romney’s loss in 2012. But still, we now have at least one Republican where the polls are close enough that a victory is at least imaginable! So as per the title we have a race!
Now the state level details for those who want them…
Qunnipiac released the latest results in their Presidential Swing State Poll series today. There was a lot of buzz about how bad it was for Clinton, showing her behind to Bush, Walker and Rubio in Colorado, Iowa and Virginia. Indeed, this single poll looked really bad for her in all three states… in fact enough out of line with other recent results that it is very tempting to think it may just be an outlier rather than a real indication of a major change.
Of course, that is why we do poll averages. Looking at the averages, adding these new results moves things toward the Republicans, but nowhere near as dramatically as if you just looked at the Quinnipiac results in isolation.
Quinnipiac polled nine different candidate combinations, but I only look at the five combinations that have the best polling over all. So I’m not going to talk about the Sanders vs Bush matchup that Quinnipiac polled. Sorry. (That’s the 17th best polled candidate combination by the way.)
Anyway, of the five best polled combinations, only Clinton vs Rubio had any significant changes. Beyond the headline, lets look at the two states that actually changed status.
First off, Colorado:
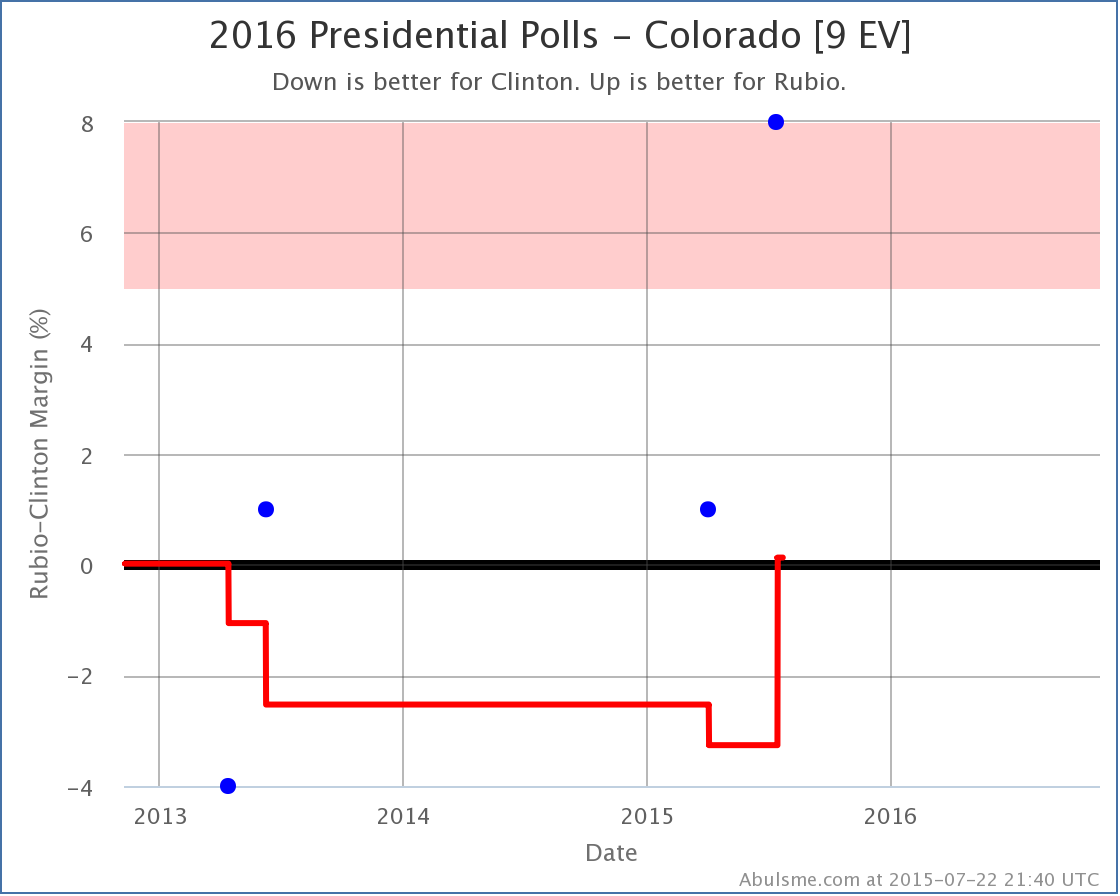 ‘ ‘
Clinton vs Rubio in Colorado has been very lightly polled… only four polls since the 2012 election, so the 2012 election results themselves are still included in the average. But the latest result is just enough to leave Rubio ahead by 0.1%. With Rubio now ahead in Colorado, the “expected” electoral college result moves to Clinton 338, Rubio 200, a 138 electoral vote margin for Clinton. (For comparison, Obama’s margin over Romney was 126 electoral votes.)
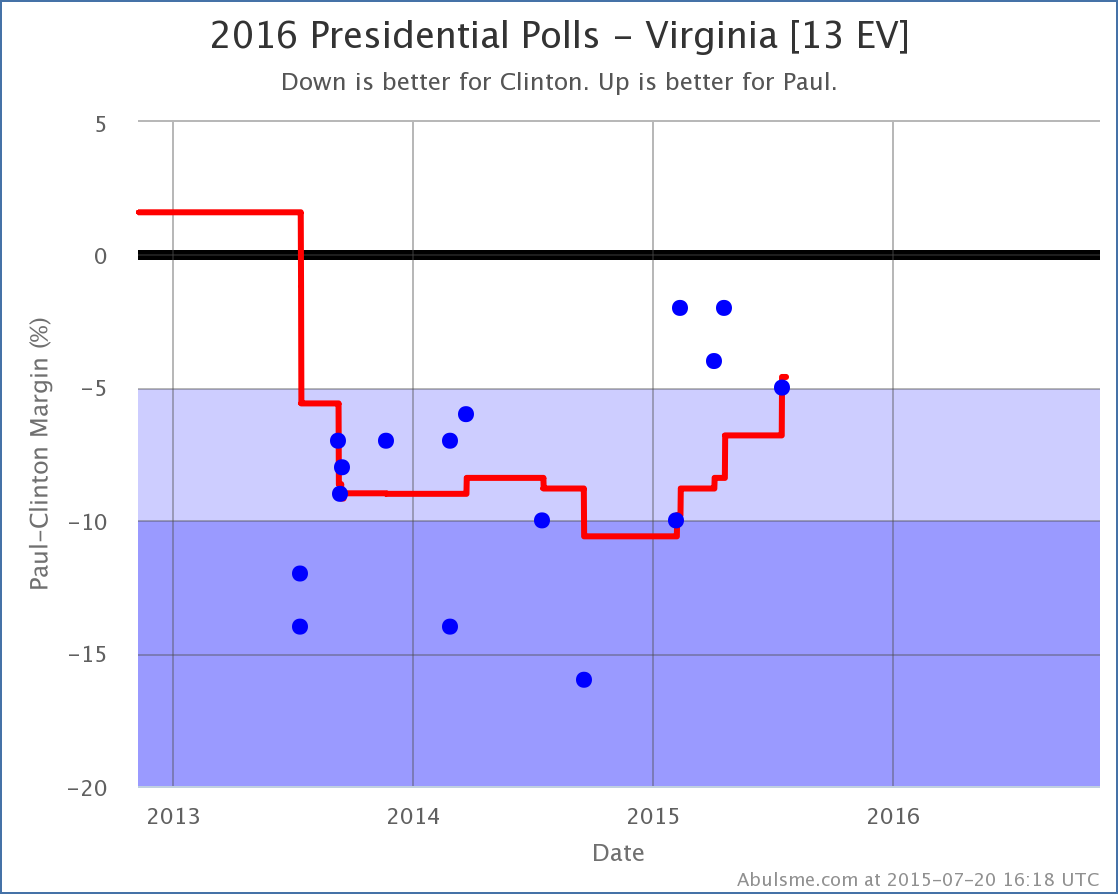
Virginia also changed categories:
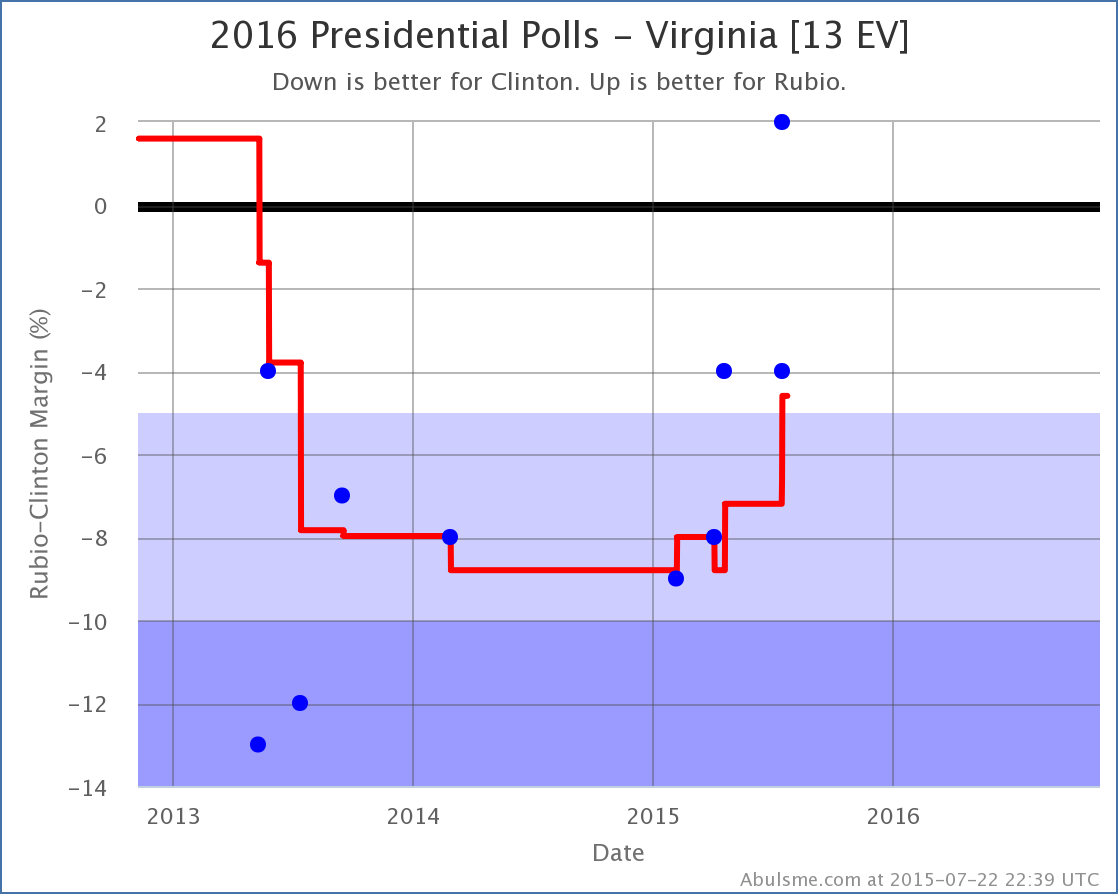
There have been quite a few more Clinton vs Rubio polls in Virginia than there were in Colorado. The new Quinnipiac poll accelerated a trend toward Rubio, and pushed Virginia from “Strong Clinton” to “Weak Clinton”. This is of course what prompted the improvement in Rubio’s best case and put him within reach of Clinton.
The full Clinton vs Rubio spectrum looks like this today:
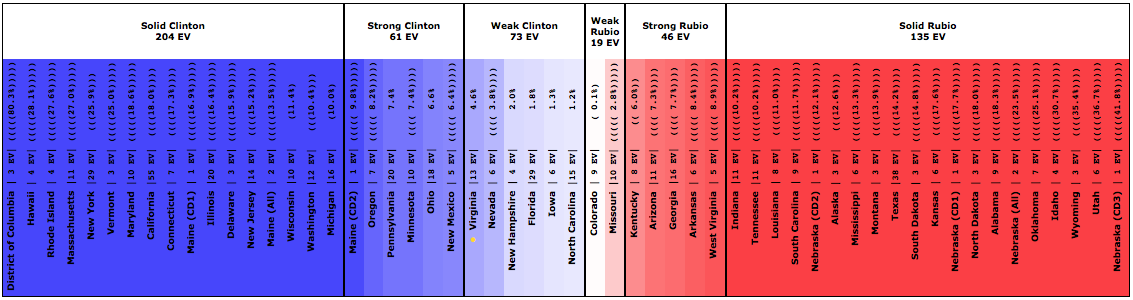
And the full summary:
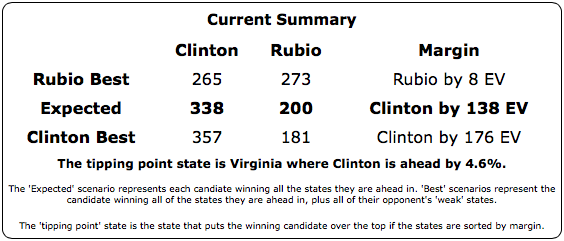
To win, Rubio would still need to flip North Carolina (1.2% Clinton lead), Iowa (1.3% Clinton lead), Florida (1.8% Clinton lead), New Hampshire (2.0% Clinton lead), Nevada (3.8% Clinton lead) and Virginia (4.6% Clinton lead). That sounds like a lot, but if national events or campaigning move things across all states, it means only 2.3% of voter have to change their minds to change the outcome. Even in today’s highly polarized climate, that is easily imaginable.
So, for the first time since the 2012 elections, it is starting to look like we have a real race. This is not unexpected. In my November post “The Race Begins” I said:
The real campaign against Clinton hasn’t ramped up yet. Lots of mud will be thrown. And the Republican candidates will get more and more visibility. Although anything is possible in either direction, it is quite possible that what we are seeing right now will be Clinton’s high water mark. The race is likely to get closer as we move through 2015 and people get more engaged.
Yup. That looks like what has been happening.
475.0 days until the first general election polls close.
Note: This post is an update based on the data on my 2016 Electoral College Analysis Site. All of the charts and graphs seen here are from that site. Graphs, charts and raw data can be found there for the race nationally and in each state for every candidate combination that has been polled at the state level. In addition, comparisons of the best polled candidate combinations both nationally and each in each state are available. All charts above are clickable to go to the current version of the detail page the chart is from, which may contain more up to date information than the snapshots on this page, which were current as of the time of this post. Follow @ElecCollPolls on Twitter for specific poll details as I add them.
Since my last electoral college post, there have been PPP polls in Virginia and Nevada. The only one of the top five “best polled” candidate combinations with a significant change is Clinton vs Paul, and it is good news for Paul.
Clinton vs Paul
With this latest poll, my average of Clinton vs Paul in Virginia moves to Clinton by 4.6%. While still a substantial Clinton lead, it means Virginia moves to “Weak Clinton” in my average, and I now allow the possibility that Paul could win Virginia. This improves his “best case” where he wins all the states where he leads in the polls, plus all the states where Clinton is ahead by less than 5%.
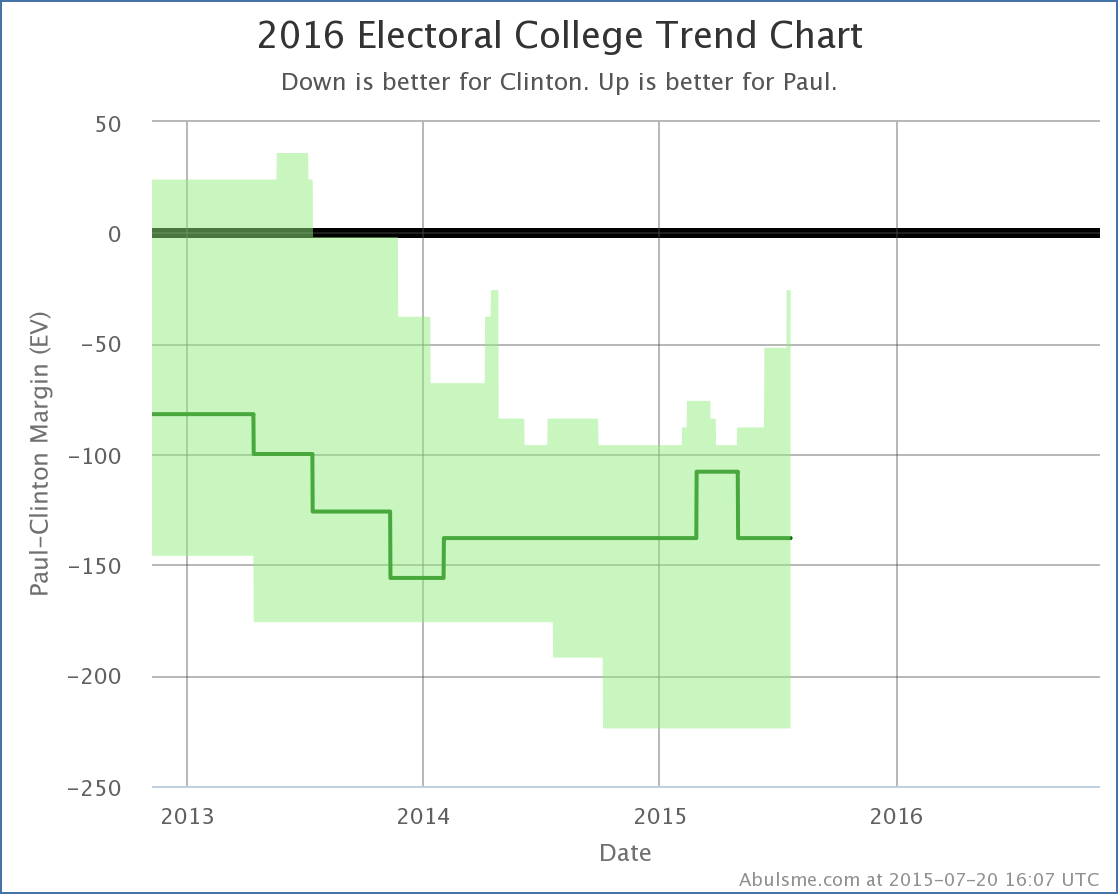
The spike on the upper right is this improvement. Paul’s best case here is still to lose by 26 electoral votes, but this is better than his best case has been since April 2014, and it has been on an upward trend since the beginning of May. So while he isn’t really moving the needle yet on actually bringing more states over to his side of the fence, he is making a few closer, which of course needs to happen first.
The change in Virginia also moved the “tipping point”… basically how far ahead the winning candidate is in the state that would “put them over the edge” in the electoral college. This is a measure of how much polls would have to move nationally, taking into account the structure of the electoral college, in order to flip the election to the other side.
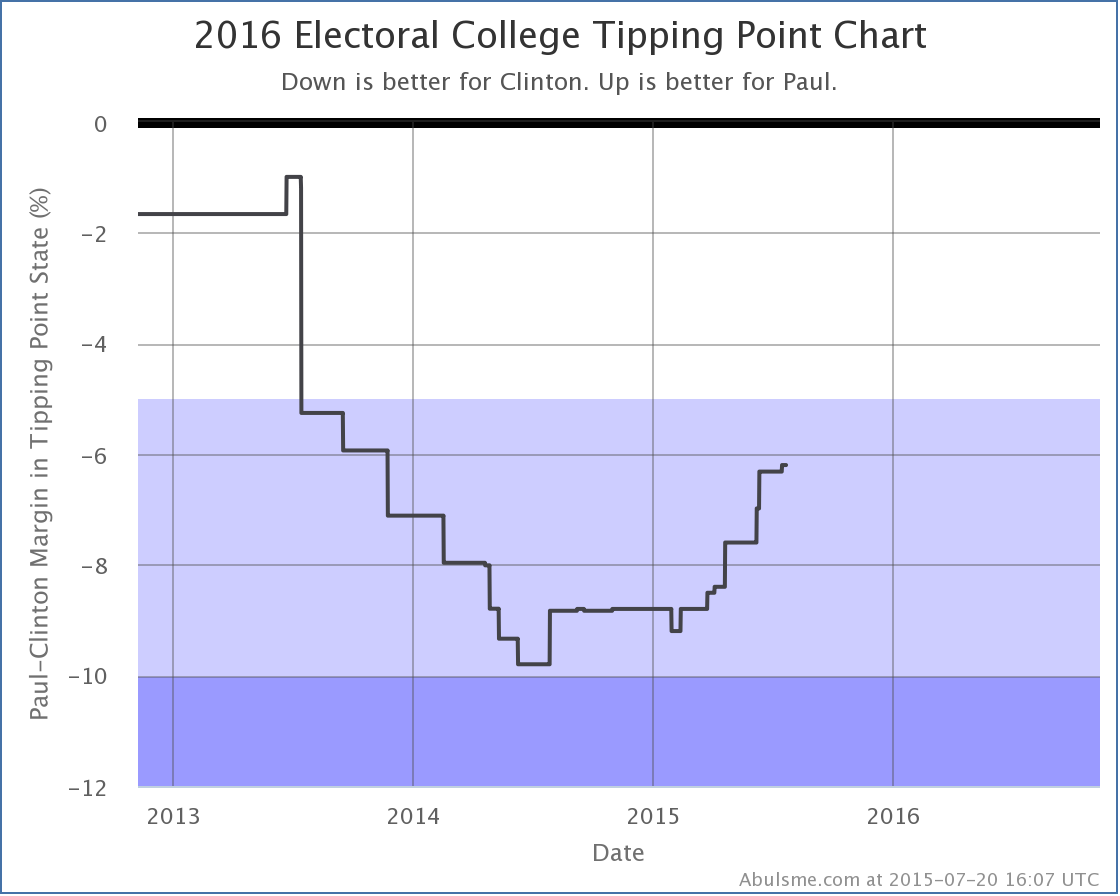
On this metric Paul has had nothing but moves in his direction since February. Slowly but surely his situation has been improving. It of course still has a long way to go. But the trend is there.
Everybody Else
So, we do have to ask the usual question. Is this really Paul getting stronger? Or is this just Clinton getting weaker? So lets look at the comparisons with all of the five best polled candidate combinations.
First Virginia:
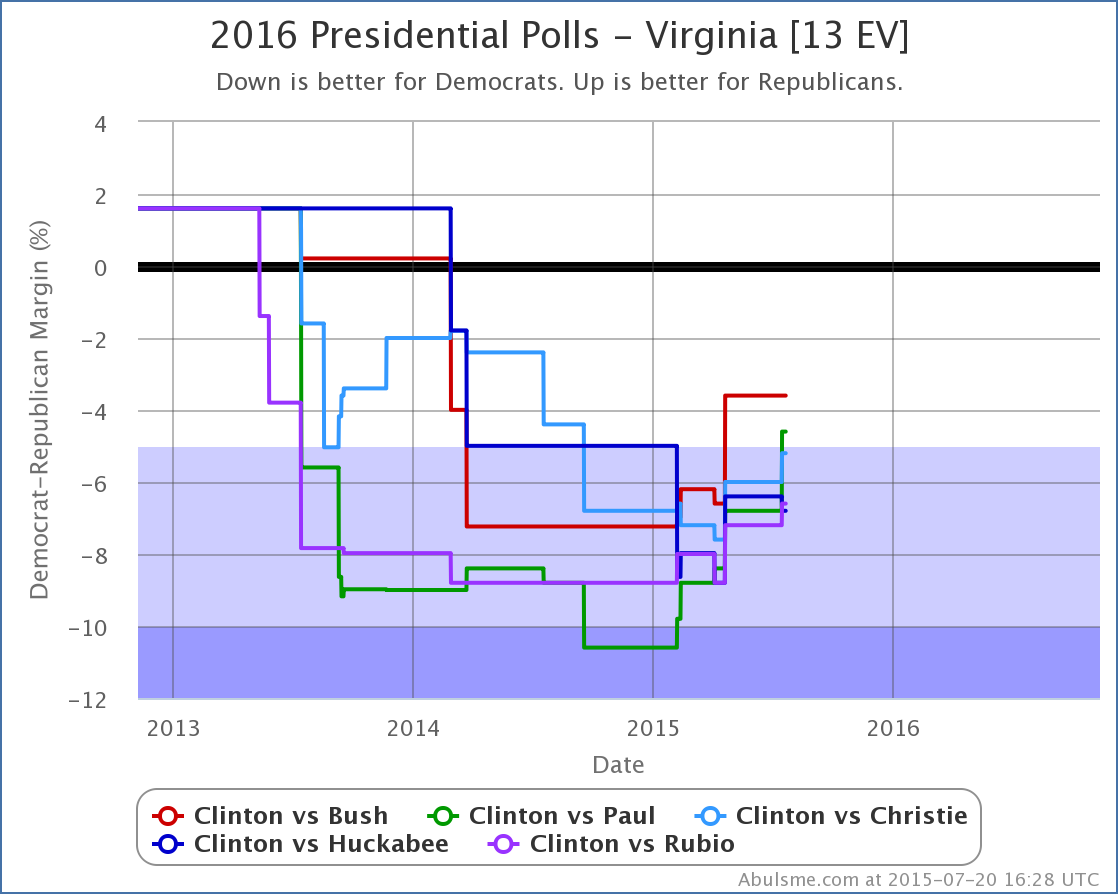
Looking back six months… Bush, Paul, Christie and Rubio have all improved vs Clinton. Only Huckabee has declined in that time frame.
Then the “best cases”:
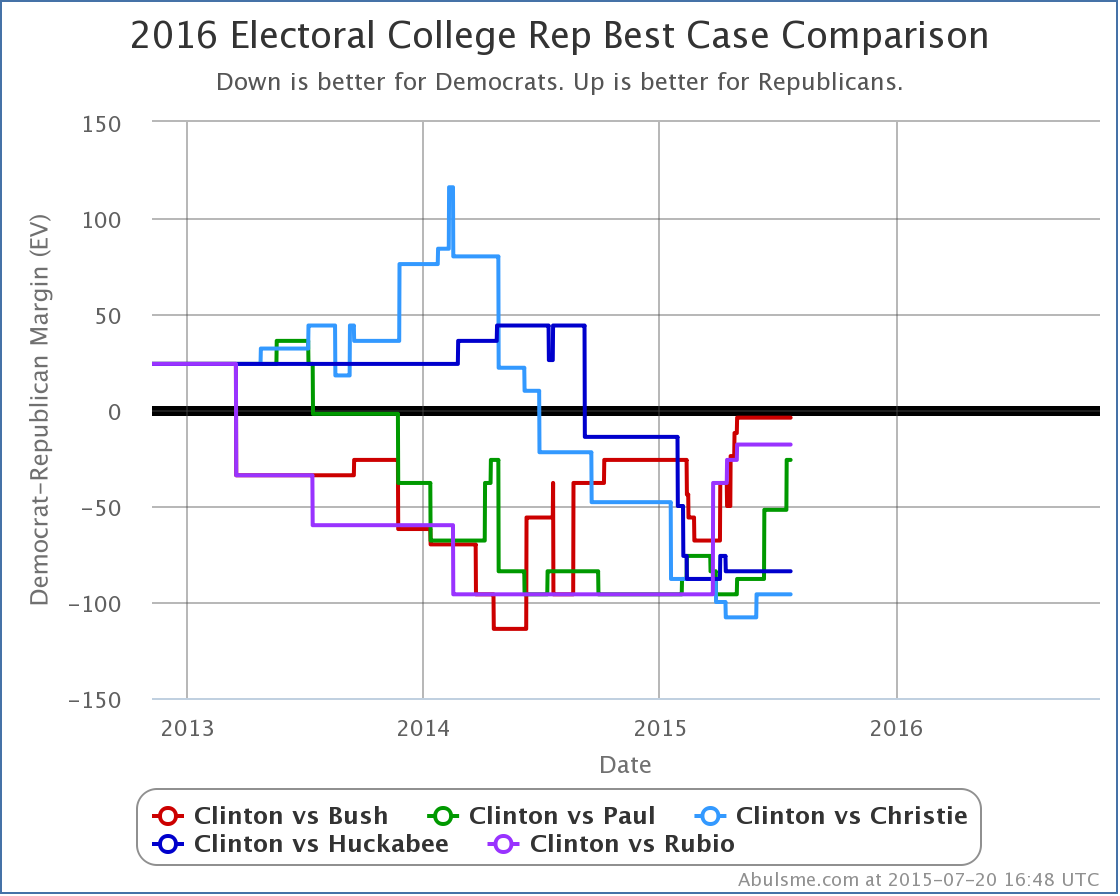
Again looking back six months, this time Bush, Paul and Rubio have all improved, while Christie and Huckabee have declined.
Finally, the tipping points:
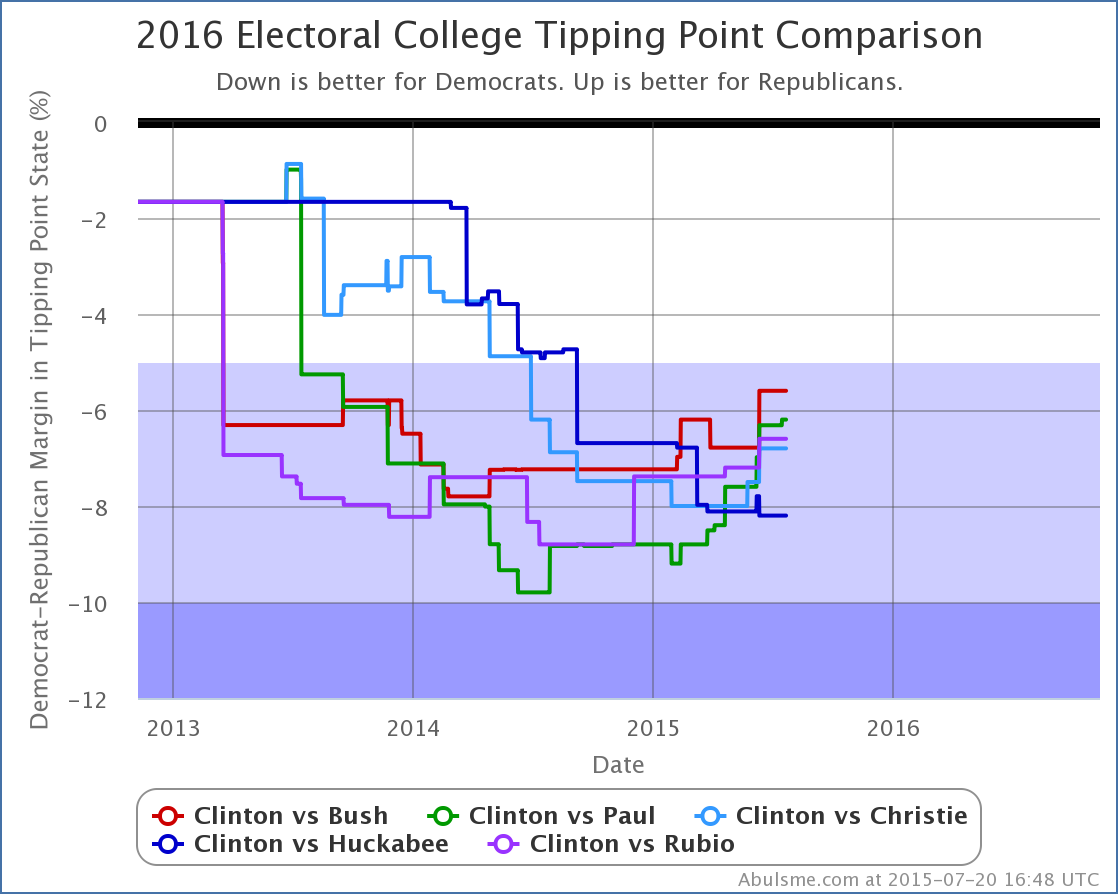
Once again, everybody is gaining on Clinton… except Huckabee. Poor Huckabee.
Anyway, together this means that Clinton seems to be weakening generally against most of the Republican candidates, this isn’t something special for Paul. Today’s update just happened to have him be the one to flip categories today.
Having said that though, if you look at the amount Paul has moved in the three graphs above vs the other four competitors, he’s had the biggest move in Virginia, the biggest move in tipping point, and the second largest move in “best case”. So perhaps there is actually something going on with Paul separate from the more general move against Clinton.
For any of that to matter though, he would still have to win the nomination, which is a long shot. But still…
477.3 days until polls start closing.
Note: This post is an update based on the data on my 2016 Electoral College Analysis Site. All of the charts and graphs seen here are from that site. Graphs, charts and raw data can be found there for the race nationally and in each state for every candidate combination that has been polled at the state level. In addition, comparisons of the best polled candidate combinations both nationally and each in each state are available. All charts above are clickable to go to the current version of the detail page the chart is from, which may contain more up to date information than the snapshots on this page, which were current as of the time of this post. Follow @ElecCollPolls on Twitter for specific poll details as I add them.
Only one change of note this week. PPP did another poll of North Carolina. Of the five best polled candiate pairs… right now still Clinton vs Bush, Paul, Christie, Huckabee, and Rubio… only Clinton vs Huckabee resulted in a category change.
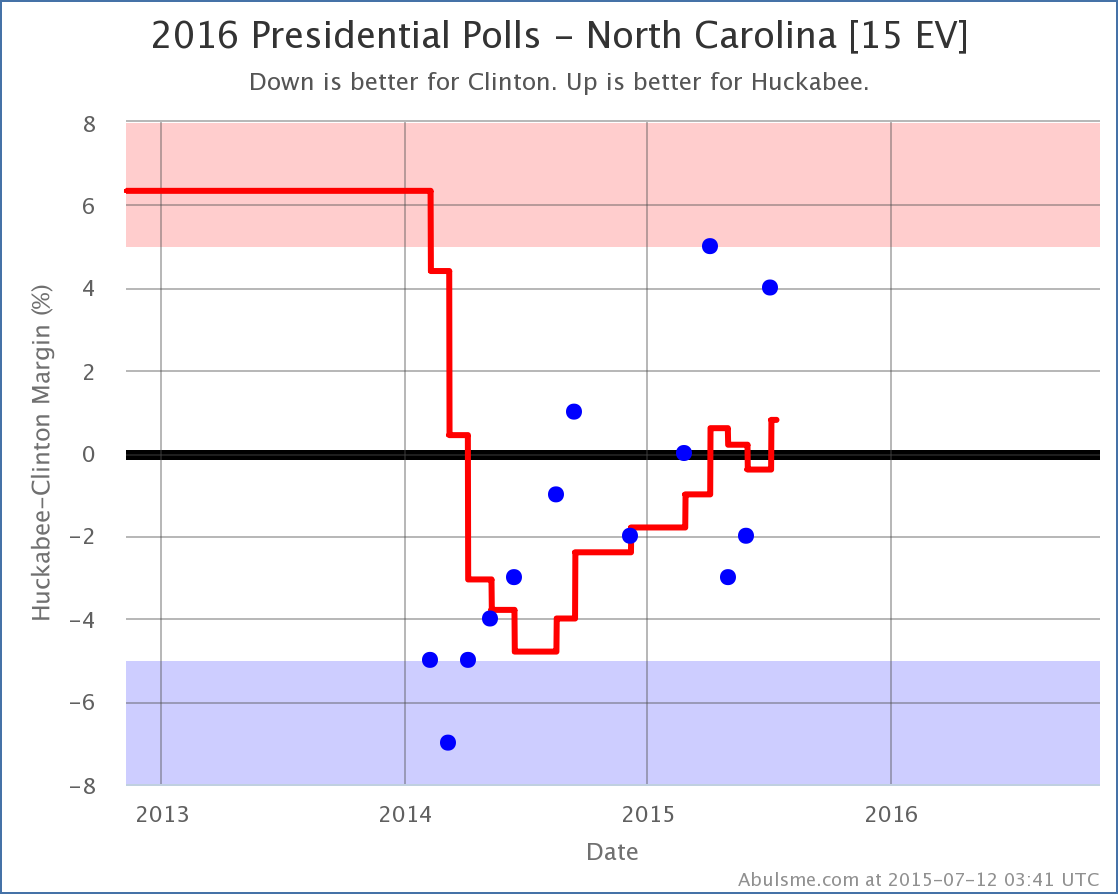
Huckabee takes the lead again after having lost it at the end of May. Looking at the long term trend, Huckabee has been gaining against Clinton in North Carolina for the last year or so. Now, is this just Huckabee, or part of a larger trend against Clinton?
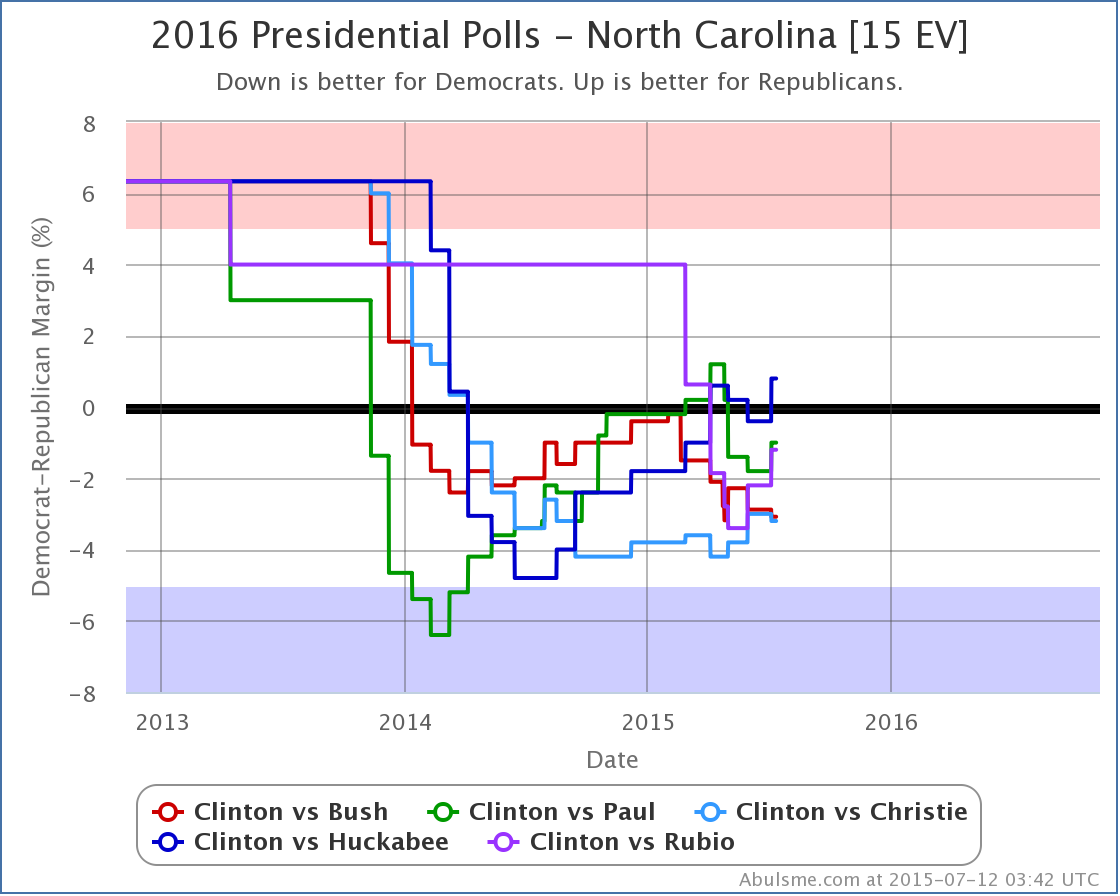
Lets look at how each of these five candidates has done against Clinton in North Carolina over the last six months, namely comparing where they stand today (July 12) vs where they were six months ago (January 12).
- Clinton vs Huckabee: Clinton by 1.8% -> Huckabee by 0.8% (2.6% Huckabee gain)
- Clinton vs Christie: Clinton by 3.8% -> Clinton by 3.2% (0.6% Christie gain)
- Clinton vs Paul: Clinton by 0.2% -> Clinton by 1.0% (0.8% Clinton gain)
- Clinton vs Bush: Clinton by 0.4% -> Clinton by 3.1% (2.7% Clinton gain)
- Clinton vs Rubio: Rubio by 4.0% -> Clinton by 1.2% (5.2% Clinton gain)
So, no. There hasn’t been an across the board Republican gain here, at least not over the last six months. (There is a bit more of move toward the Republicans if you look back a whole year.) Over six months though, we have Huckabee and Christie doing better against Clinton, while Paul and Bush are doing worse.
(You can discount the Rubio results, as six months ago there was only one actual Clinton vs Rubio poll in NC, so this was primarily movement toward the real Rubio numbers away from the average of previous election results, rather than actual movement in Clinton vs Rubio.)
Given this, there might really be something to the notion that Huckabee may be getting some resonance in North Carolina that Bush is not.
Regardless though, North Carolina is “close” for all five of these candidates against Clinton. It could very easily go either way. The differences between these five candidate pairs aren’t actually all that huge. North Carolina is looking like it will definitely be one of the swing states this cycle.
Looking back at Huckabee for a minute, we can see how this changes his “expected” result vs Clinton:
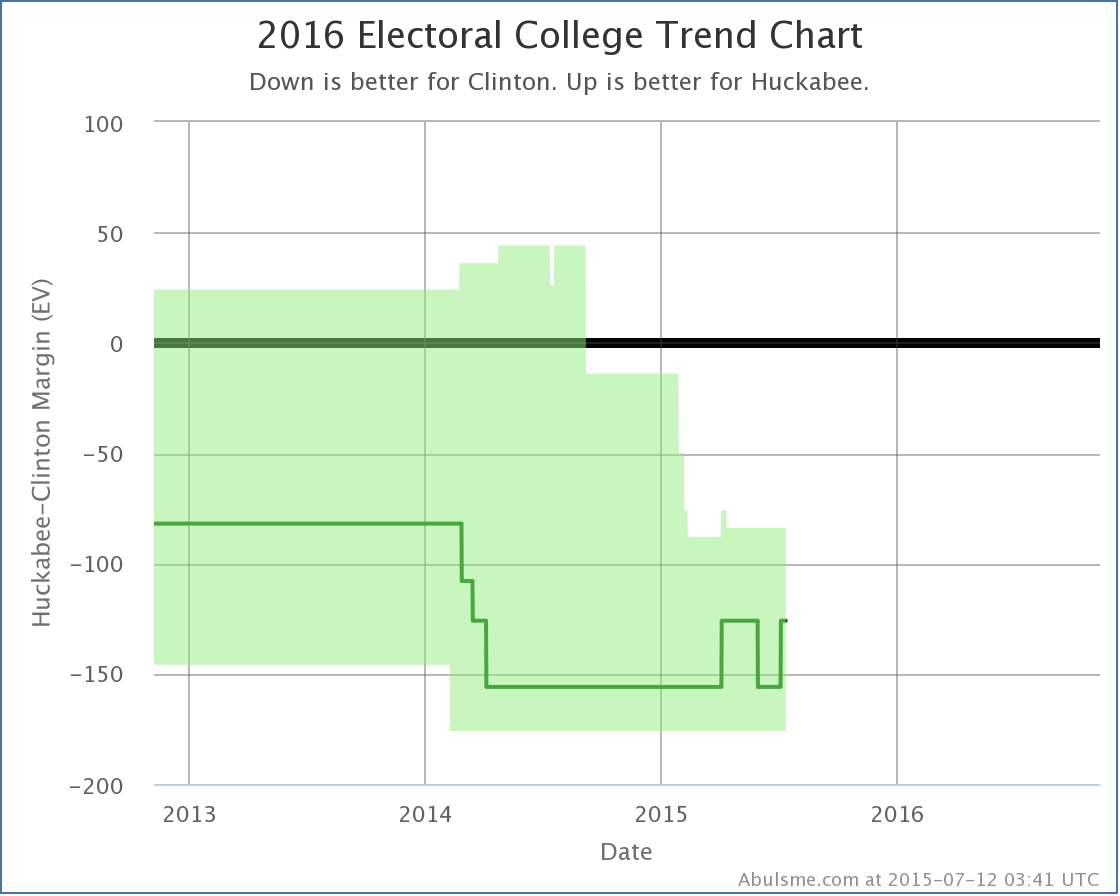
With North Carolina back in his column, if each candidate won every state they are currently ahead in, we end up with… Clinton 332 to Huckabee 206. This is a 126 electoral vote win for Clinton.
This is also an exact match for the 2012 election results, which were Obama 332 to Romney 206. Not only do the numbers match, but every single state matches. So with today’s polls, with Clinton and Huckabee, we essentially end up with an exact rerun of 2012.
Interestingly though, if you look at just the “expected” results such as the above, and not the “best cases” for each of the Republicans (where you give them all the states where Clinton is ahead by less than 5% too) then at the moment, somewhat shockingly I think… Huckabee is actually out performing each of the other four Republicans in the five best polled candidate combinations:
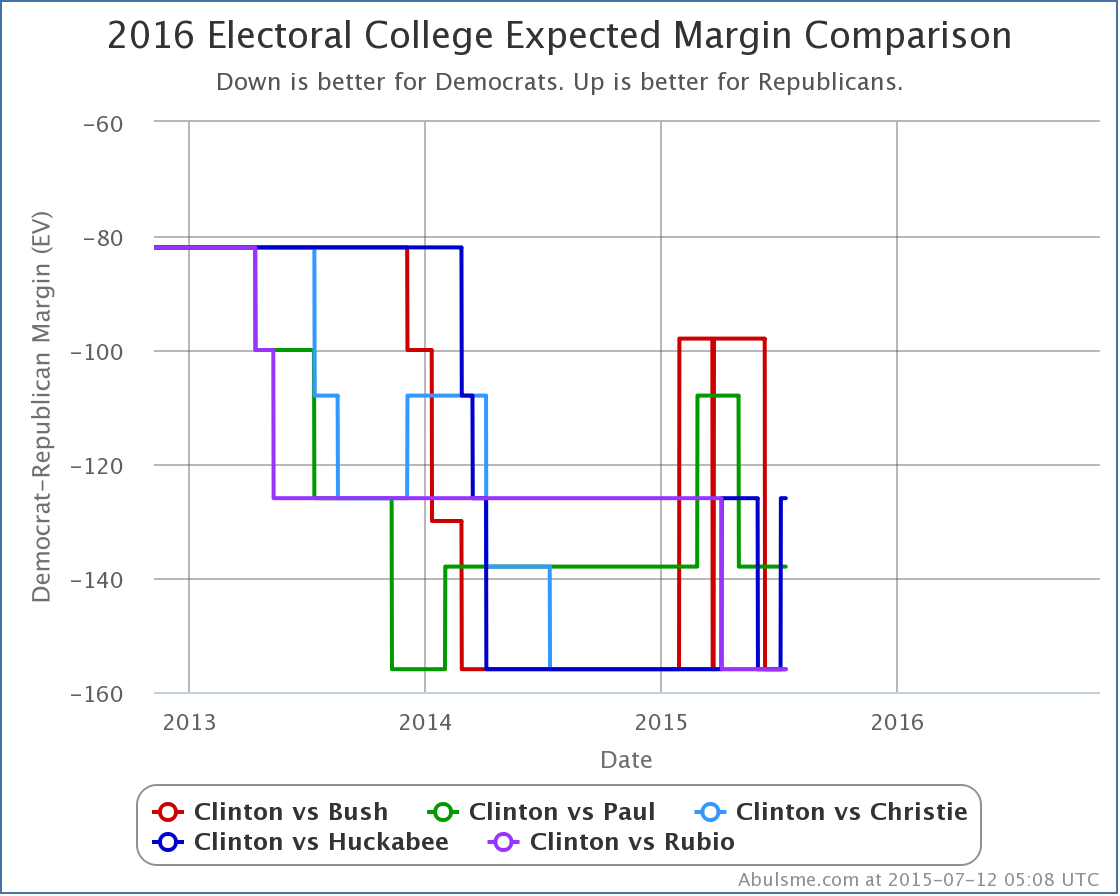
Of the five best polled candidates:
- Clinton vs Huckabee: Huckabee loses by 126 – exact match of 2012
- Clinton vs Paul: Paul loses by 138 – Paul gets all Romney states except NC (15 ev), but gains CO (9 ev)
- Clinton vs Bush, Christie and Rubio: Republican loses by 156 – Republican gets all Romney states except NC (15 ev)
So, with all the polling and back and forth so far and all my various squiggly lines… at least as of today… the only states that are shifted from 2012 for any of these five candidates against Clinton are Colorado and North Carolina. Barely any change at all!
But, as I always try to make sure to mention: All of these numbers are “if the election was held today” numbers, and the election is most certainly not held today! (And there are still many states with little or no 2016 polling yet.)
There will be a lot of events between now and the election, and a lot of campaigning, and a lot more polling. Plenty of time for things to change… potentially a lot.
485.8 days until the first polls close as I post this. Stay tuned!
Note: This post is an update based on the data on my 2016 Electoral College Analysis Site. All of the charts and graphs seen here are from that site. Graphs, charts and raw data can be found there for the race nationally and in each state for every candidate combination that has been polled at the state level. In addition, comparisons of the best polled candidate combinations both nationally and each in each state are available. All charts above are clickable to go to the current version of the detail page the chart is from, which may contain more up to date information than the snapshots on this page, which were current as of the time of this post. Follow @ElecCollPolls on Twitter for specific poll details as I add them.
|
|