States updated with new poll data since last update: Nevada, Florida, Kentucky, New Hampshire
Just a couple weeks ago we were talking about how Clinton’s lead in Florida had gotten quite large, and it moved out of the possible pickups for Trump. This was on the strength of a number of polls that covered mid-June that were very positive toward Clinton, showing leads as high as 15% in the state. The worst mid-June poll for Clinton still showed her ahead by 6%. Those polls have now rolled off the average, replaced by new polls much more favorable to Trump. With the two new Florida polls added in this update, things move very rapidly in Trump’s direction:
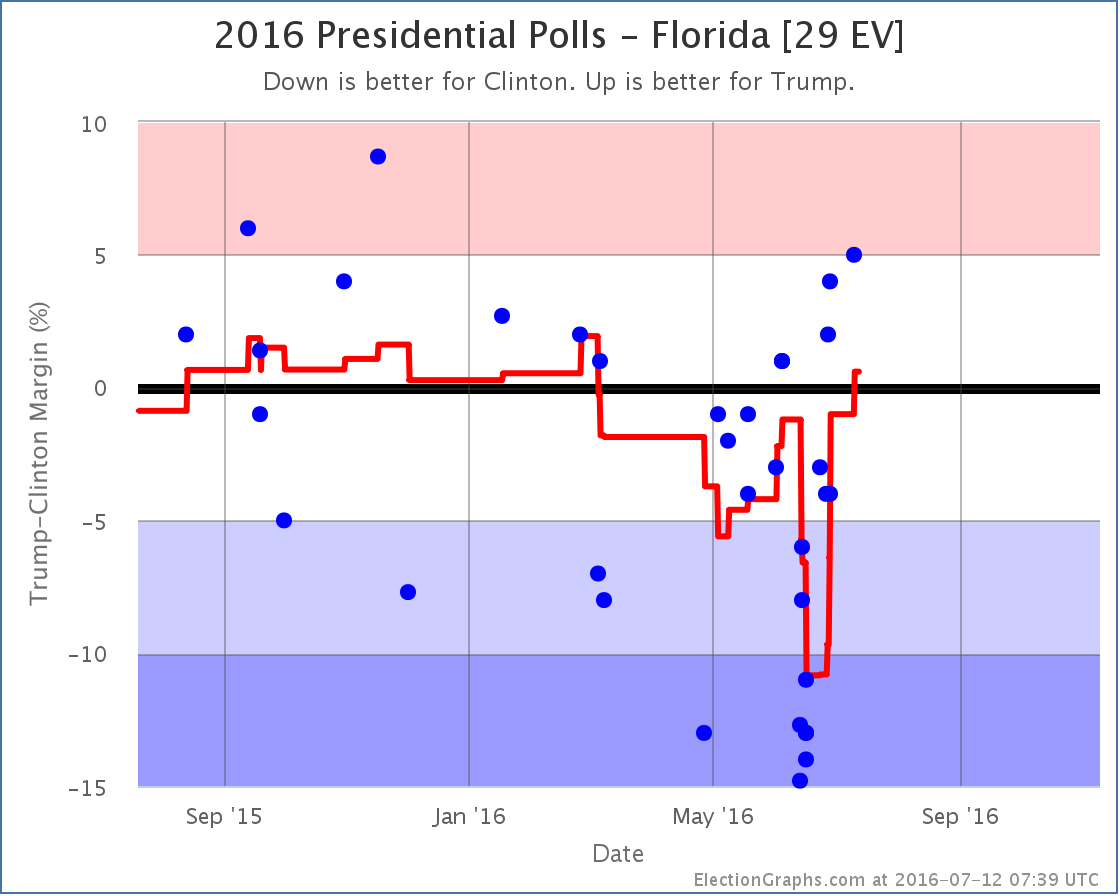
With the two new polls in the mix, the average moved from Strong Clinton to Weak Clinton on June 28th. But things kept getting better for Trump. On July 10th the average moved from Weak Clinton to Weak Trump.* Trump takes the lead in Florida for the first time since March. At 29 electoral votes Florida makes a huge difference.
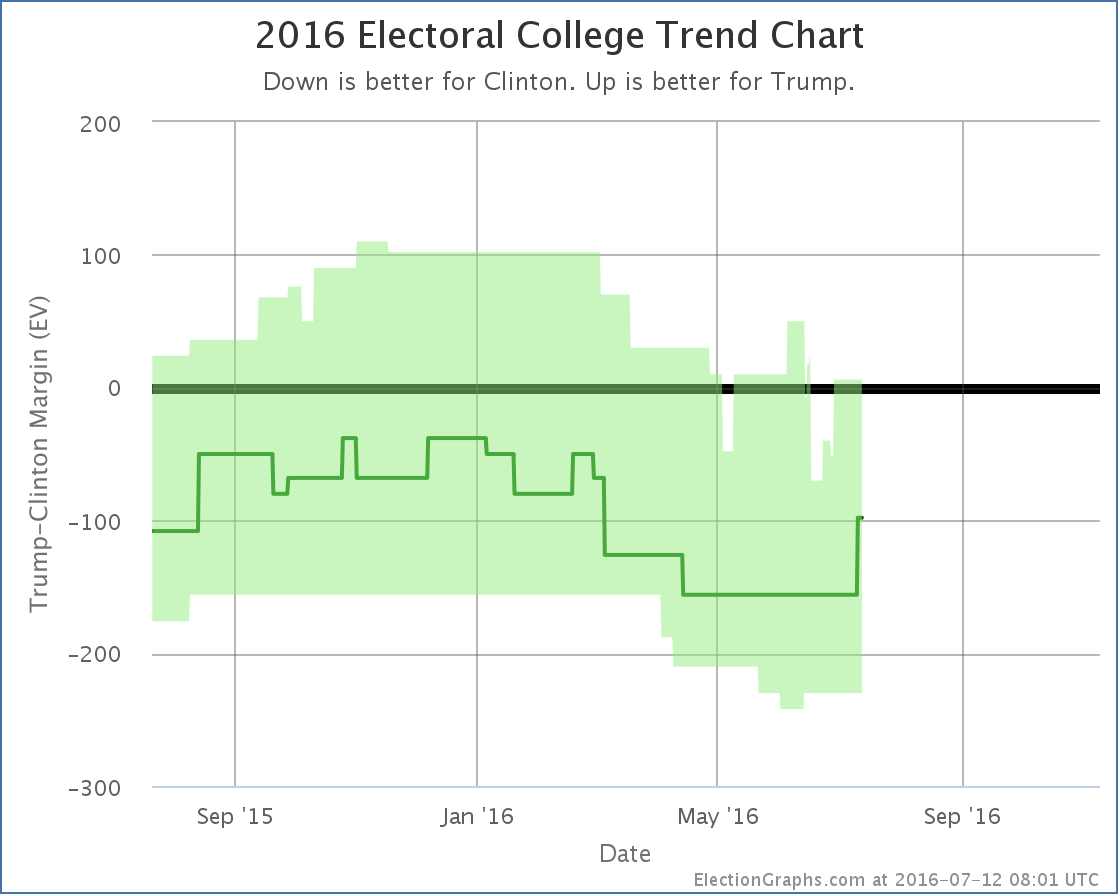
You can now see an upward movement on Trump’s best case a couple weeks ago, followed by the bump upward in the expected case more recently.
The electoral college view can move very quickly, especially when a big state like Florida swings its weight around. So after a few weeks of bad news for Trump and the trend looking like it was heading relentlessly against him, we now have the chart showing movement back toward Trump.
Trump is still behind, but once again he has a “best case” that includes him winning. With Florida not just in play, but actually on his side for the moment, if Trump wins all the states he is ahead in, plus all the states where Clinton leads by less than 5%, he squeaks out a narrow 6 electoral vote win.
In the “expected case” were each candidate wins the states they are ahead in, Trump now only loses by 98 electoral votes. This is now better than Romney’s 126 electoral vote loss as well as McCain’s 192 electoral vote loss. So while Trump is still losing, with current polling he is actually improving on the performance of the last two Republican candidates.
With Florida moving, the “tipping point” also moves:
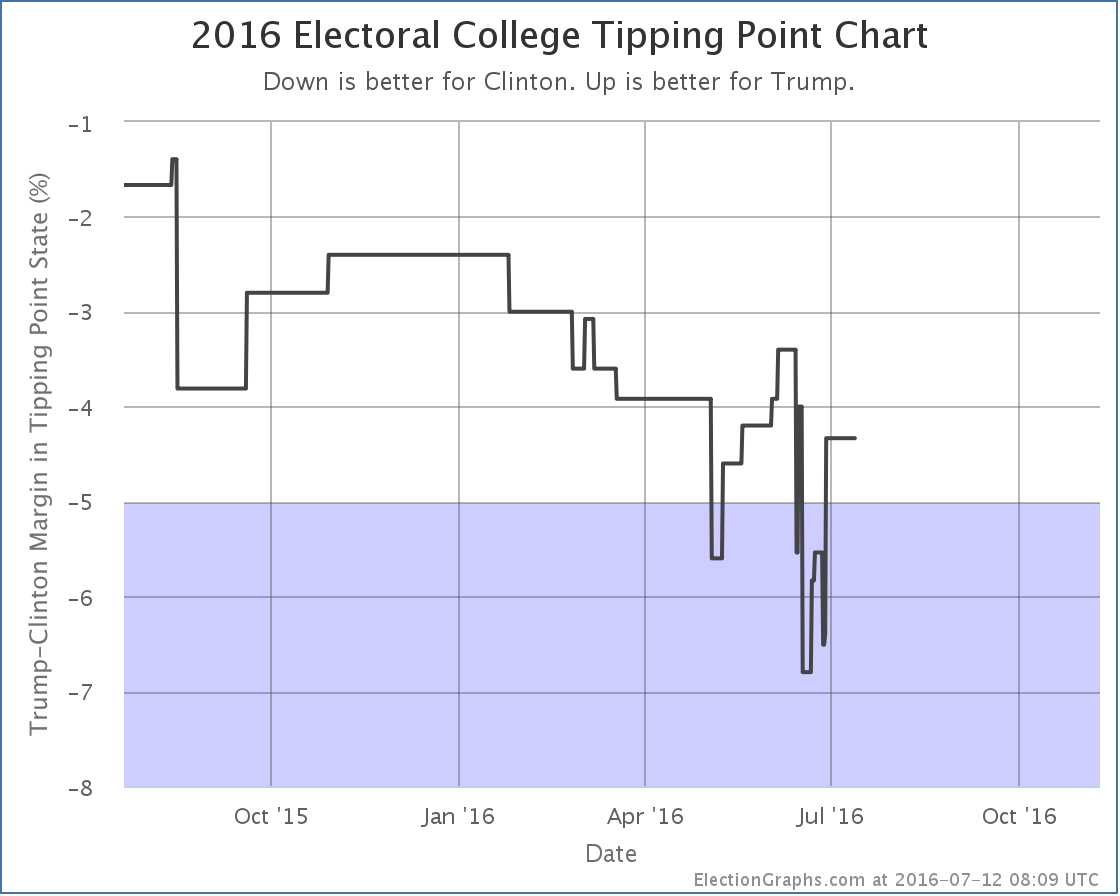
Before this update the tipping point was a 5.7% Clinton lead in Florida. Now it is a 4.3% Clinton lead in Ohio.
One thing to point out in both of the graphs above is that we see a lot of volatility in the “Trump best case” and “tipping point” lines in the last couple of months. This is the natural result of general election polling ramping up once the nominations were settled. States that are near the tipping point or near category boundaries will “twinkle” as new polls cause the averages to bounce around. This will only increase as we get closer and closer to November. Although I post updates each time states move around in this way, it is important to watch the longer term trends, while remembering that things can sometimes shift quickly.
For now though, the current summary looks like this:
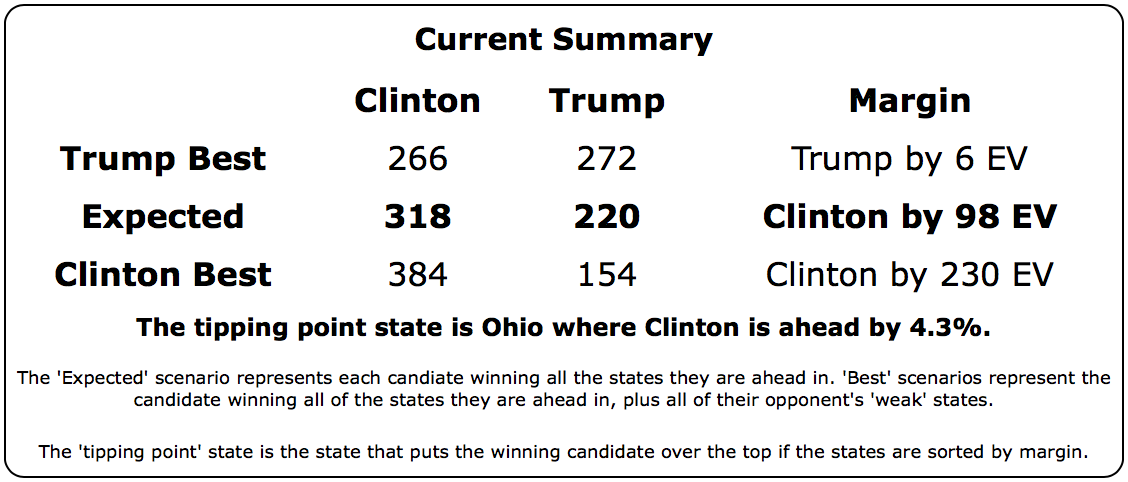
It is hard to overstate the importance of Florida here. With Florida out of reach, Trump’s best case was to lose. With Florida on his side, a win is once again in reach, although he still needs to flip every single one of Nevada, New Hampshire, Colorado, North Carolina, and Ohio to do it.
119.7 days until polls close on election day. Less than 6 days until the gavel drops on the Republican convention.
* For those wondering why in this single update we start referencing changes that happened in the average on June 28th and July 10th rather than a change that happens as of this update, this is because the graphs reflect changes due to polls at the mid-dates of the time they were in the field, not at the time the poll is announced, or the time I enter the poll into my data. So today two polls were added, the first covered June 26 to 28 and the second covered July 9 to 10. These became the most recent and 4th most recent polls I know about in Florida, and the line showing the average adjusts to reflect changes at the midpoint of those date ranges.
Note: This post is an update based on the data on ElectionGraphs.com. Election Graphs tracks both a poll based estimate of the Electoral College and a numbers based look at the Delegate Races. All of the charts and graphs seen in this post are from that site. Additional graphs, charts and raw data can be found there. Follow @ElectionGraphs on Twitter or like Election Graphs on Facebook to see announcements of updates or to join the conversation. For those interested in individual general election poll updates, follow @ElecCollPolls on Twitter for all the polls as they are added. If you find the information in these posts interesting or useful, please consider visiting the tip jar.
[Blog Post] Electoral College: In big move, Trump takes lead in Florida again https://t.co/N1EkxoyuIu
RT @ElectionGraphs: [Blog Post] Electoral College: In big move, Trump takes lead in Florida again https://t.co/N1EkxoyuIu
Trump signs are already popping up in my neighbors’ yards here in FL.
Ah, the all important lawn sign metric. :-) The range in polls in Florida has been insane in the last month. From Clinton +15% to Trump +5%. It is just all over the place. Suspect it will settle to just being a very close state as has been the habit there lately. :-)