The election is over, and Sam and Ivan are here on Curmudgeon’s Corner to discuss how things turned out. You’ll hear their thoughts on the overall results, problems with polling, how things went in Florida and Georgia, the Senate results, how Trump is reacting, and much more. They have to toss in a few other things even on a big politics week, so Ivan talks about a random technological observation from the 1990s in Argentina, Sam notes a major milestone for the show, and of course, they can’t go a week without at least some pandemic talk. As an extra bonus, after the show proper, you can listen to a condensed version of the Curmudgeon’s Corner election night live stream. Enjoy!
Click below to listen and subscribe!
1-Click Subscribe in iTunes View Podcast in iTunes View Raw Podcast Feed Download MP3 File Follow the podcast on Facebook Support us on Patreon
Show Details:
Recorded 2020-11-07 Length this week – 3:20:49
(0:00:01-0:02:11) Time Check
(0:02:34-2:11:25) The Actual Show
Arcades in Argentina in the 1990’s
Episode 700
Exhaustion
No repudiation
Polling problems
Losing Florida
Red mirage
Winning Georgia
The Senate
Biden’s unity theme
Slow calls
Trump reaction
Trump in court
Progressives vs centrists
Lots of racists
Pandemic trends
(2:11:43-3:20:48) Condensed Live Show
The Curmudgeon’s Corner theme music is generously provided by Ray Lynch.
Our intro is “The Oh of Pleasure” (Amazon MP3 link)
Our outro is “Celestial Soda Pop” (Amazon MP3 link)
Both are from the album “Deep Breakfast” (iTunes link)
Please buy his music and support his GoFundMe.
On this week’s Curmudgeon’s Corner, Sam and Ivan’s main topics are the COVID pandemic, SCOTUS developments and their political ramifications, and of course Election 2020. Really, what else would they talk about this week? Oh. Yeah. Headphones. They also talked about headphones. Because of course they did.
Click below to listen and subscribe!
1-Click Subscribe in iTunes View Podcast in iTunes View Raw Podcast Feed Download MP3 File Follow the podcast on Facebook Support us on Patreon
Show Details:
Recorded 2020-09-26
Length this week – 2:16:02
(0:00:23-0:15:16) But First
Headphone choices
Podcast audio quality
(0:15:57-0:51:07) Pandemic
Florida is done
Schools
Data-driven decisions
Retail collapse
The recovery
(0:53:09-1:30:11) SCOTUS
Vote timing
The downward spiral of failing democracy
Delaying tactics?
Election cases?
(1:30:58-2:15:40) Election 2020
Possible election results shenanigans?
The interregnum if Biden wins
Election Graphs’ odds
The interregnum if Trump wins
Scenario if Biden wins, but Republicans keep the Senate
The election is close now
The Curmudgeon’s Corner theme music is generously provided by Ray Lynch.
Our intro is “The Oh of Pleasure” (Amazon MP3 link)
Our outro is “Celestial Soda Pop” (Amazon MP3 link)
Both are from the album “Deep Breakfast” (iTunes link)
Please buy his music and support his GoFundMe.
This week on Curmudgeon’s Corner, Sam and Ivan talk about the Cohen hearings, the North Korean summit, Ivan’s trip to Vietnam, the Florida sex trafficking ring, and the India/Pakistan conflict. Plus, a reminder of the upcoming Seattle meetup.
Click below to listen and subscribe!
1-Click Subscribe in iTunes View Podcast in iTunes View Raw Podcast Feed Download MP3 File Follow the podcast on Facebook Support us on Patreon
Show Details:
Recorded 2019-03-02 Length this week – 1:46:54
(0:00:20-0:22:38) But First
Agenda
Seattle Meetup
Ivan in Vietnam
(0:23:22-1:08:54) Cohen Testimony
Everything priced in?
Republican response
AOC performance
Cohen’s receipts
Cohen denials
Democratic plans
(1:10:03-1:24:01) North Korean Summit
How not to do a summit
Trump trusting dictators
Credit for Trump?
(1:25:21-1:46:34) Mini Lightning Round
Ivan: Florida sex trafficking ring
Sam: India and Pakistan
The Curmudgeon’s Corner theme music is generously provided by Ray Lynch.
On Curmudgeon’s Corner this week, Sam and Ivan dive into the latest developments in the Trumpcare saga, the revelation of the second Trump/Putin meeting, and Trump’s revealing interview with the New York Times. Rounding out the show, shorter discussions of wearing different sorts of glasses, John McCain’s diagnosis, odd happenings in Florida, and some factoids from Wiki of the Day.
Click below to listen and subscribe!
1-Click Subscribe in iTunes View Podcast in iTunes View Raw Podcast Feed Download MP3 File Follow the podcast on Facebook Support us on Patreon
Show Details:
Recorded 2017-07-20
Length this week – 2:15:16
(0:00:58-0:38:59) But First
Agenda
Glasses
John McCain
Beep update
Mensch correction
Florida tag
WotD factoids
(0:39:38-1:12:56) Healthcare
Feedback
Several rounds
The conservative case
Entitlement ratchet
Deal making
Bipartisan approach
Odds for Trumpcare
Obamacare crash and burn
Logic of repeal only
(1:13:32-1:38:47) Trump and Putin
Trump on Russian winters
1st Trump/Putin meeting
2nd Trump/Putin meeting
Perceptions
Expanding Don Jr meeting
7 circles of Trump
Too stupid to know?
Quid pro quo?
(1:40:07-2:14:57) Trump Interview
Trump on Sessions
Staffing agencies
Christie’s cellphone
Why aren’t more people quitting?
Trump on Mueller
Manafort finances
Trump on other people
The Curmudgeon’s Corner theme music is generously provided by Ray Lynch.
States with new poll data added since the last update: All 50 states and DC.
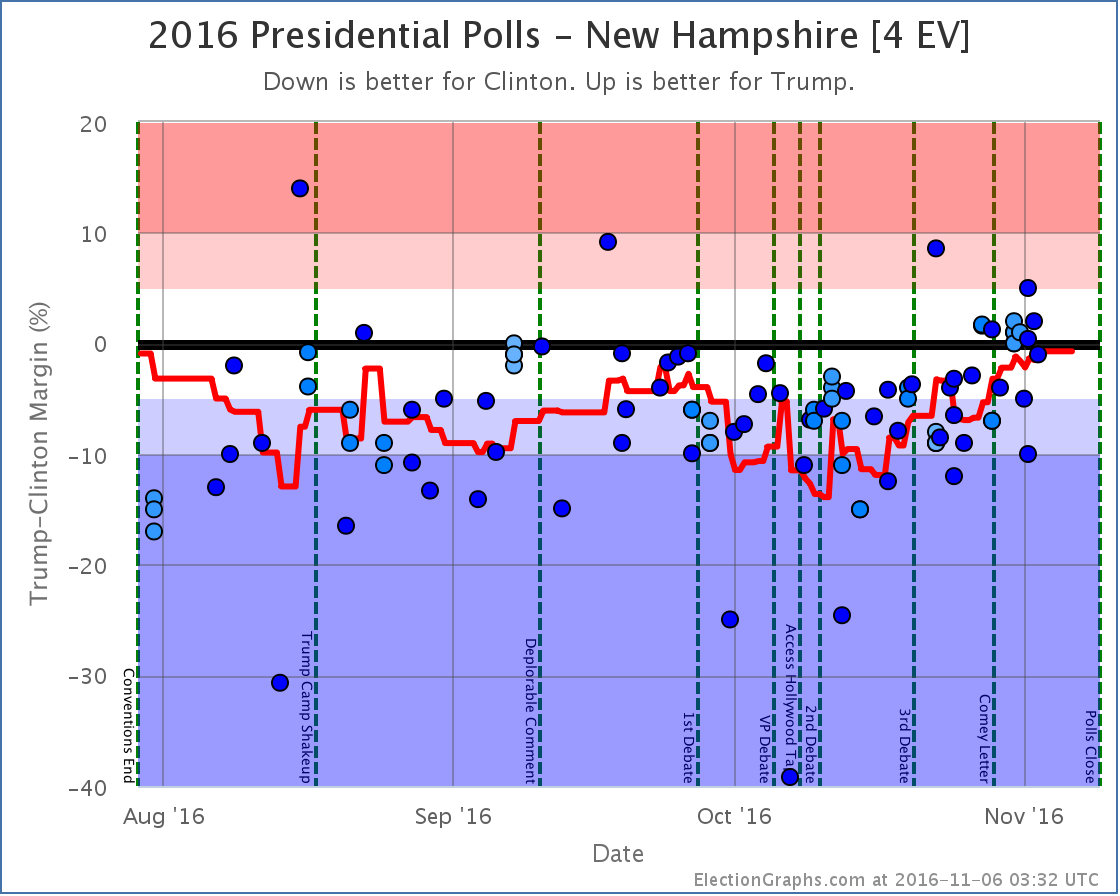
Notable changes in: Florida (29), North Carolina (15), Wisconsin (10), Colorado (9), Nevada (6), New Hampshire (4), and the tipping point
National Summary
It has been about two days since the last update. While there are mixed changes since then, on balance this is a good update for Trump, and the race looks closer than it did two days ago.
There will be one more update later today to capture any last minute polls released after the cutoff for this update. (There have already been a handful.)
Good for Trump
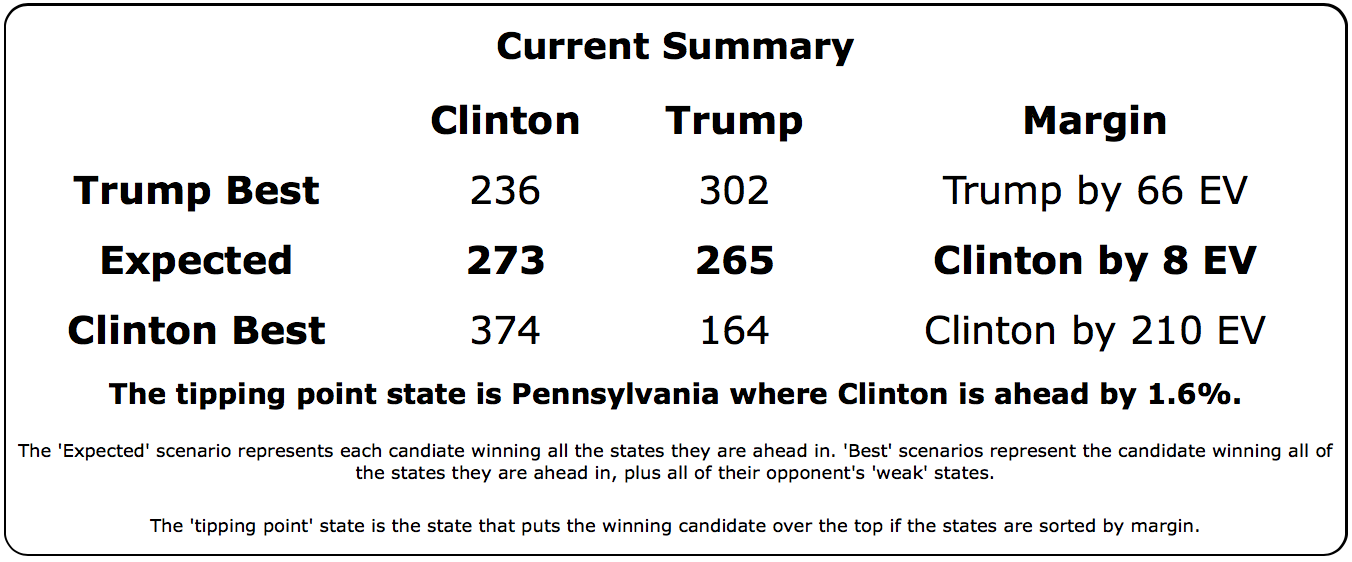
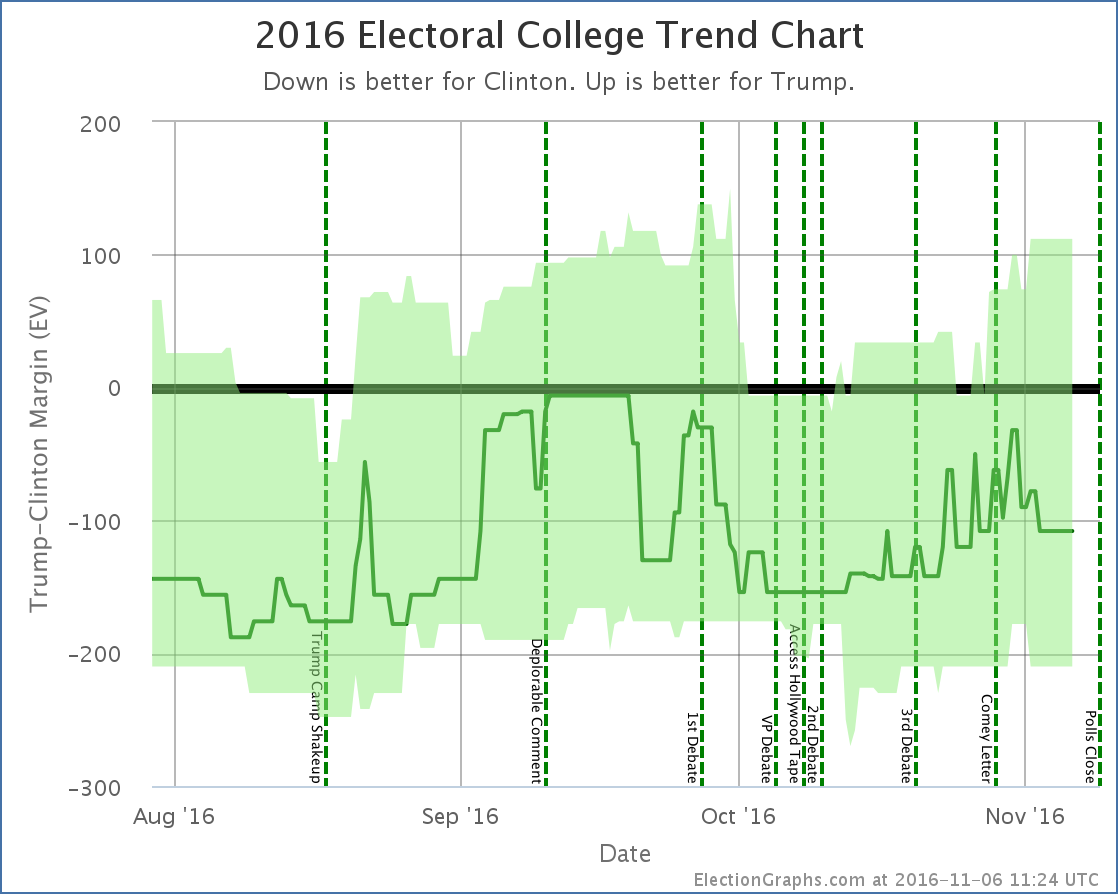
The expected case moves from Clinton winning by 108 EV to Clinton winning by only 8 EV.
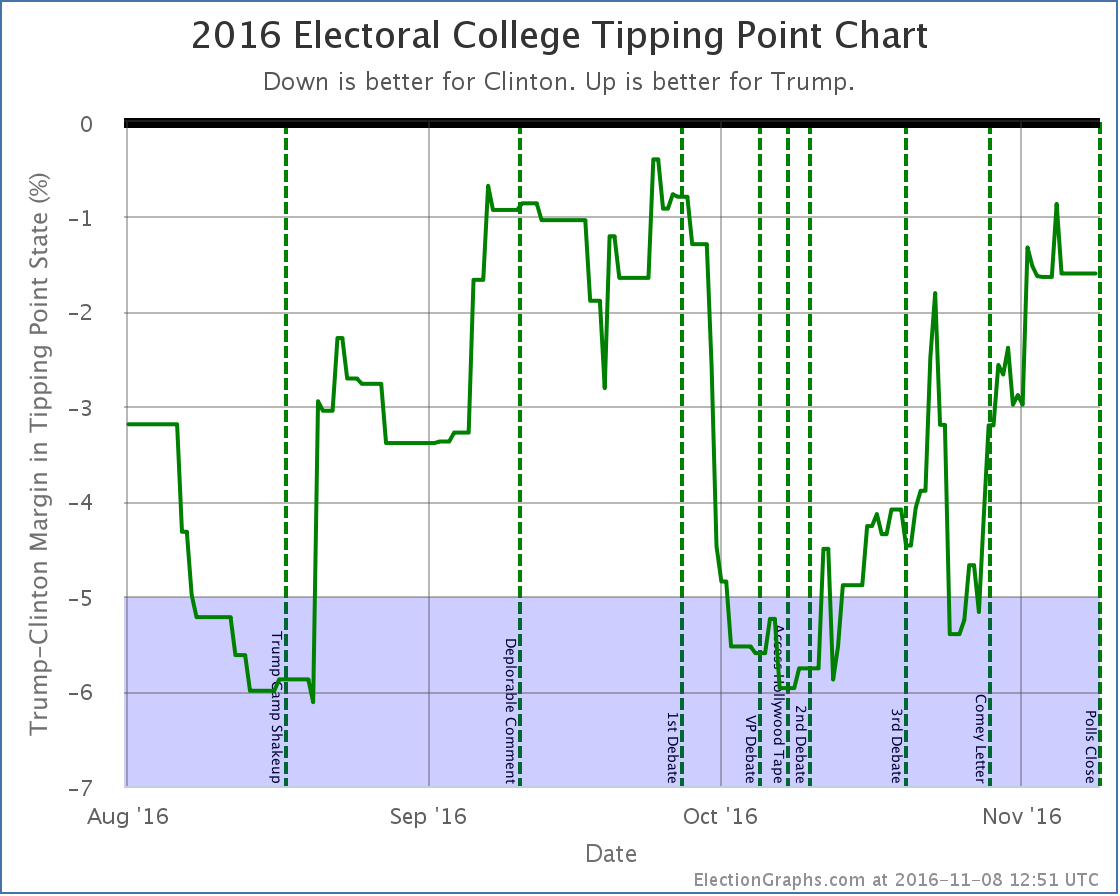
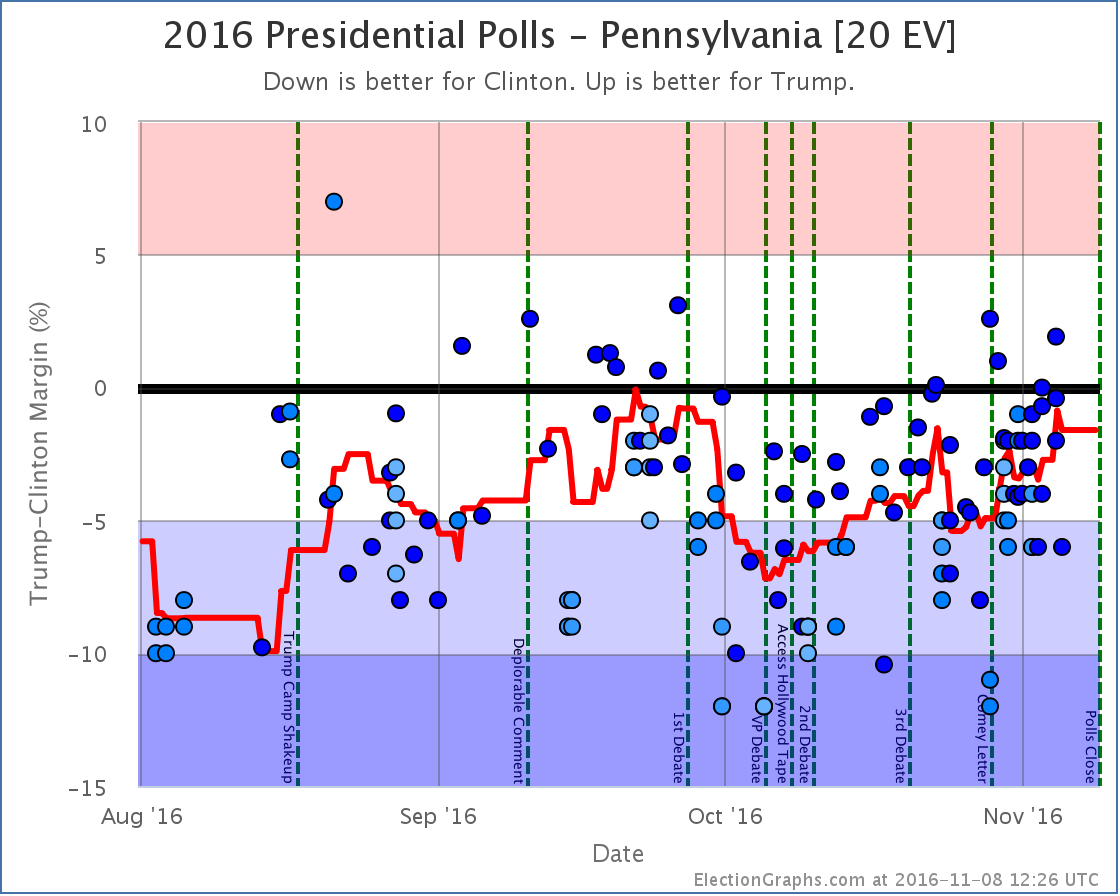
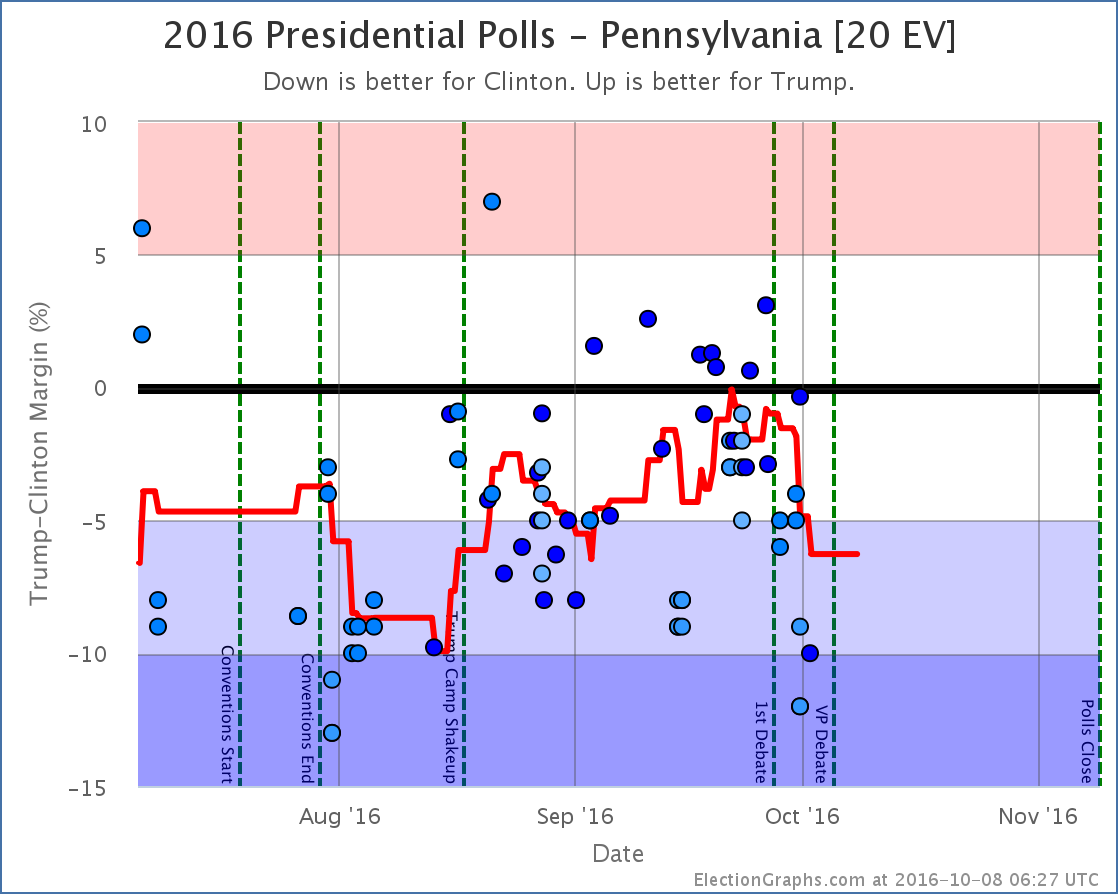
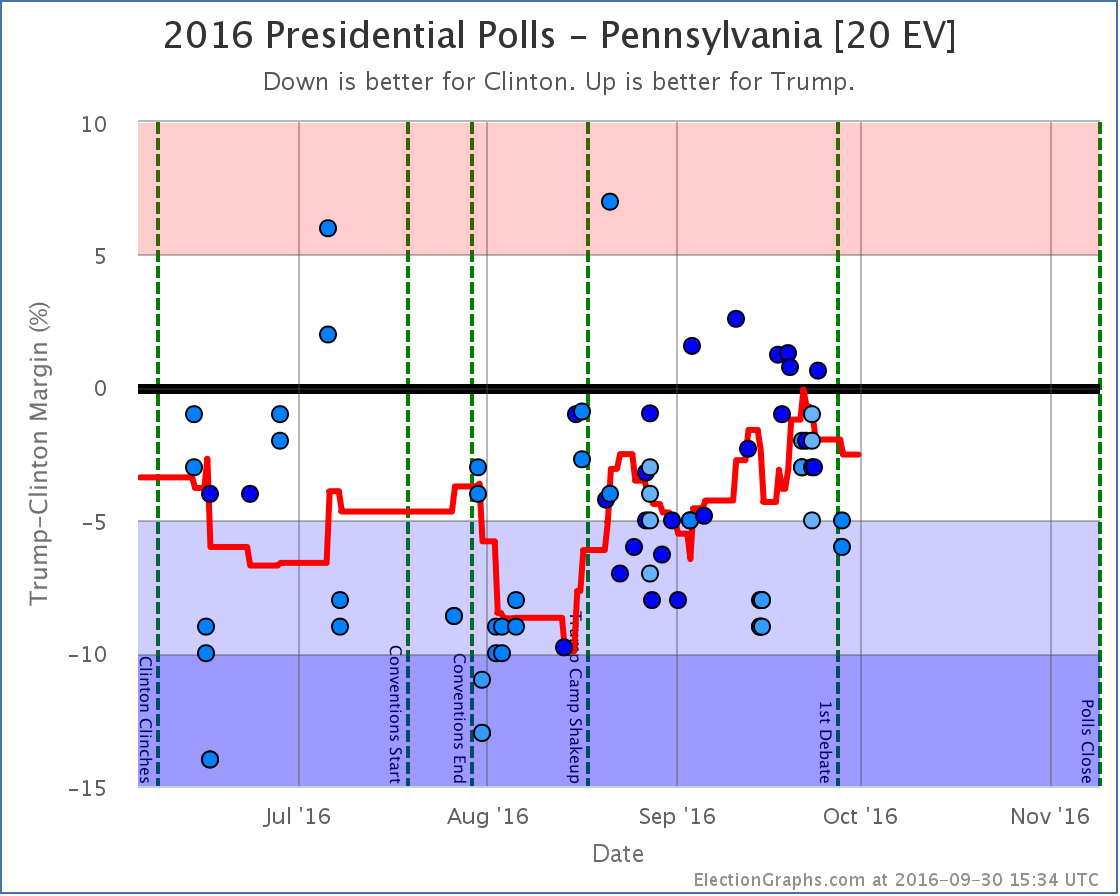
The tipping point moves from Clinton by 1.8% in NC to Clinton by 1.6% in PA
Good for Clinton
Trump’s best case has deteriorated from a 112 EV win to only a 66 EV win
No Change
Clintons best case remains steady at a 210 EV win
Charts
Discussion
The fact that Trump’s best case is getting worse is pretty much irrelevant. Either candidate winning all the close states is a very low probability event. A few months out it is good to show how things might reasonably move. But on election day, the expected electoral college and the tipping point are the two numbers to watch.
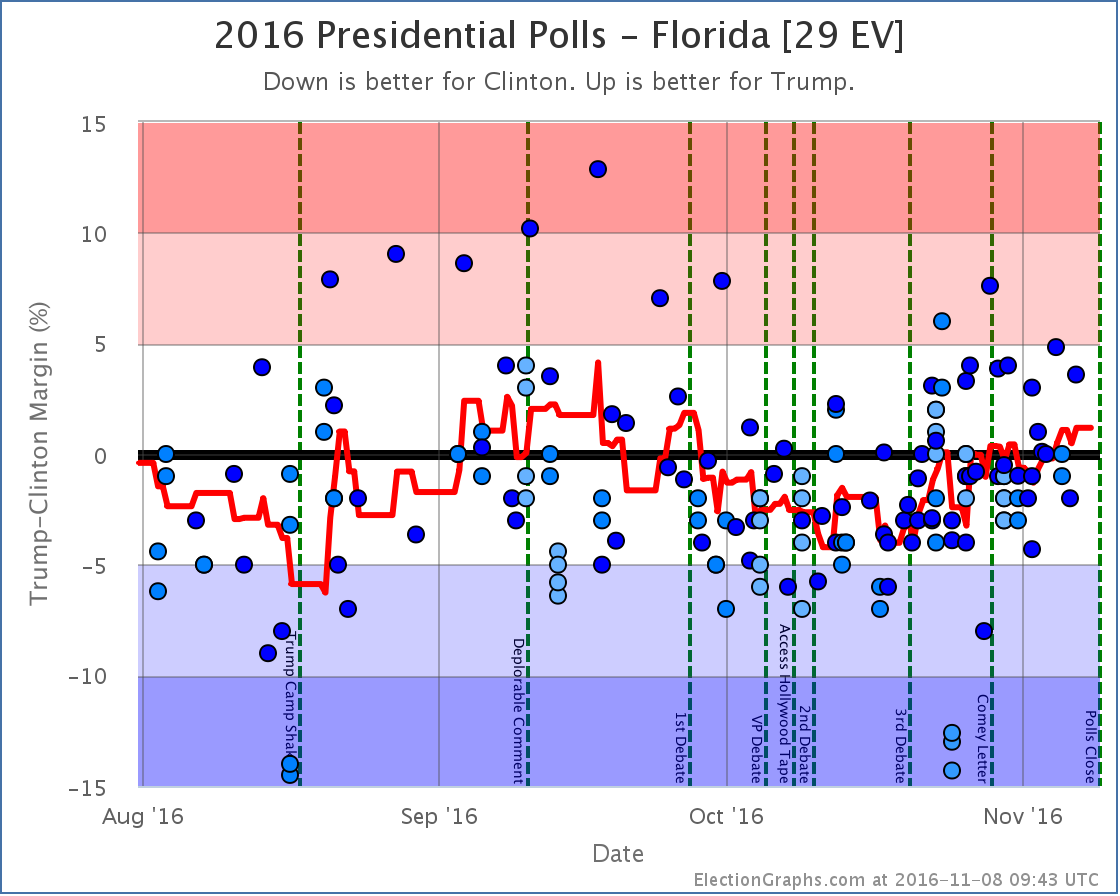
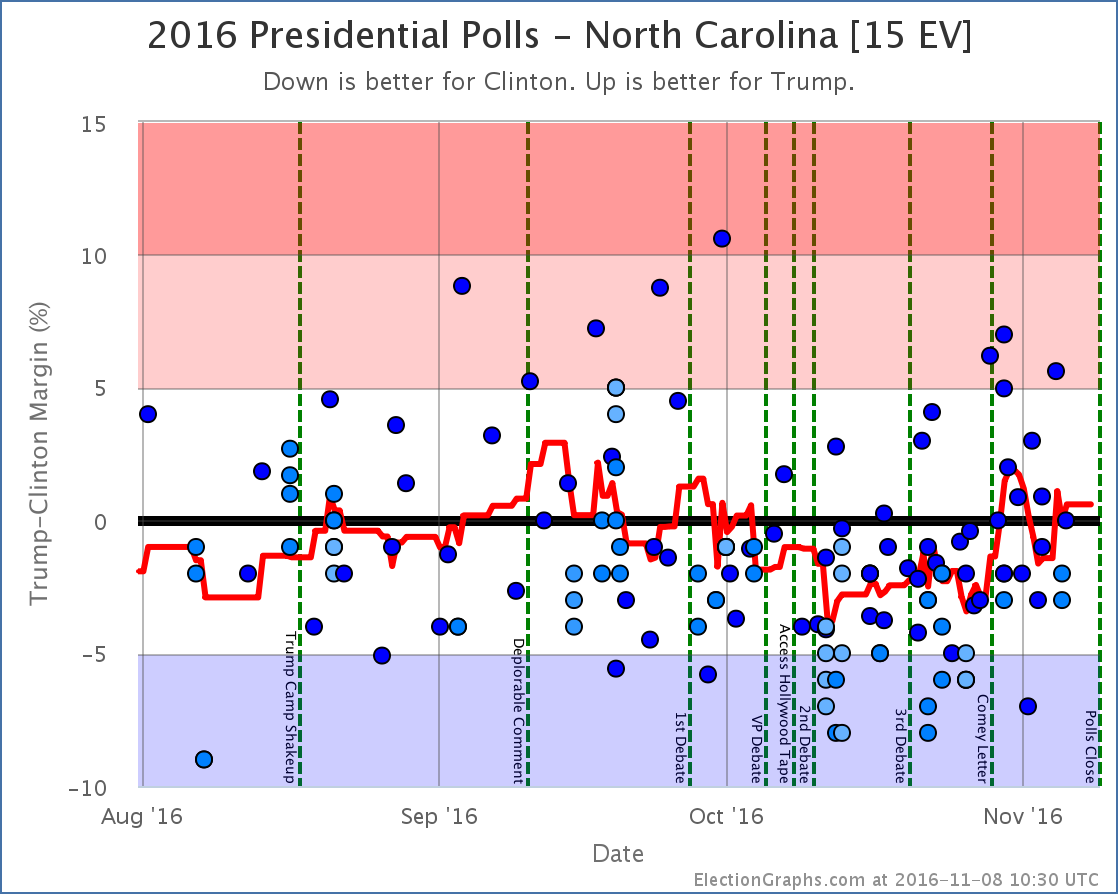
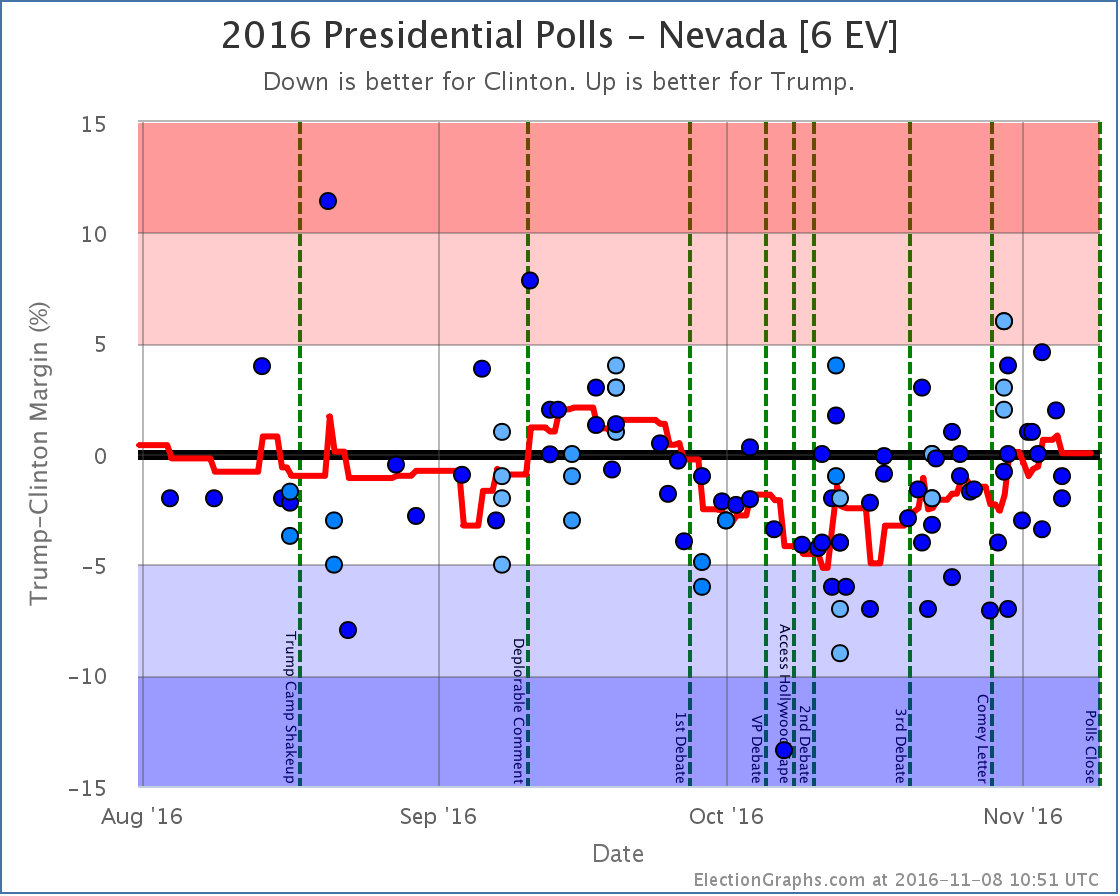
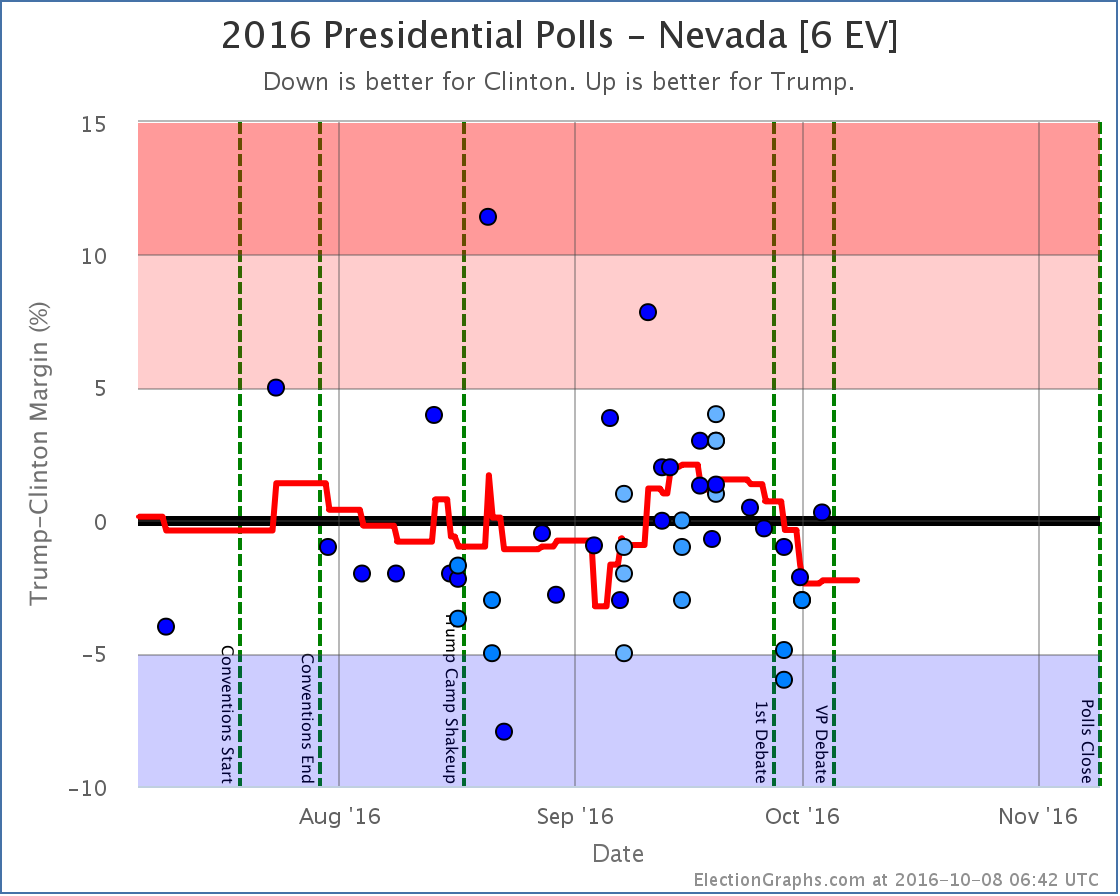
In the last update I speculated that because the tipping point and expected electoral college votes were going in different directions Trump may have topped out. But the movement toward Trump seemed to have a little bit of life in it yet. With the latest batch of update, the Election Graphs poll averages for Florida, North Carolina, and Nevada all move from just barely blue to just barely red. And the tipping point gets a bit narrower too.
Some have suggested there may a strategy to intentionally release Republican leaning polls at the last minute specifically to influence the poll averages, and the impact of some of these polls has been shown to be significant. This probably has something to do with the moves here too. But this site’s philosophy is to basically include all polls with very few exceptions, and when you throw everything in, this is the move you get. Given non-poll-related information on early vote results and such, I have my doubts about Florida and Nevada, but this site will stick to what the numbers say…
…and the numbers say that it is looking very close again. In the expected case Clinton wins by only 8 electoral votes. To flip the election, Trump only has to win Pennsylvania, and Clinton’s lead there is down to 1.6%.
The tipping point margin isn’t quite as small as it it was in September when it was down to 0.4%, but it is close enough that you could easily imagine a Trump win. Right?
Lets check the sites doing odds again for what they think the chances of a Trump win are…
The median estimate of Trump’s chances 2 days ago was 12%. Now it is 14%. So, slight increase, but not a huge one. And if you look at the individual estimates above, many actually went down since two days ago. But if everything is closer, why?
Well, each of the models of course have their own methods, and the movements in each would have a different explanation. Some of them discount or don’t include at all some of the pollsters showing the Trump movement that has moved my averages.
But just looking at the state of the race as a whole instead of specific models… Trump has never been ahead in the electoral college, by most measures he hasn’t ever led the popular vote either, and he’s also never led in Pennsylvania (or the other further off states he would have to flip to win).
So even taking the averages here at face value, and not doubting the status of Florida or Nevada, to win Trump would still need to break his September ceiling and do better than he has done at any time in this race so far. That is possible, but not likely.
Add to that the indications of high Hispanic turnout in several states, notably Florida and Nevada, and that some of the recent polls may be intentionally skewed… and it seems like if someone over performs their polls, it is more likely to be Clinton. But that is looking at things other than the polls themselves.
All and all, the new median of a 14% chance of a Trump upset seems about right.
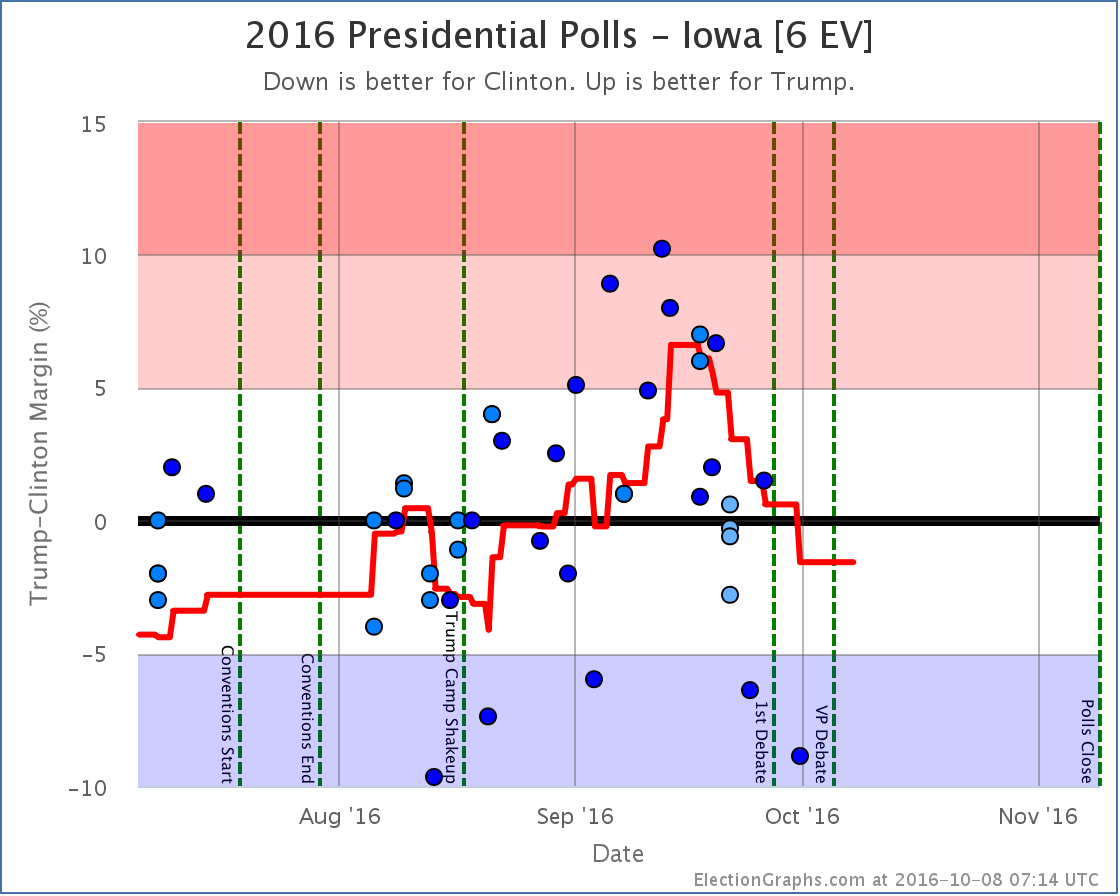
Maine CD2, Pennsylvania, Nevada, North Carolina, Florida, and Iowa are all within 2% at the moment. They could still go either way based on the current averages. That is enough to swing the election.
So, as has been the case for awhile, a Trump win would be surprising, but should not be shocking. Trump has a path.
We shall all see soon enough.
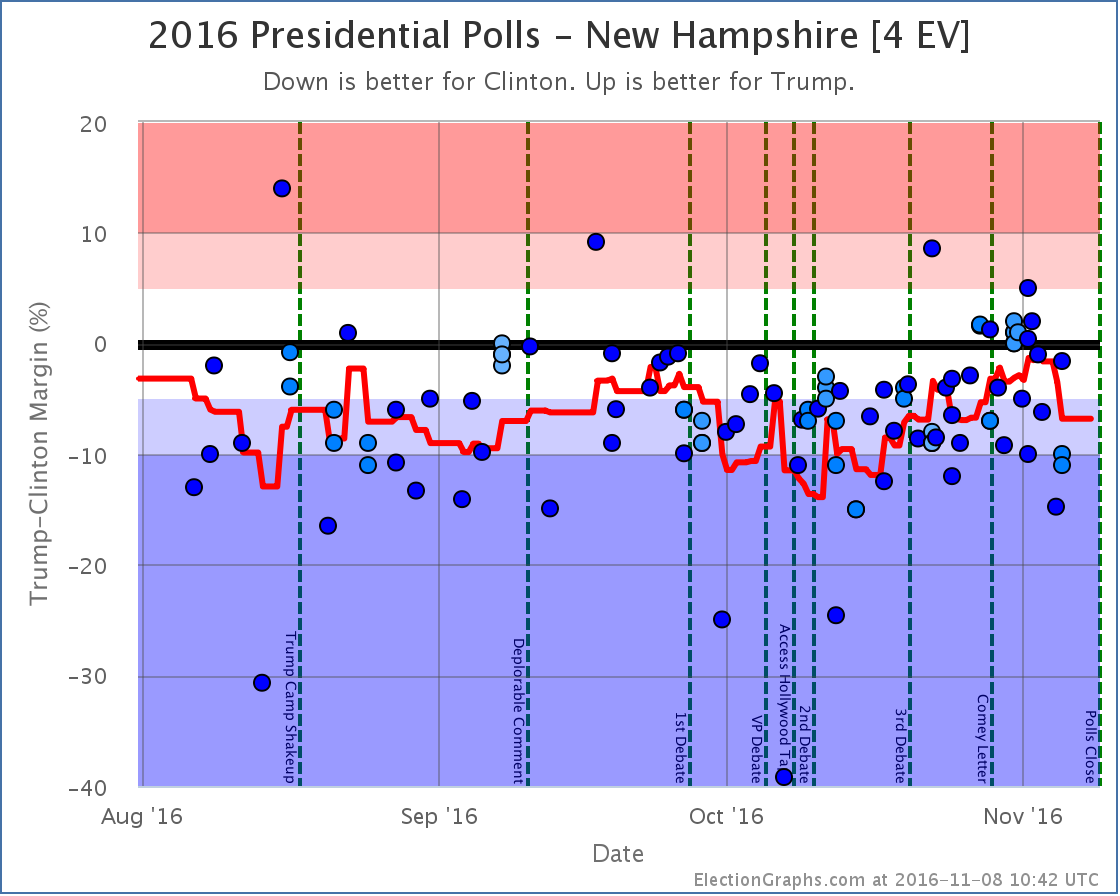
In New Hampshire we already have some results of course… Dixville Notch, Harts Location, and Millsfield have already reported results. The totals: Trump 32, Clinton 23, plus a handful of votes for others. So there you go.
For real meaningful results, we now have less than 8 hours until parts of Indiana and Kentucky close. Then less than 9 hours until the first full states close and the states start getting called one way or the other.
We are almost there.
State Details
The following are the detailed charts for all the states that influenced the national changes outlined above.
Moving from Clinton to Trump
No longer possible pickups for Trump
Also impacting the tipping point
A note about faithless electors
In the past few days there have been reports of first one, then two, expected electors from Washington state saying that that have decided to or are considering being “faithless electors” by voting for someone other than who they are “supposed to” when the Electoral College votes in December.
Yes, they can do that. In Washington state there would be a $1000 fine if they did, but they can do it, and it would count.
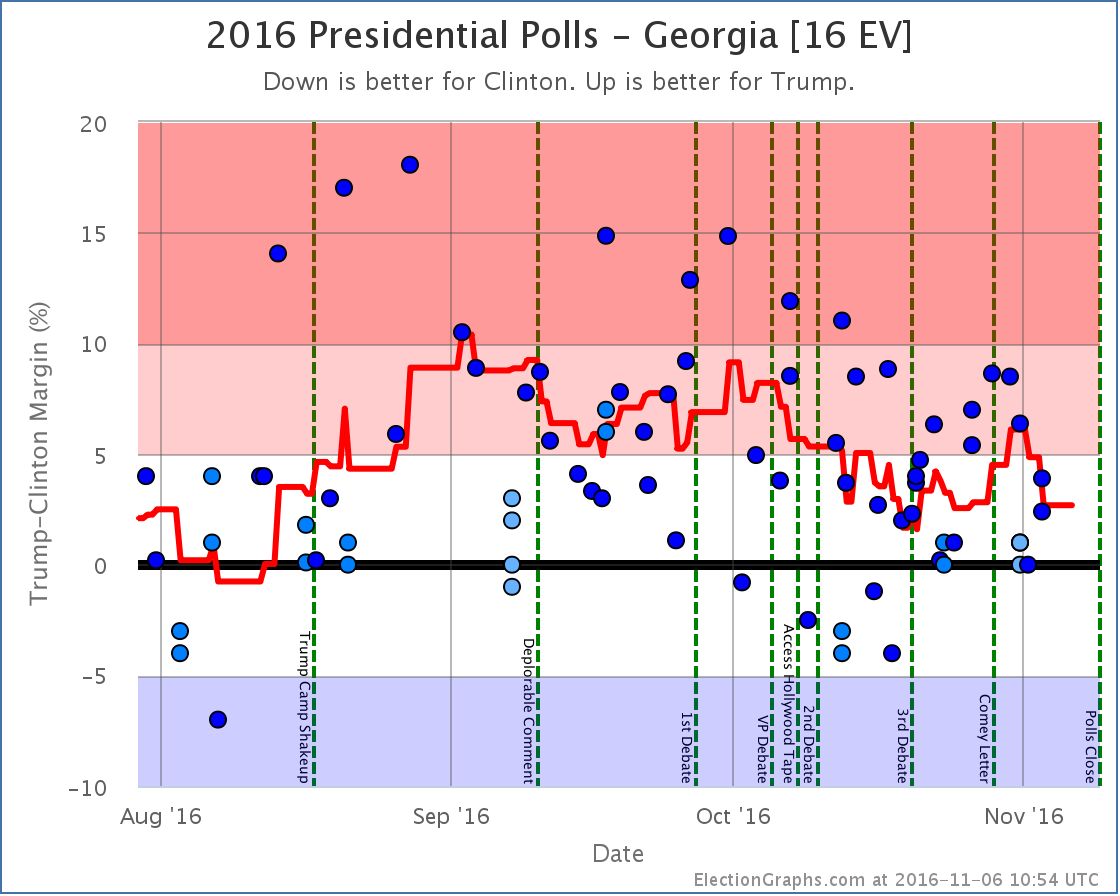
There was also one other potential elector from Georgia who suggested they would be faithless back in August. That potential elector came under extreme pressure and resigned, to be replaced by someone who would presumably vote the “right” way.
That might well happen to these two as well. But faithless electors can and do happen every few election cycles. In the last 50 years there were faithless electors in 2004, 2000, 1988, 1976, 1972, and 1968. That is 6 out of 12 elections during that period. Half. It would not be surprising if there were one or more faithless electors in 2016, especially given the contentious nature of the race. They have never made a difference in the final outcome.
The Election Graphs estimates show what the results “should be” given who wins various states. They do not take into account statements by individual electors on their intentions. If a scenario arises where it is close enough for electors who have made statements like this to potentially make a difference in the outcome or throw the race to the House, we will of course make note of that. And once electors vote in December, we will show the final tallies, including any votes cast by faithless electors.
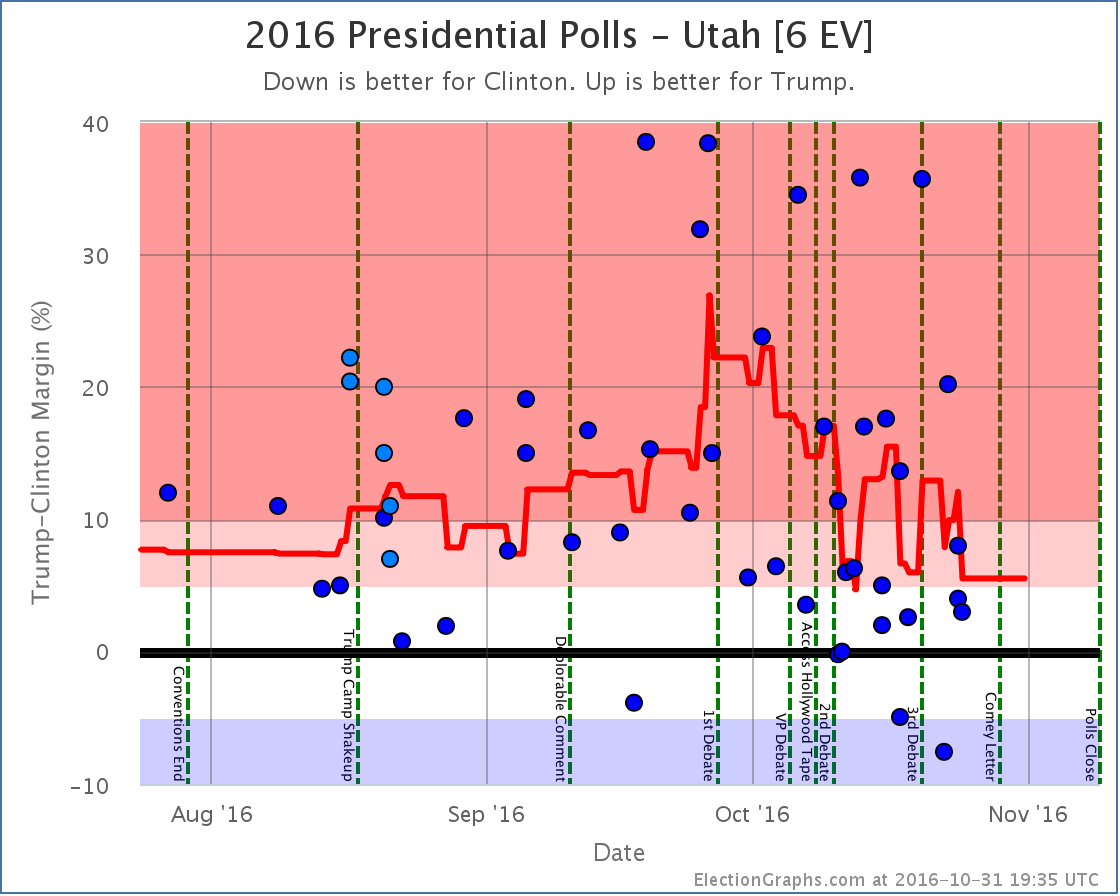
A note about McMullin
Right now the Real Clear Politics average in Utah has McMullin 12.4% behind the lead. The 538 average in Utah has him 9.4% behind the lead. Although McMullin was a lot closer than anyone expected, he never got closer than 5% to the lead in Utah in these averages and now appears to be fading. 538 still has him in second place, but it doesn’t seem likely at this point that he will win electoral votes.
For more information…
This post is an update based on the data on ElectionGraphs.com. Election Graphs tracks a state poll based estimate of the Electoral College. All of the charts and graphs seen in this post are from that site. Additional graphs, charts and raw data can be found there. Follow @ElectionGraphs on Twitter or like Election Graphs on Facebook to see announcements of updates or to join the conversation. For those interested in individual general election poll updates, follow @ElecCollPolls on Twitter for all the polls as they are added. If you find the information in these posts interesting or useful, please consider visiting the tip jar.
States with new poll data added since the last update: All 50 states and DC.
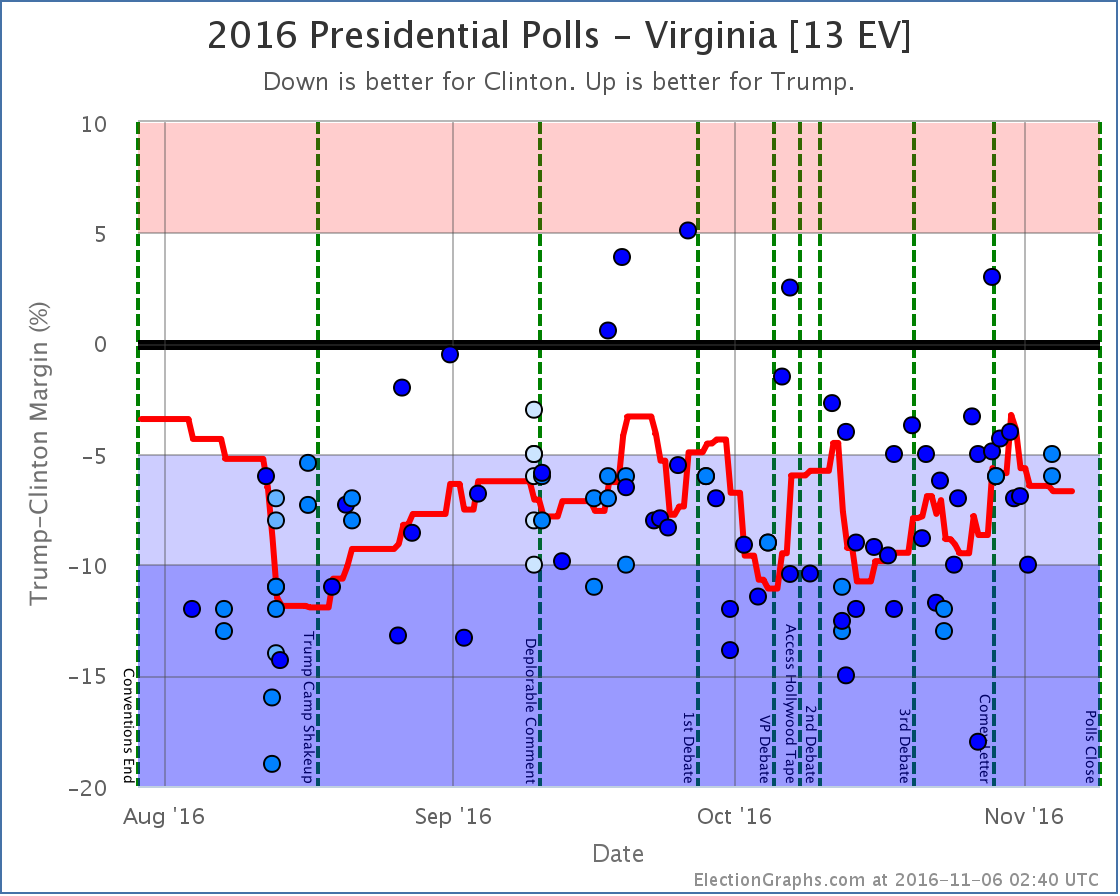
Notable changes in: Florida (29), Georgia (16), North Carolina (15), Virginia (13), Wisconsin (10), Colorado (9), Iowa (6), and the tipping point.
National Summary
It has been about two days since the last update. Since then the changes have been mixed, indicating that perhaps the recent movement toward Trump has topped out.
Good for Trump
The tipping point moves from Clinton by 2.2% in NH to Clinton by 1.8% in NC
Trump’s best case has improved from a 100 EV win to a 112 EV win
Good for Clinton
The expected case moves from Clinton winning by 32 EV to Clinton winning by 108 EV
Clinton’s best case moves from a 178 EV win to a 210 EV win
Charts
Discussion
While we have some indicators moving in each direction, the two to pay attention to are the expected electoral college result and the tipping point. The two “best case” scenarios give all states with a margin under 5% to one candidate or another. Those are both highly unlikely scenarios less than three days out from polls closing.
Even those two indicators are mixed though. If you had to decide who is favored in this update, you would still pick Trump though. Even though his expected electoral total has gone down, the tipping point moves a bit in his favor, meaning that the amount he has to move polls in order to win has lessened.
So while he is losing by more, the amount of effort to change that has still decreased.
The one caveat there is that while the tipping point has improved since my last update, looking at the actual trend line it seems to be down from a recent peak.
If you put all these mixed messages together, it looks like the recent “Trump Surge” may have reached a high water mark… or at least a pause.
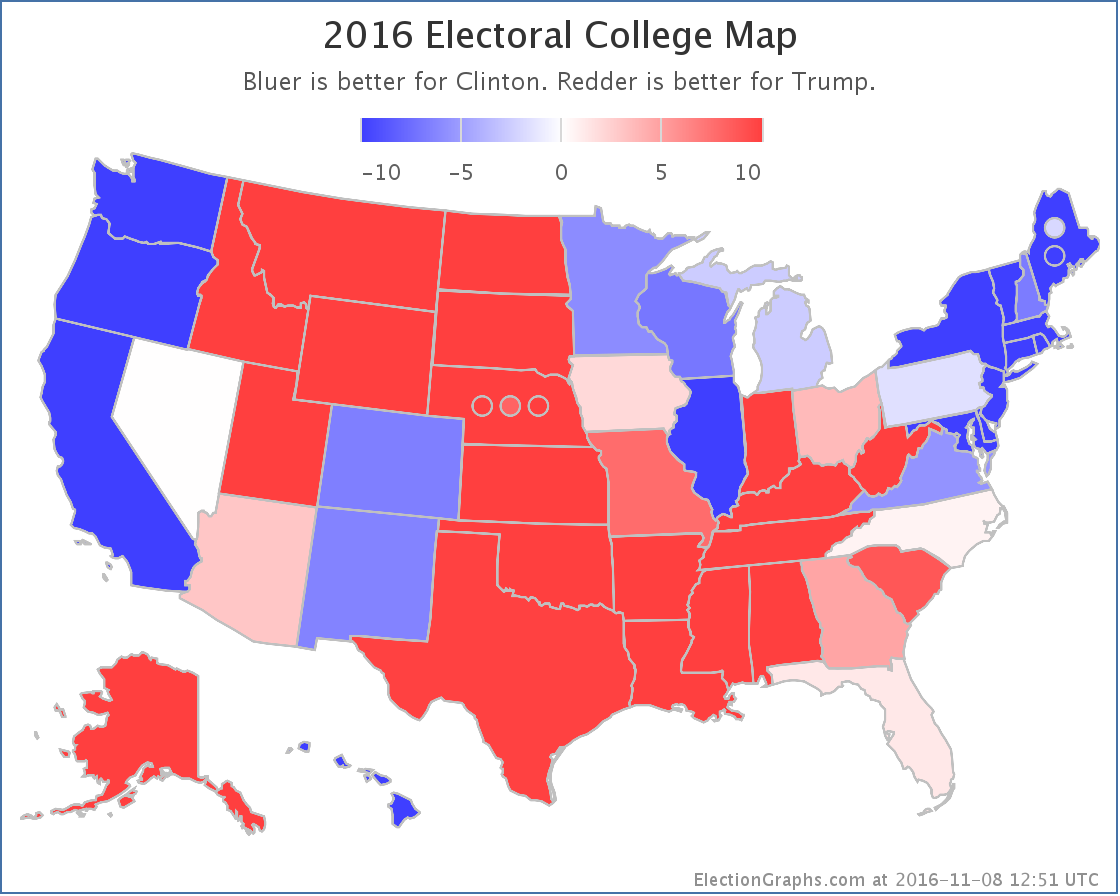
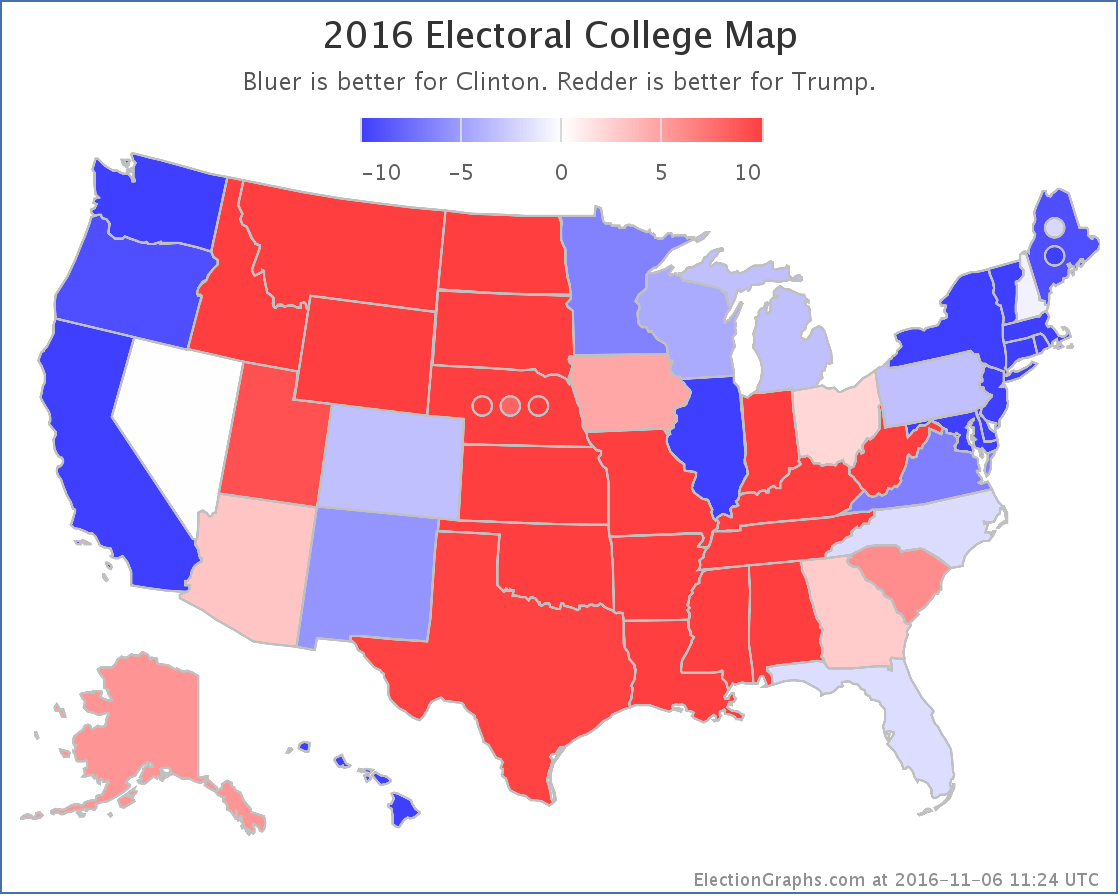
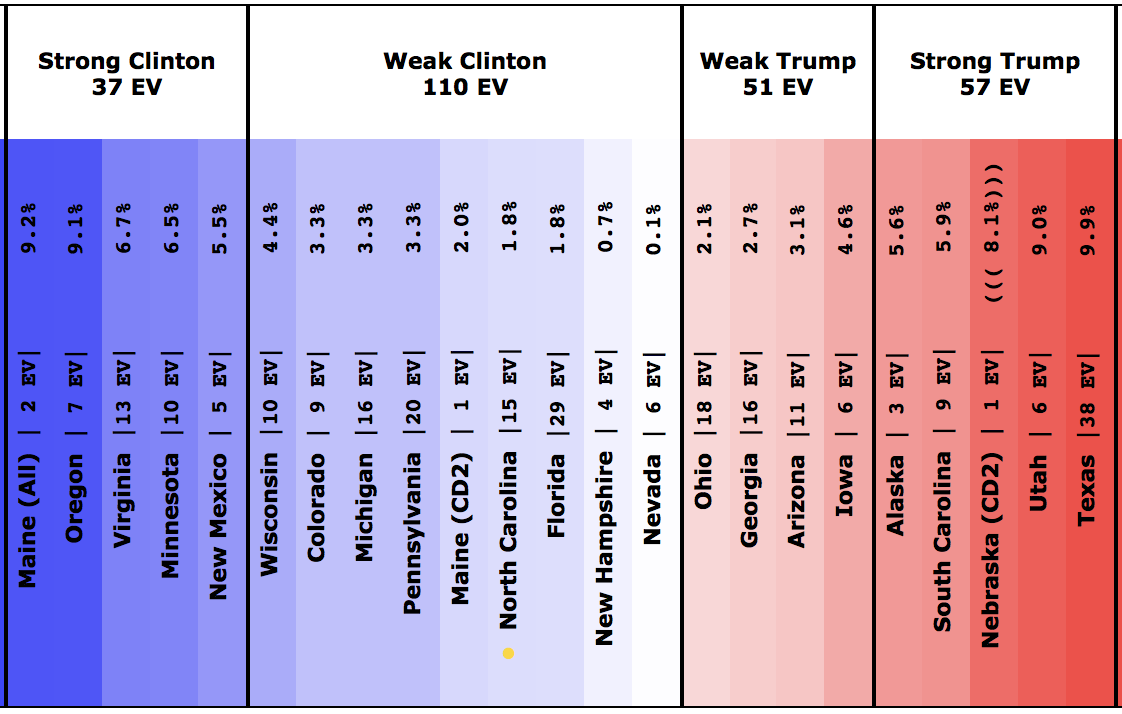
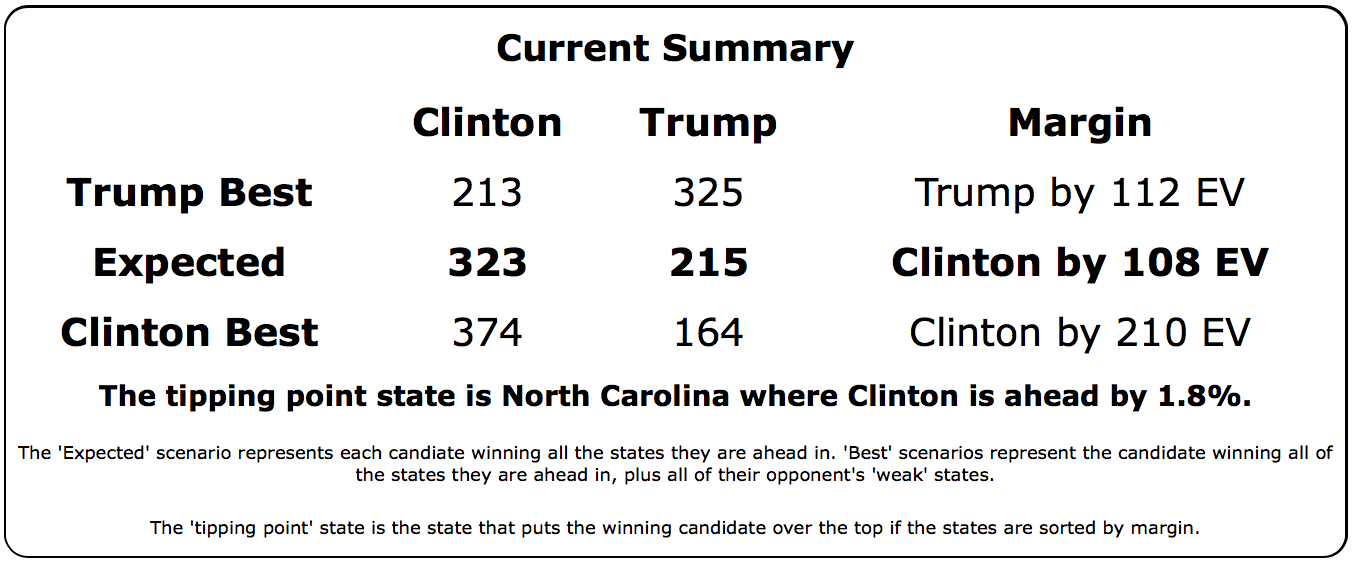
At these levels Clinton is of course still winning. The electoral result according to the current averages would be Clinton 323 to Trump 215, a 108 electoral vote win for Clinton. Trump does better than Romney did here, but still loses.
Trump still has ways to win though. The easiest way right now would be for him to pull in Nevada (0.1% Clinton lead), New Hampshire (0.7% Clinton lead), Florida (1.8% Clinton lead), and North Carolina (1.8% Clinton lead). That would get him to a 269-269 tie and throw the election into the House of Representatives, where he would probably win. To win outright, he would need to also pull in Maine’s 2nd congressional district, where Clinton is currently leading by 2.0% in the Election Graphs average.
Moving things by 2% doesn’t seem that big a move in the grand scheme of things, but given the history of the race in terms of what seem to be the candidate’s floors and ceilings, as well as reports of early voting trends in some of those states (specifically Nevada and Florida), moving those states that last little bit is harder than it may seem just looking at the percentages. If anything, the preliminary early voting data seems to indicate Clinton may end up over-performing the polling, not the other way around.
Just to check in with the sites that give odds (which we do not), the chances of a Trump win given all the current information:
The median of these 8 estimates is 12%. That seems reasonable and in line with what I would expect from the Election Graphs numbers and the small amount of time left before the election is over.
2.5 days until polls start to close. We are almost there.
State Details
The following are the detailed charts for all the states that influenced the national changes outlined above.
Moving from Trump to Clinton
Moving from Clinton to Trump
Now possible Trump pickups
Now possible Clinton pickups
No longer possible Trump pickups
Other states that helped move the tipping point
A note about faithless electors
In the past few days there have been reports of first one, then two, expected electors from Washington state saying that that have decided to or are considering being “faithless electors” by voting for someone other than who they are “supposed to” when the Electoral College votes in December.
Yes, they can do that. In Washington state there would be a $1000 fine if they did, but they can do it, and it would count.
There was also one other potential elector from Georgia who suggested they would be faithless back in August. That potential elector came under extreme pressure and resigned, to be replaced by someone who would presumably vote the “right” way.
That might well happen to these two as well. But faithless electors can and do happen every few election cycles. In the last 50 years there were faithless electors in 2004, 2000, 1988, 1976, 1972, and 1968. That is 6 out of 12 elections during that period. Half. It would not be surprising if there were one or more faithless electors in 2016, especially given the contentious nature of the race. They have never made a difference in the final outcome.
The Election Graphs estimates show what the results “should be” given who wins various states. They do not take into account statements by individual electors on their intentions. If a scenario arises where it is close enough for electors who have made statements like this to potentially make a difference in the outcome or throw the race to the House, we will of course make note of that. And once electors vote in December, we will show the final tallies, including any votes cast by faithless electors.
A note about McMullin
Right now the Real Clear Politics average in Utah has McMullin 12.4% behind the lead. The 538 average in Utah has him 10.3% behind the lead. Although McMullin was a lot closer than anyone expected, he never got closer than 5% to the lead in Utah in these averages and now appears to be fading. 538 still has him in second place, but it doesn’t seem likely at this point that he will win electoral votes.
If that changes, I will of course note it in these updates and on the Election Graphs site.
For more information…
This post is an update based on the data on ElectionGraphs.com. Election Graphs tracks a state poll based estimate of the Electoral College. All of the charts and graphs seen in this post are from that site. Additional graphs, charts and raw data can be found there. Follow @ElectionGraphs on Twitter or like Election Graphs on Facebook to see announcements of updates or to join the conversation. For those interested in individual general election poll updates, follow @ElecCollPolls on Twitter for all the polls as they are added. If you find the information in these posts interesting or useful, please consider visiting the tip jar.
Edit 13:56 UTC to add an additional paragraph break.
It has been about five days since the last update. Since then the movement has been decidedly mixed.
Note that as of this update, no polls have been included that contain interviews done after the release of the “Comey Letter”.
Good for Trump:
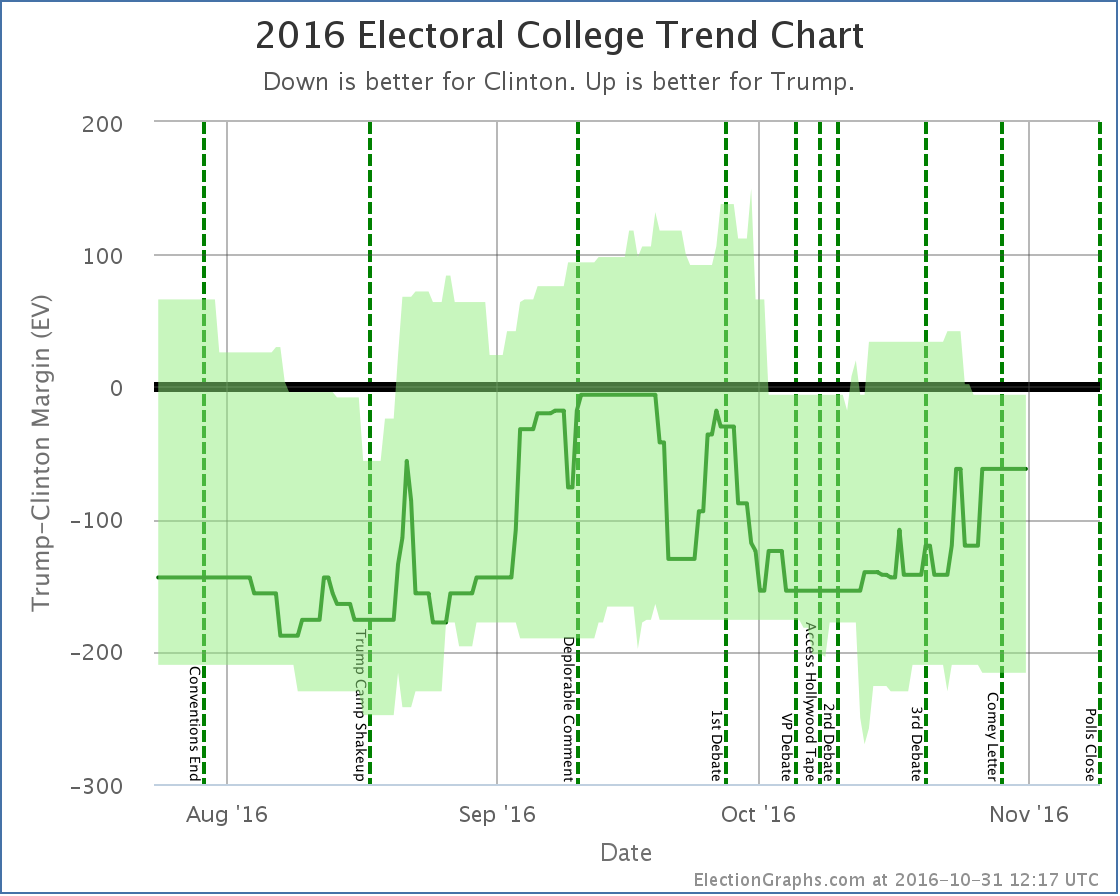
The expected result has moved from a 130 EV Clinton win to only a 62 EV Clinton win
Clinton’s best case has declined from a 234 EV win to only a 216 EV win
Good for Clinton:
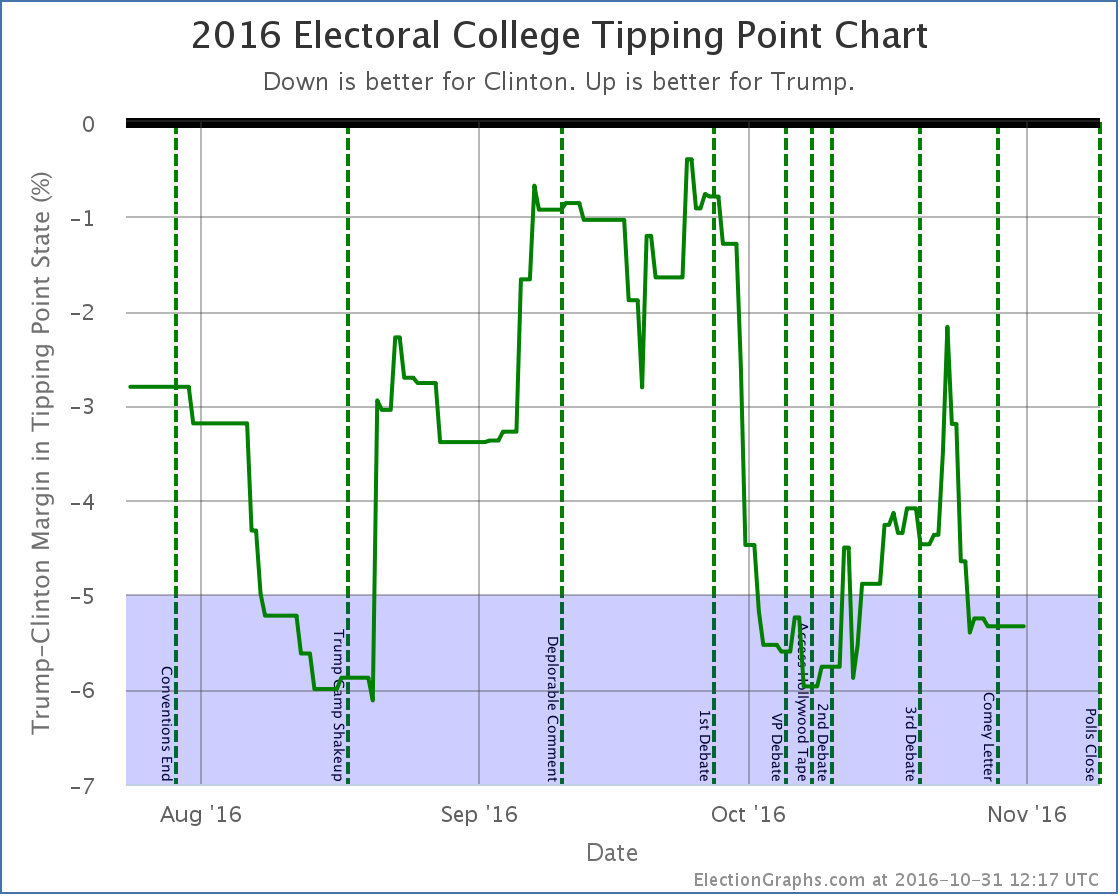
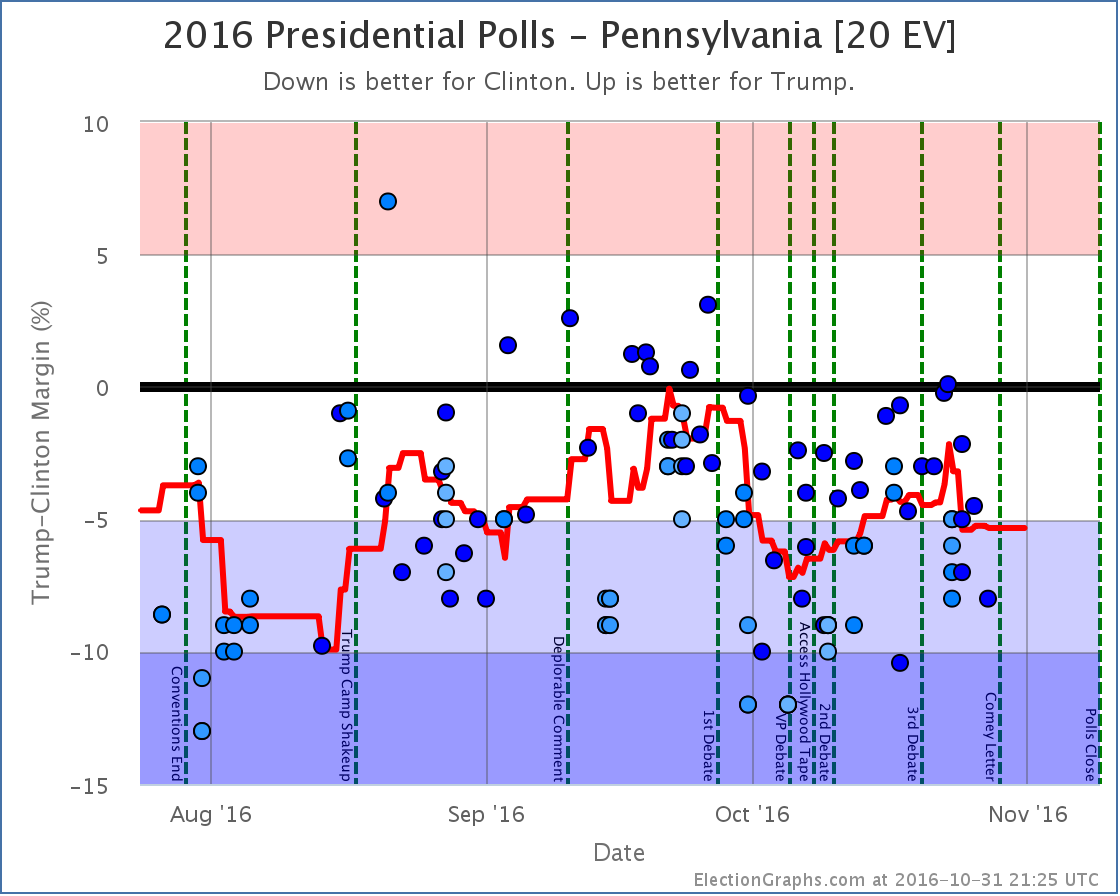
The tipping point moves from Clinton by 4.1% in PA to Clinton by 5.3% in PA
Trump’s best case declines from a 34 EV win to a 6 EV loss
Charts
Discussion
While some metrics have moved in Trump’s direction and others in Clinton’s, in the end this picture is bad news for Trump. Why is that? Fundamentally, doesn’t the fact that the “expected case” moved toward Trump mean that he is doing better?
Well, it means the margin he will lose by is getting smaller, yes. However, if you are trying to look for scenarios where Trump would actually catch up and win, the tipping point is what you want to be looking at. To win he has to move the tipping point state (or states he is even further behind in) over to his side of the line. And the tipping point is moving further away at the moment.
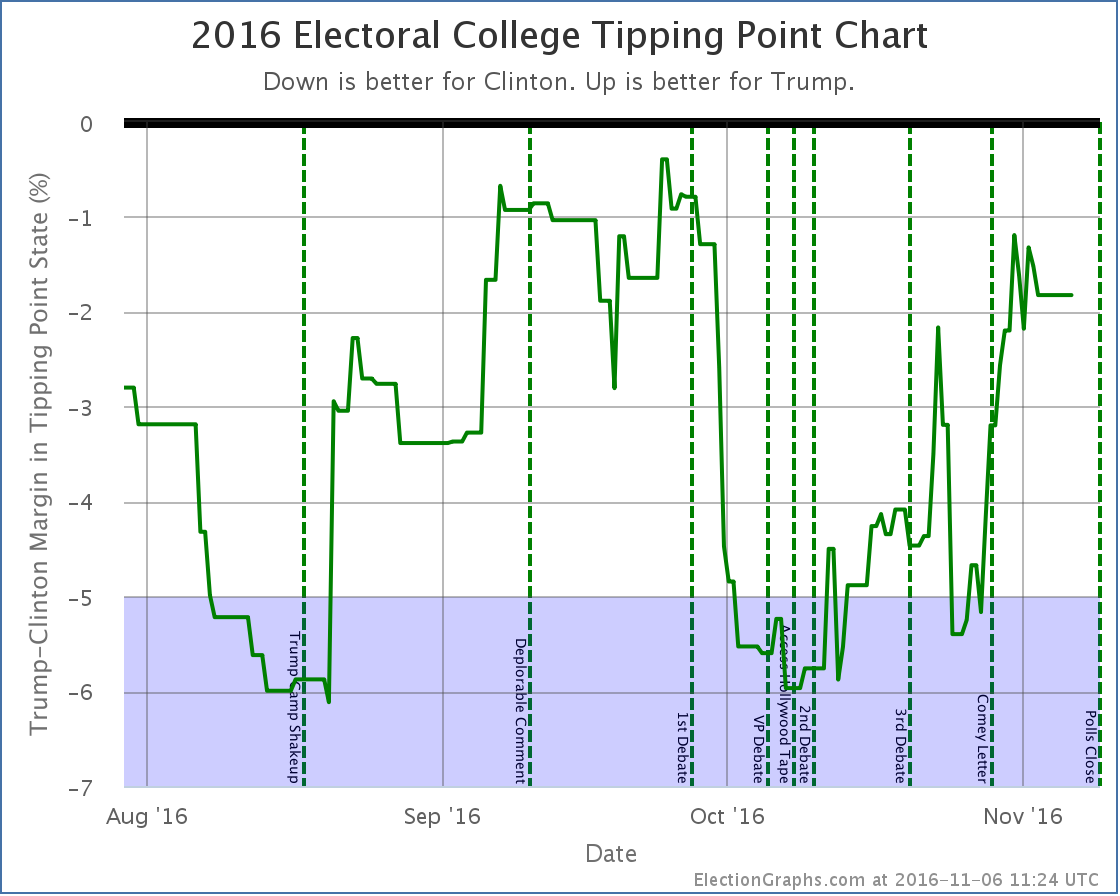
If you look at the tipping point chart you can see that Trump had indeed been making progress on the tipping point starting about when the Access Hollywood tape dropped. But that started to reverse around the 23rd. At the same time that his expected electoral college result was still improving.
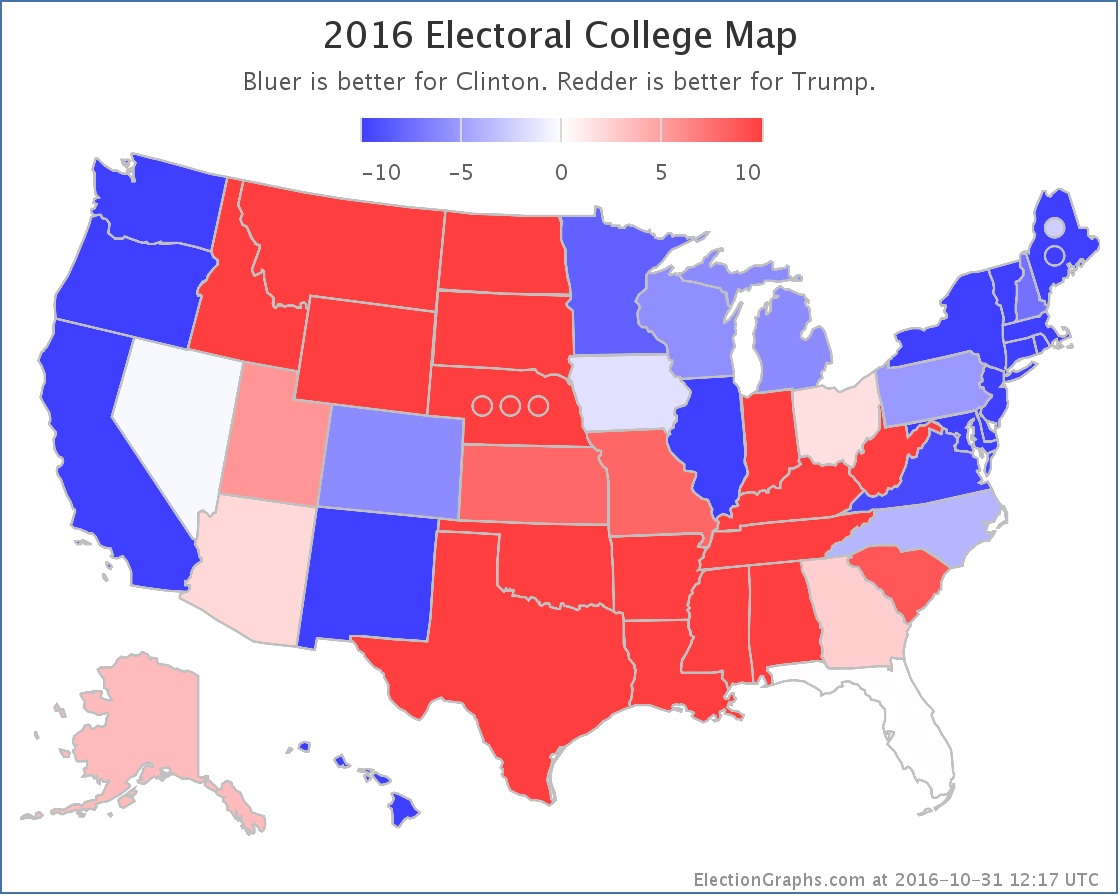
This is still confusing. What is happening? Well, all the states aren’t moving in lock step in reaction to events. A number of close states have moved toward Trump, like Florida for instance. But key states like Pennsylvania have been moving away from him. Because of this divergence, we can have Trump improving his electoral college “score” while simultaneously the path to 270 electoral votes gets harder.
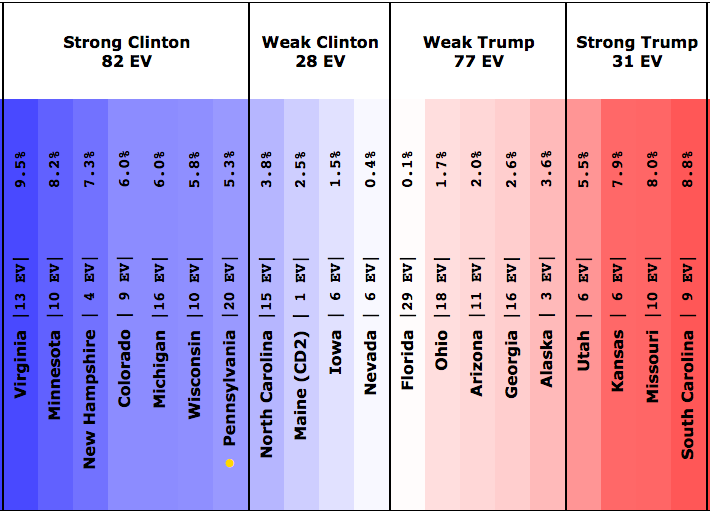
And in fact, at the moment, 270 looks out of reach for Trump. Look at the spectrum of the close states above. Right now Trump could win every state he is ahead in, then also pull over the states where he is close… Nevada (0.4% Clinton lead), Iowa (1.5% Clinton lead), Maine CD2 (2.5% Clinton lead), and North Carolina (3.8% Clinton lead)… and Trump would still lose by 6 electoral votes.
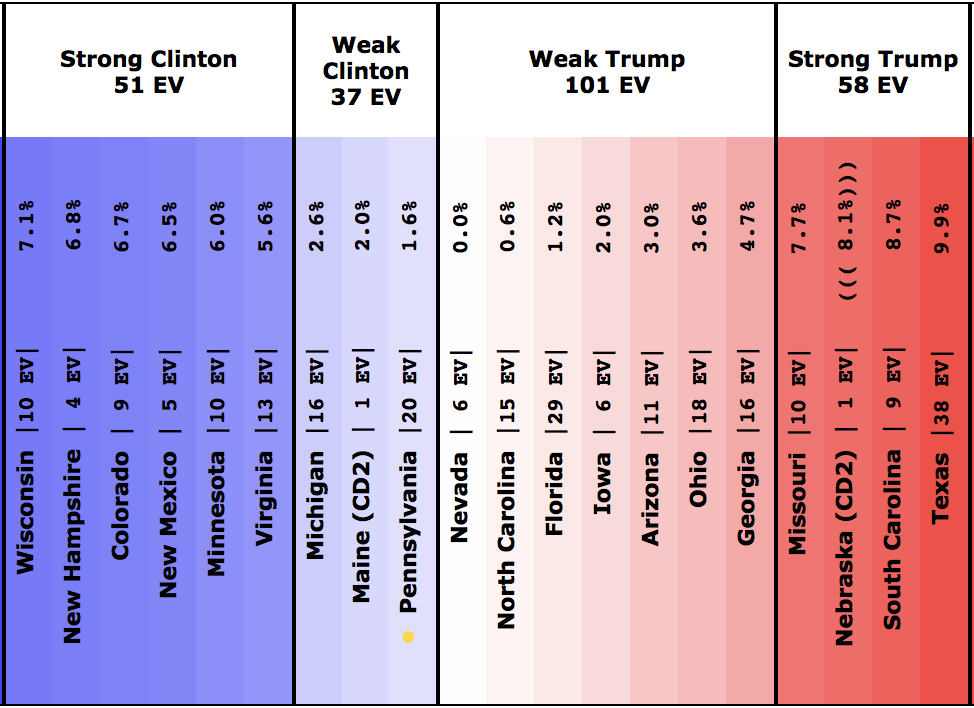
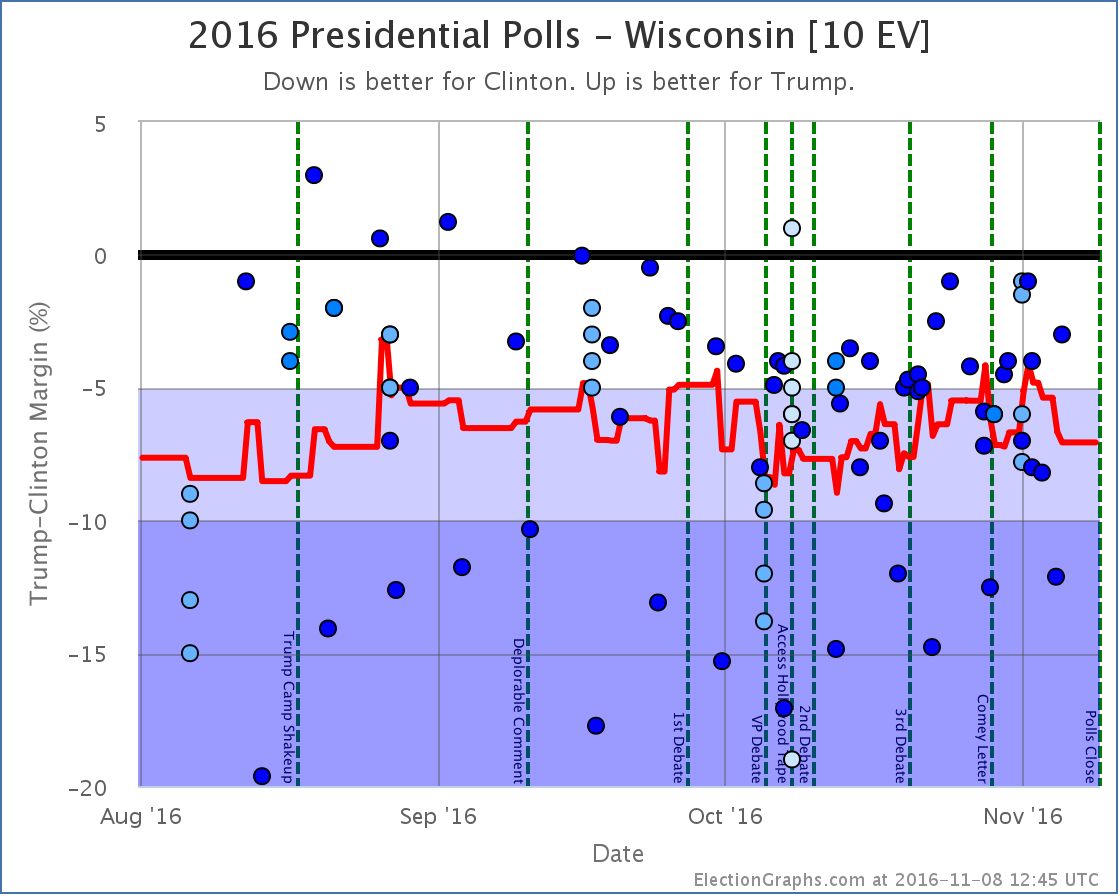
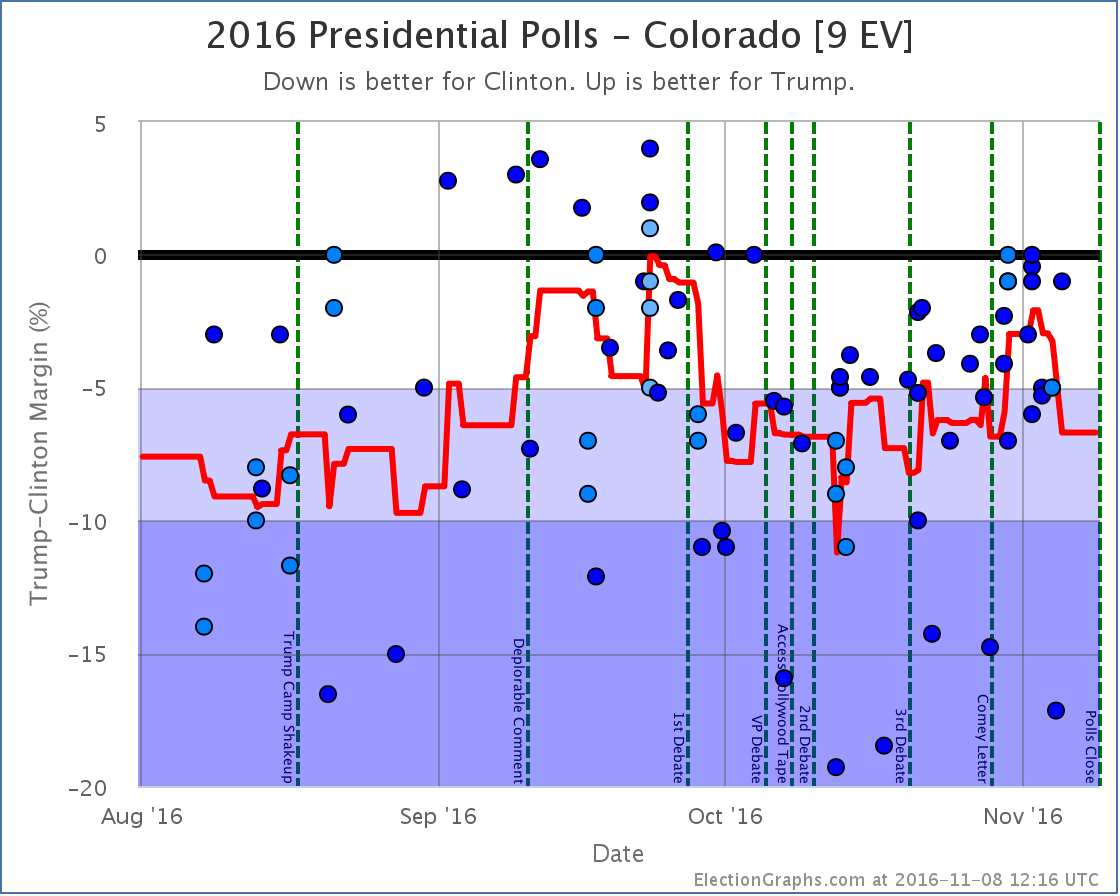
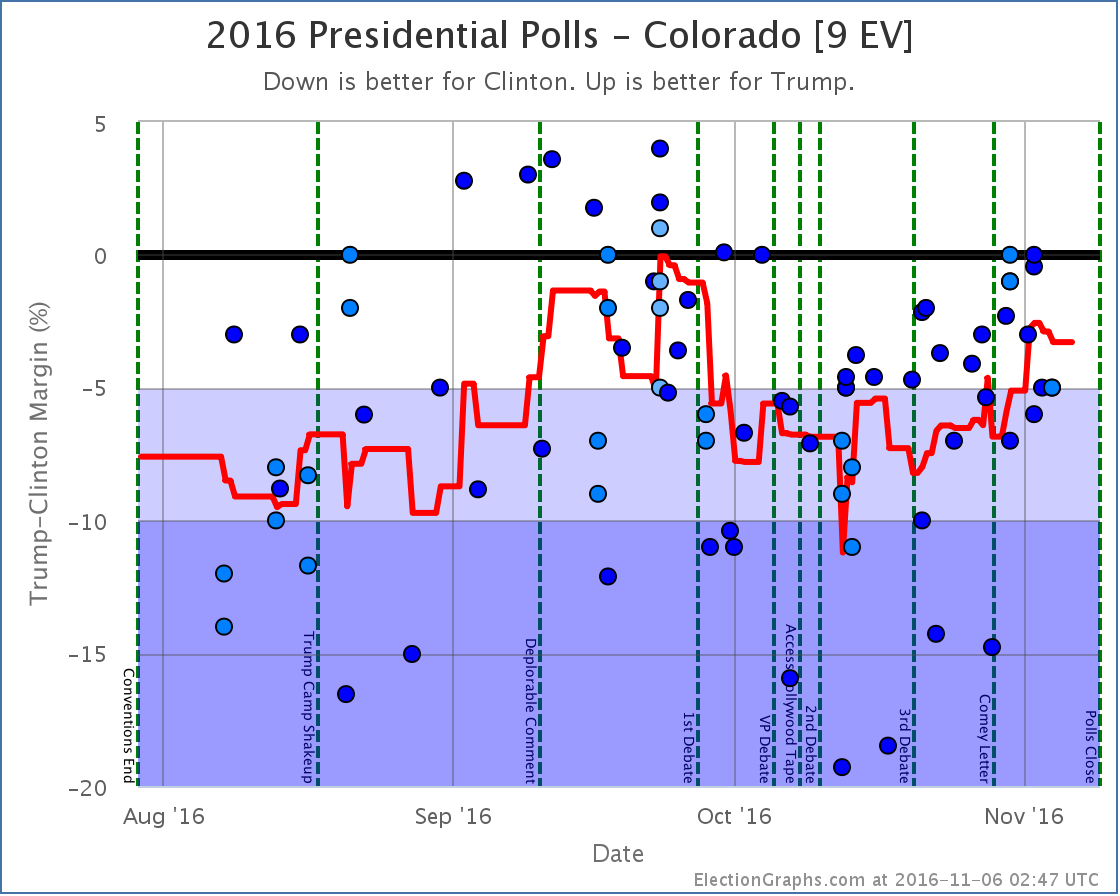
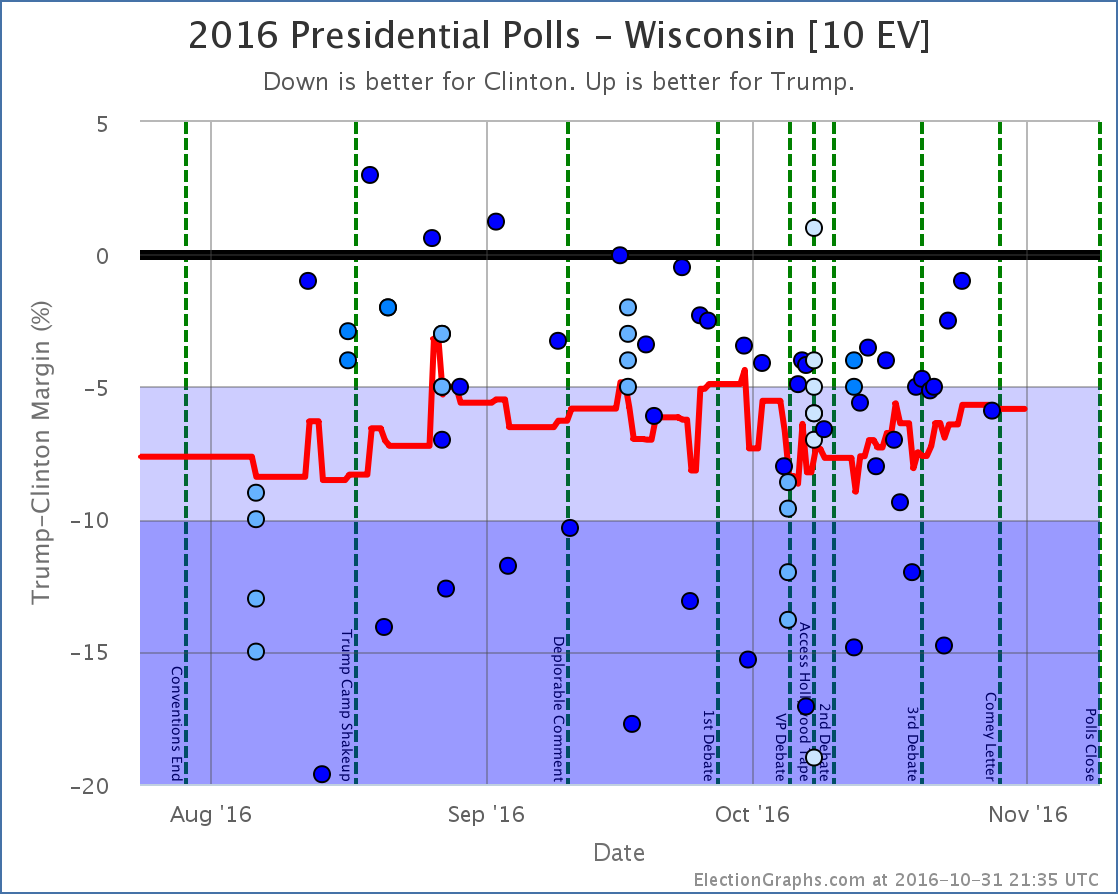
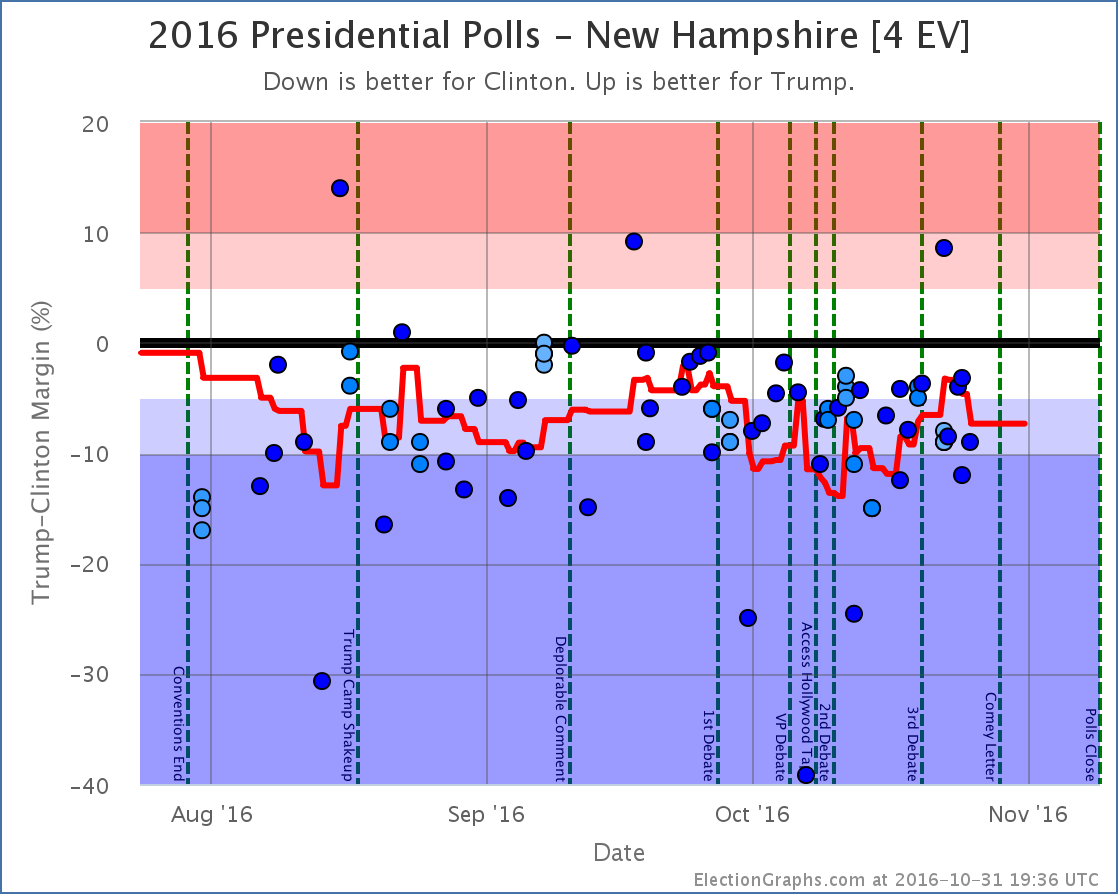
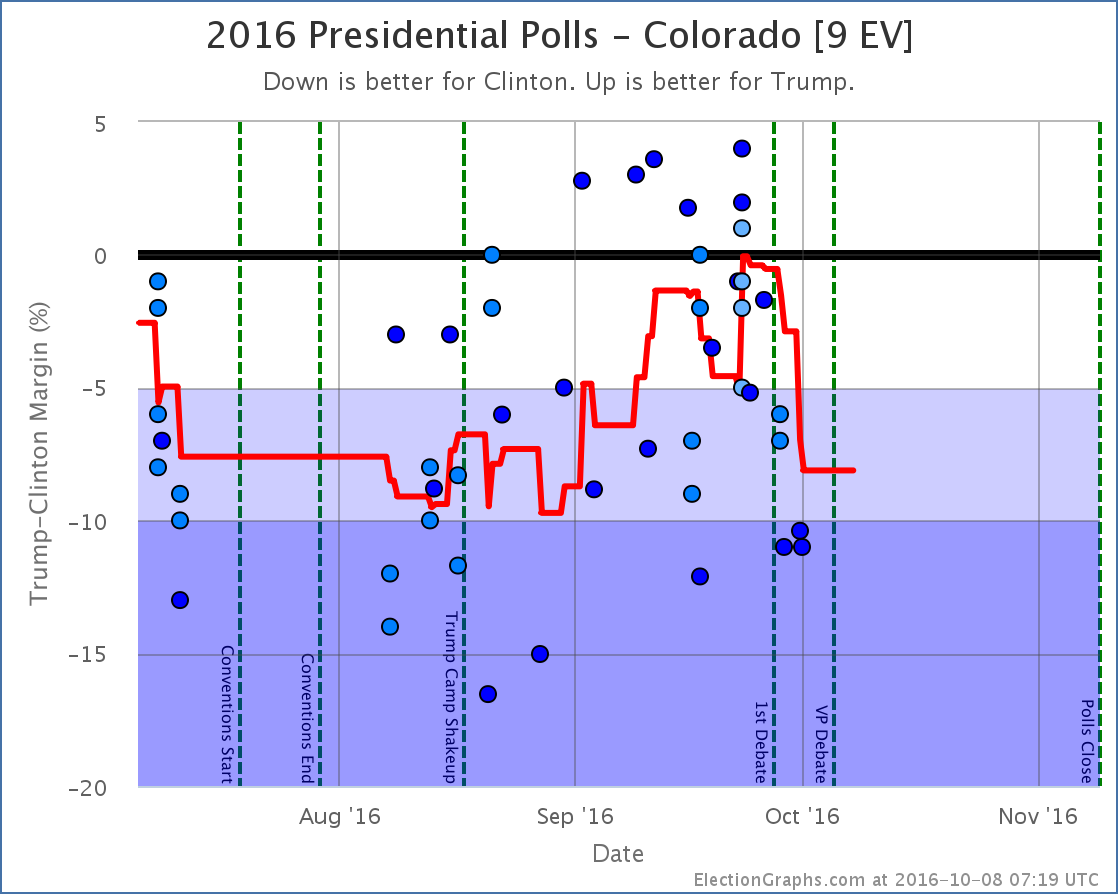
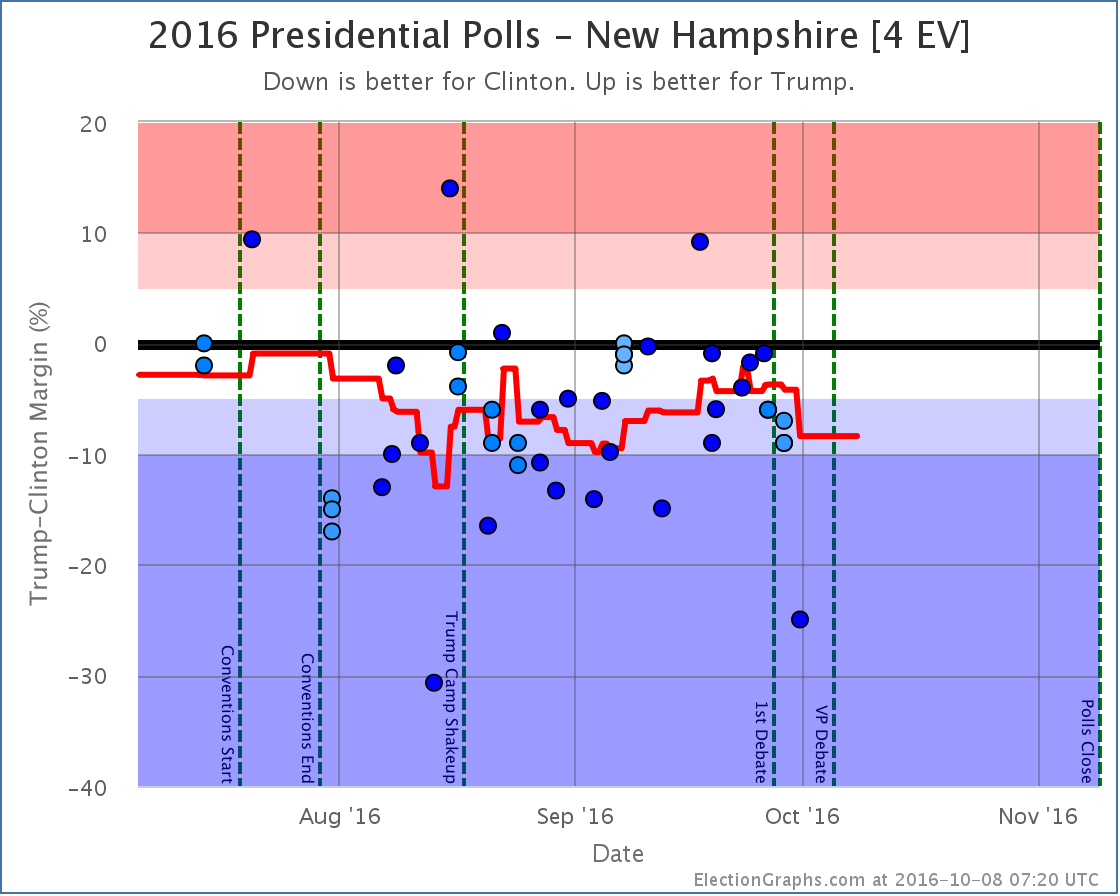
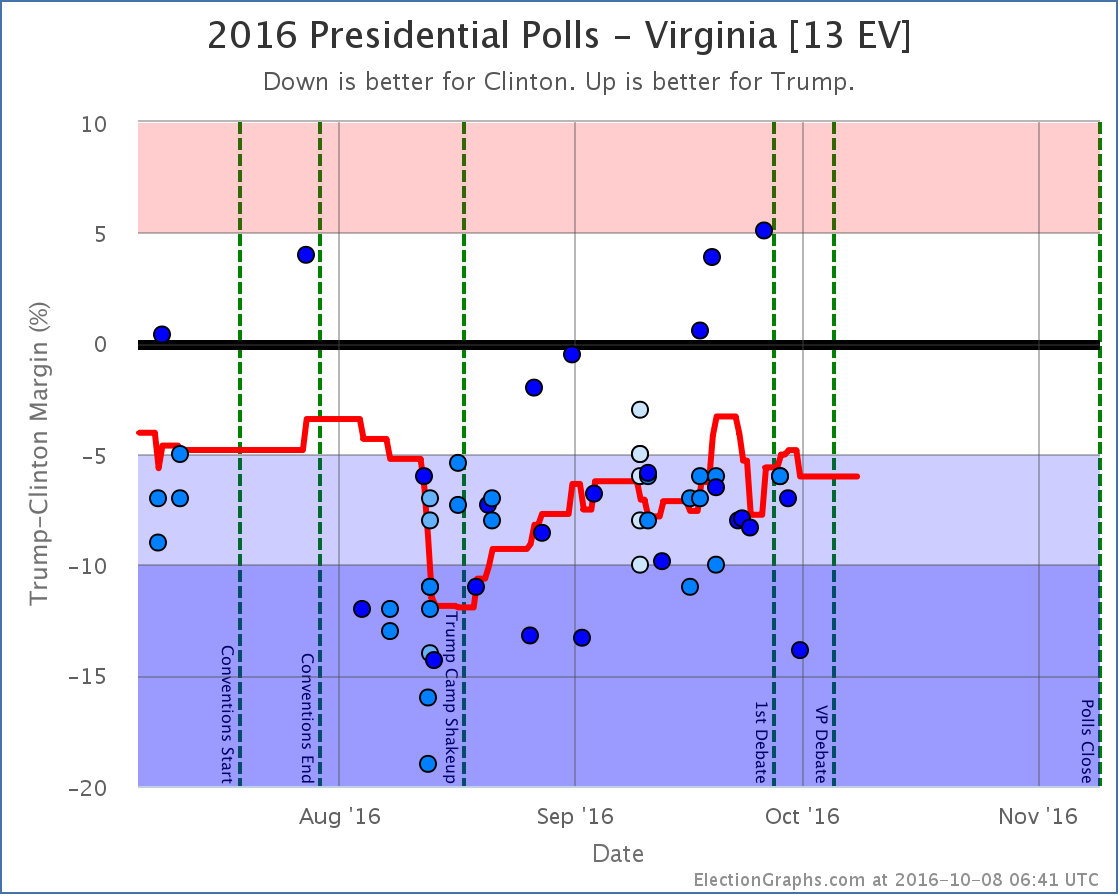
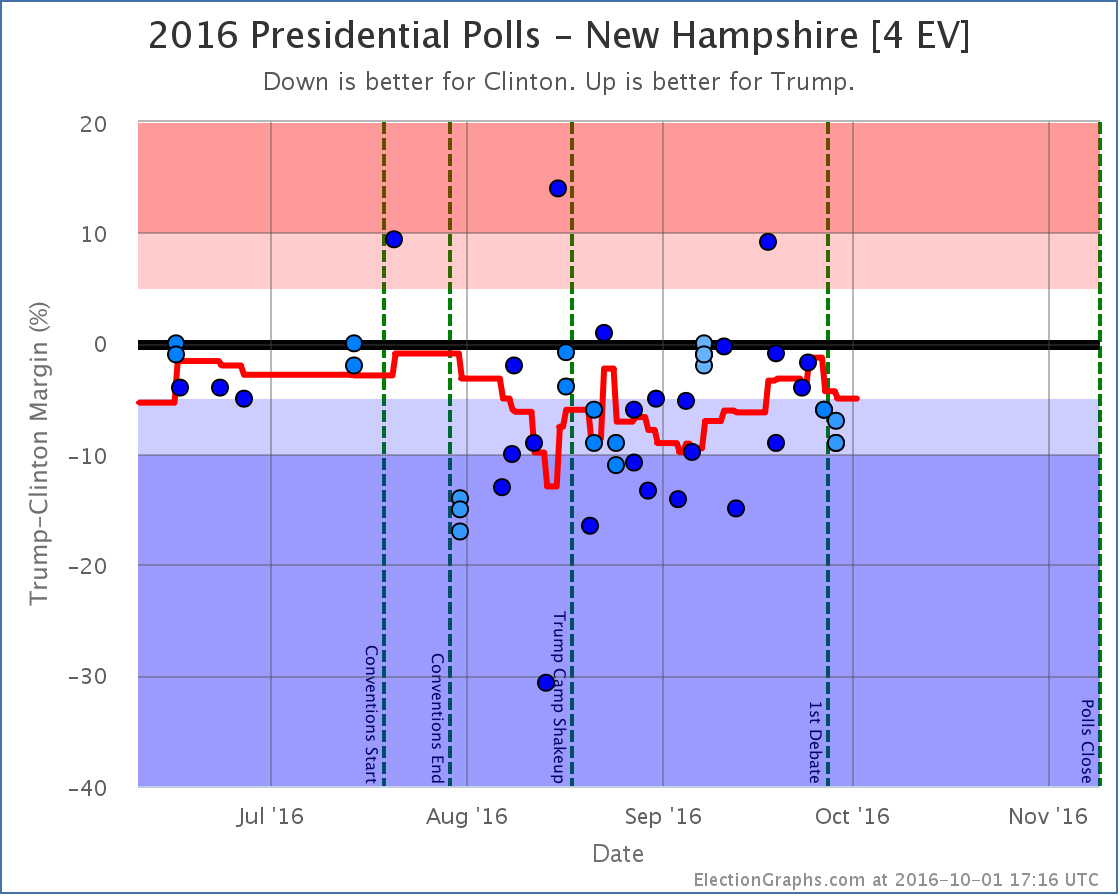
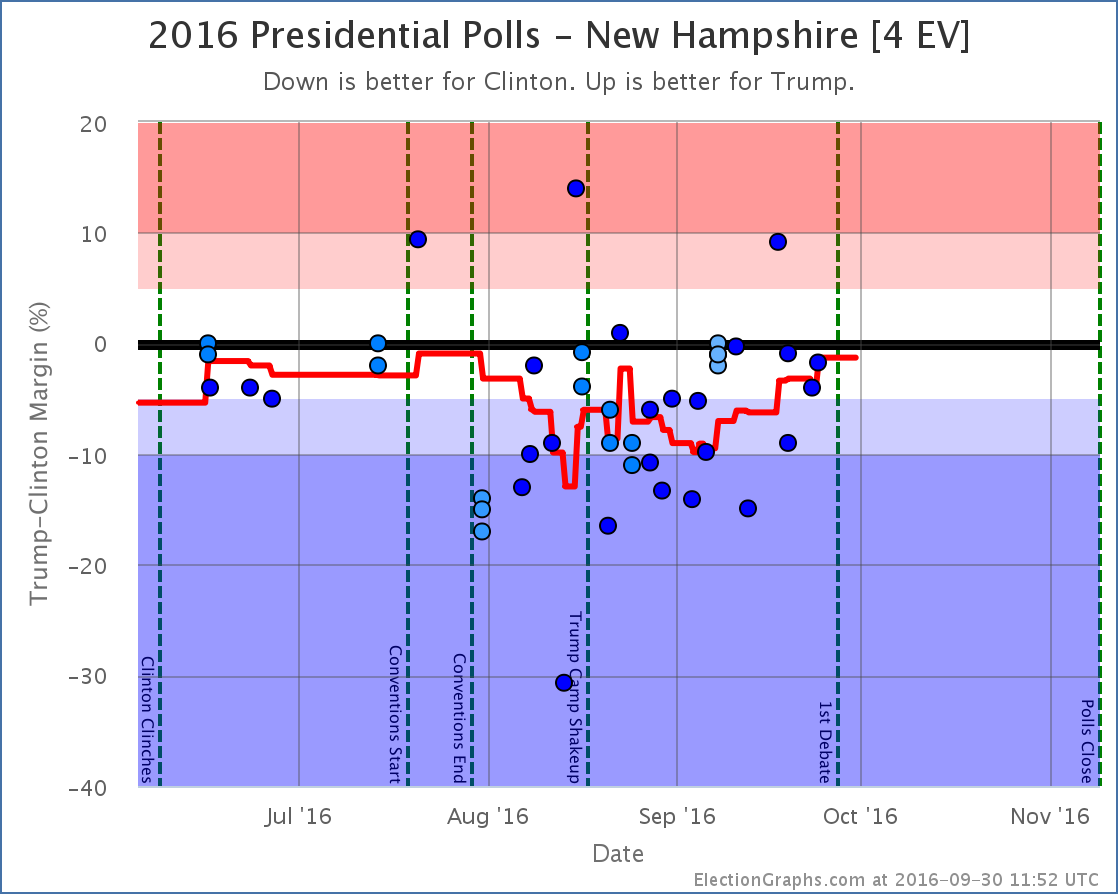
To win, Trump has to win all of the close states, plus Pennsylvania, where Clinton has a 5.3% lead at the moment… or one of the other larger “Strong Clinton” states… Wisconsin, Michigan, Colorado, Minnesota, or Virginia… all of which Clinton currently leads by even bigger margins. (New Hampshire isn’t enough to push Trump over the edge with only 4 EV.)
This is a really big pull with so little time left. The Trump side seems to be hanging their hopes on the fallout from the Comey Letter. This may cause some movement, but early indications are that almost all voters made up their minds on the Clinton email issue and if it mattered to them long long ago, and this is unlikely to change many minds.
We’ll start to see if there is any movement due to the letter within a few days. But there just are not that many days left. Sites that give odds for Trump winning range from less than 0.01% on the low side to 24.4% on the high side. The median odds seem to be around 5%. That isn’t impossible. But those odds are low enough that a Trump win would be a very big surprise.
There is another goal that Trump has a much better shot at though. If the election ends up exactly how things look today, Trump will lose by only 62 electoral votes. That would mean that Trump would do better than both McCain (lost by 192 EV) and Romney (lost by 126 EV). It may not be an actual win, but Trump improving on the performance of both previous Republican candidates may give the message to Republicans that a Trump like candidate in 2020 might be the way to go rather than returning to Romney or McCain style Republicanism.
We shall see.
8.1 days left until we start getting actual election results.
We are almost there.
State Details
The following are the detailed charts for all the states that influenced the national changes outlined above.
Moving from Clinton to Trump
Moving from Trump to Clinton
Now a possible Clinton pickup
Now out of Trump’s reach
Now out of Clinton’s reach
Also influencing the tipping point
A note about McMullin
Election Graphs is designed around showing the Republican – Democrat margin, and there is not enough time before the election to revamp the site to properly account for 3rd parties that are strong enough to have a shot at winning electoral votes.
Right now the Real Clear Politics average in Utah has McMullin 6.0% behind the lead. The 538 average in Utah has him 7.3% behind the lead. If/when McMullin is within 5% according to either of these averages, I will add notes to both the Utah and National pages about the possibility of McMullin winning Utah’s 6 electoral votes.
For more information…
This post is an update based on the data on ElectionGraphs.com. Election Graphs tracks a state poll based estimate of the Electoral College. All of the charts and graphs seen in this post are from that site. Additional graphs, charts and raw data can be found there. Follow @ElectionGraphs on Twitter or like Election Graphs on Facebook to see announcements of updates or to join the conversation. For those interested in individual general election poll updates, follow @ElecCollPolls on Twitter for all the polls as they are added. If you find the information in these posts interesting or useful, please consider visiting the tip jar.
States with new poll data added since the last update: All of them. Multiple times. There are additional new polls since I had to cut things off for this update as well. Those will be in the next update.
National Summary
The last week of polls has been devastating to Trump’s position. In the last update we were just starting to see the reaction from the first debate. With this batch the post-debate polling continued to roll in, and while there were a couple of minor moves toward Trump, the net change in this update was a dramatic move toward Clinton:
The expected result moved from Clinton by 6 electoral votes to Clinton by 154 electoral votes
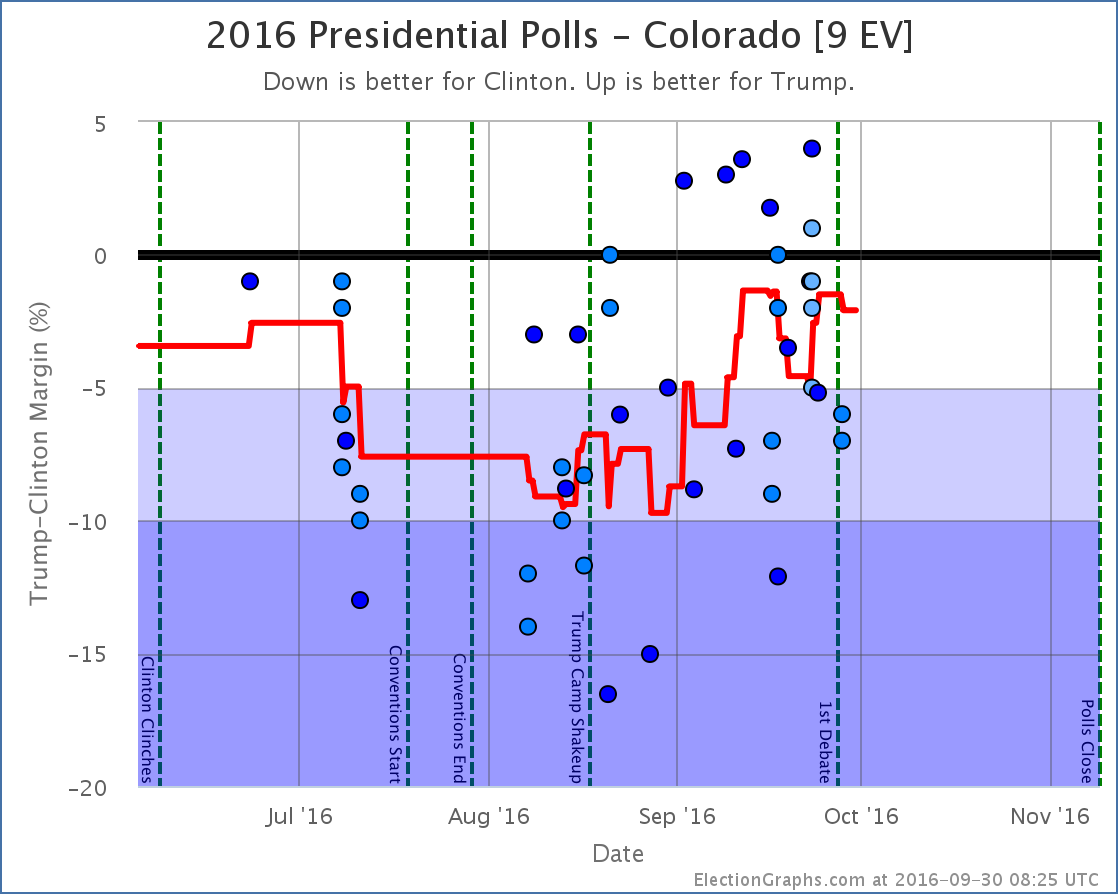
The tipping point moved from Clinton by 2.1% in CO to Clinton by 4.5% in MI
Trump’s best case moved from a 60 EV win to a 26 EV win
Clinton’s best case moved from a 208 EV win to a 196 EV win
Looking at the charts:
The previous update mentioned some Trump losses starting a week or two before the debate. With a lot more polls filling in the time period right before the debate as well as right after, it now looks like those losses were reversed before the debate.
In the time after the debate though, all three indicators on the chart have moved in Clinton’s direction. The race is now essentially back to where it was at the beginning of September. We’re not yet back at Clinton’s high point from August, but it is getting close.
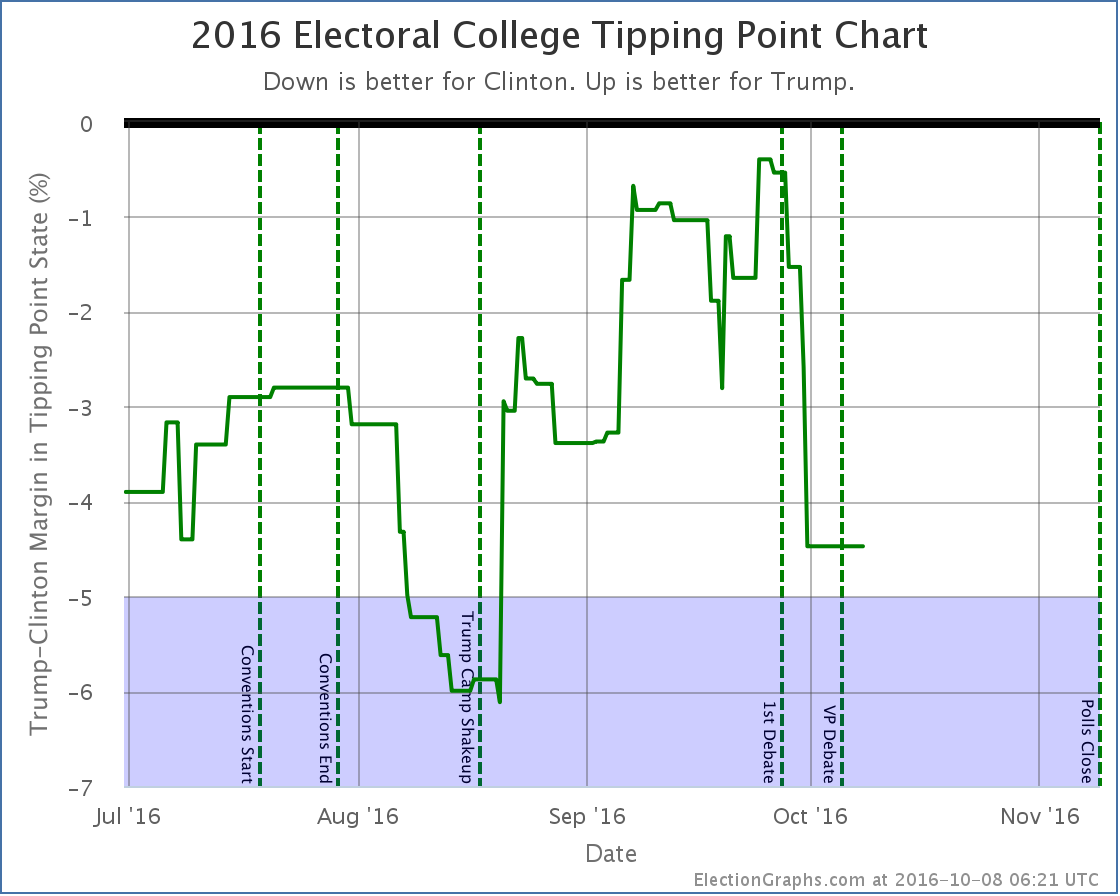
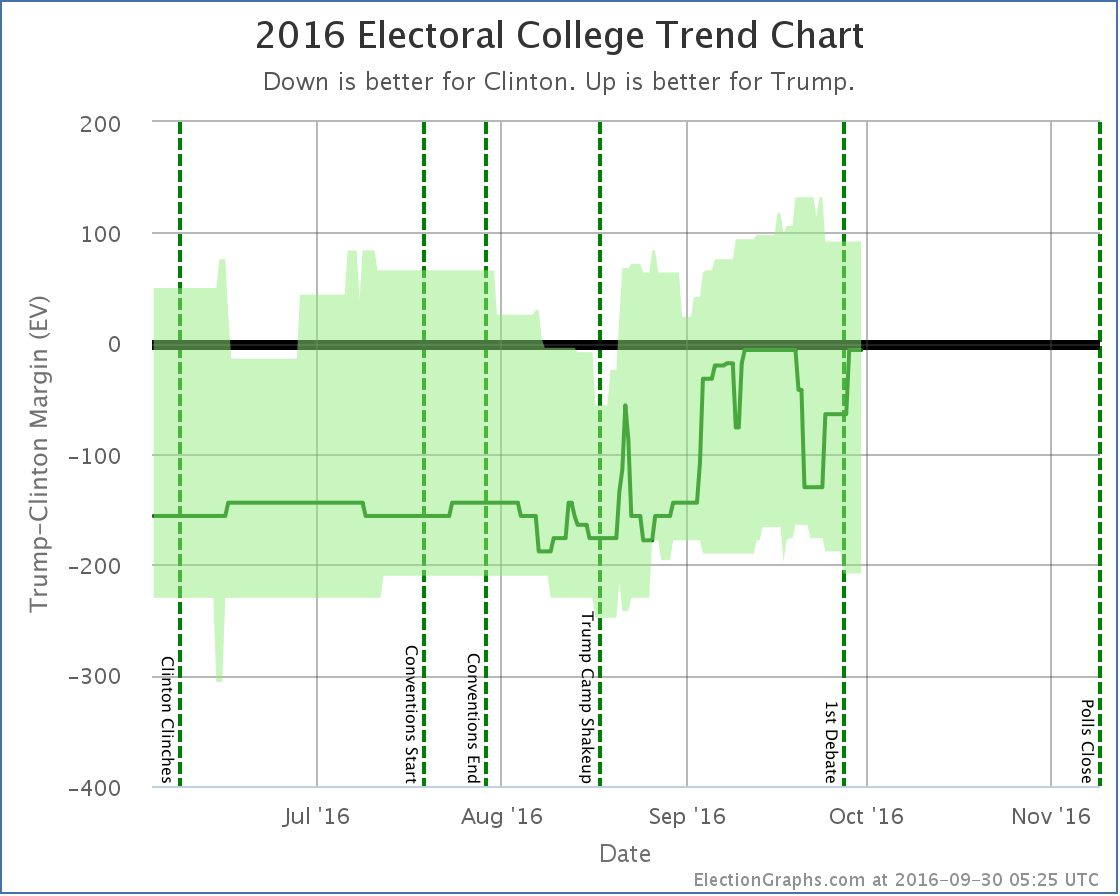
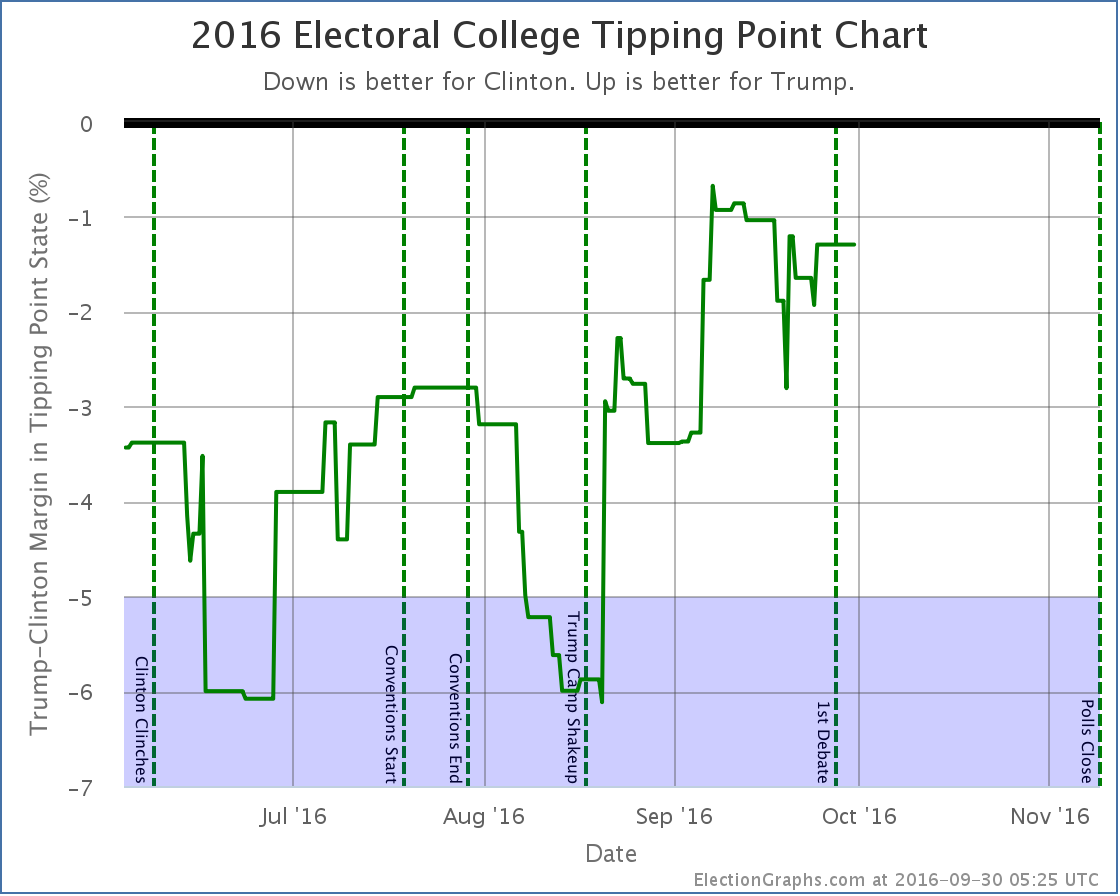
The tipping point chart is even more stark. As with the electoral college view, it looks like Trump’s mid-September declines were reversed by debate time, but after the debate everything falls off a cliff. Most of Trump’s gains from August and September are gone. Right before the debate he topped out with Clinton only ahead in the tipping point metric by 0.4%.
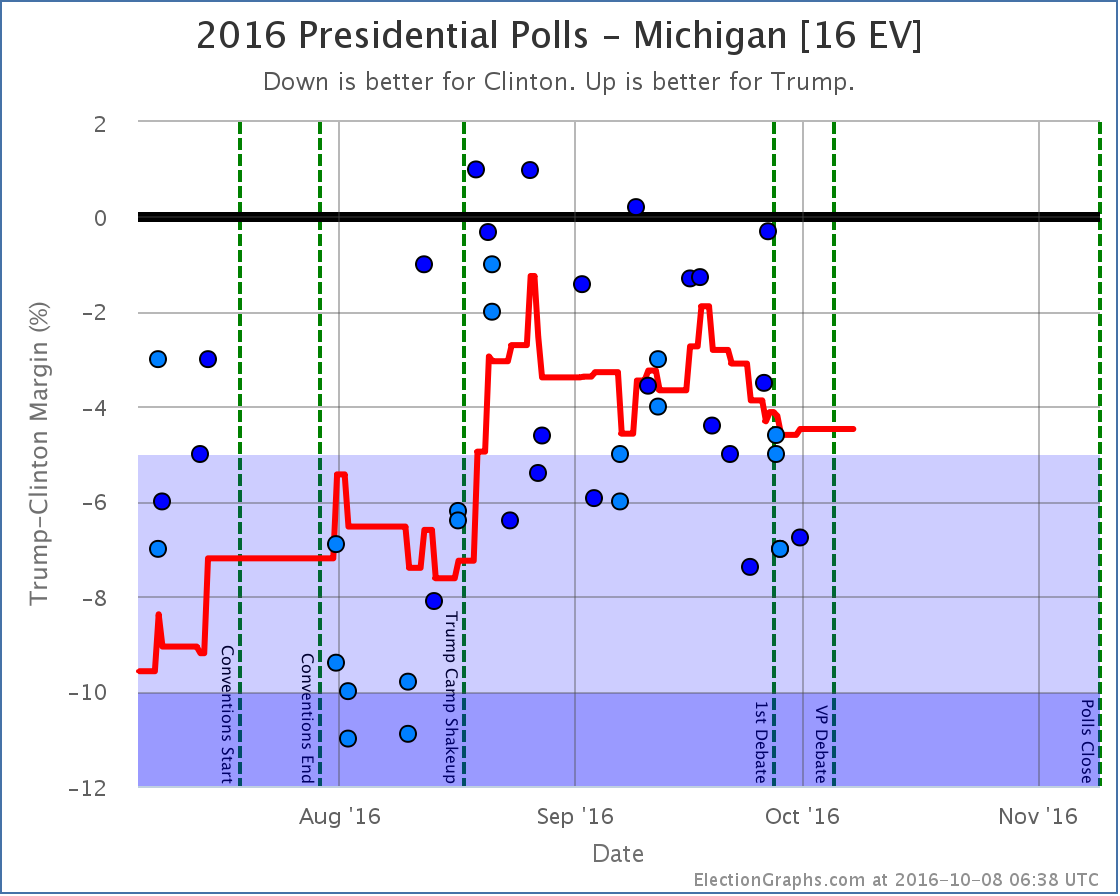
Clinton now leads by 4.5%. The tipping point state is Michigan. Clinton only has to increase her lead slightly there to not just take Michigan out of reach for Trump, but the Presidency.
What we are seeing in the polling results right now at this point probably fully factors in the debate itself. But we are just starting to see the impact from Trump’s “worst week in presidential campaign history ” that started with the debate, continued with his attacks on Alicia Machado, and ended with the leak of some of his tax information. The events of that week are not yet fully baked in.
And of course, the polls do not yet reflect the VP debate, or more importantly, the 2005 Trump video that was leaked on Friday. It is hard to imagine the events of the last few days NOT having an impact on the polls.
And the next debate is coming up. It should be interesting. If you were not planning on tuning in before, change your plans.
31.7 days left until the first actual election results start coming in.
State Details
A lot of states moved in order to produce the summary results above. For those interested in looking at the state by state details, they are below:
Weak Trump to Weak Clinton
Moving out of reach for Trump
Moving out of reach for Clinton
Moving into reach for Trump
States that changed categories but then moved right back again
For more information…
This post is an update based on the data on ElectionGraphs.com. Election Graphs tracks both a poll based estimate of the Electoral College and a numbers based look at the Delegate Races. All of the charts and graphs seen in this post are from that site. Additional graphs, charts and raw data can be found there. Follow @ElectionGraphs on Twitter or like Election Graphs on Facebook to see announcements of updates or to join the conversation. For those interested in individual general election poll updates, follow @ElecCollPolls on Twitter for all the polls as they are added. If you find the information in these posts interesting or useful, please consider visiting the tip jar.
States with new poll data added since the last update: New Jersey, Florida, Nevada, Michigan, New Hampshire, California, Massachusetts.
National Summary
The newest batch of polls… mostly post-debate polls… results in movement toward Clinton and away from Trump, which matches the consensus expectations after the debate this week:
Trump’s best case declines from Trump by 92 EV to Trump by 60 EV
The tipping point moves from Clinton by 1.3% in NH to Clinton by 2.1% in CO
Looking at the charts:
Although polls may still come in that change the shape of the last couple weeks, right now a clear pattern is emerging where both “best cases” have been moving in Clinton’s direction since about September 20th. More states are coming into Clinton’s potential reach, while other states are moving out of Trump’s reach.
Interestingly, the “expected” case, although it has fluctuated as big states move back and forth across the center line, is back at the same place it was in mid-September… Clinton leading by an extremely narrow 6 electoral votes.
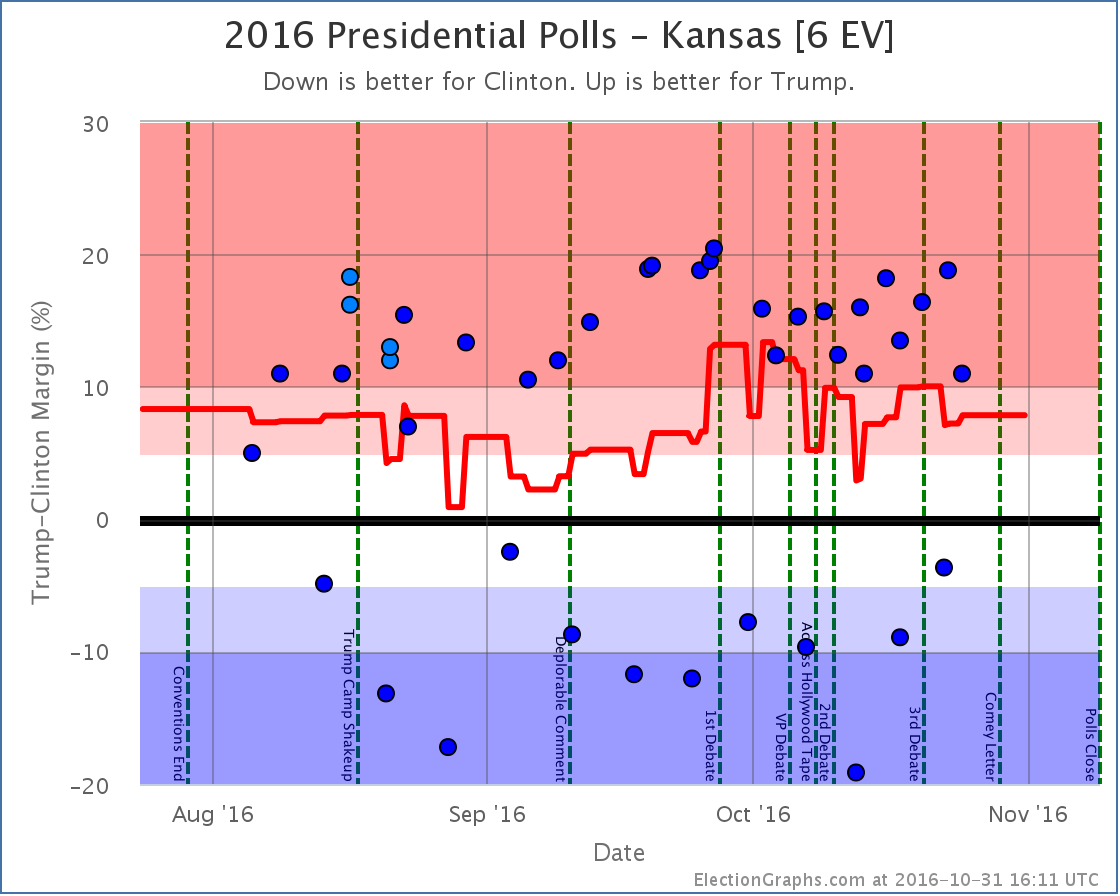
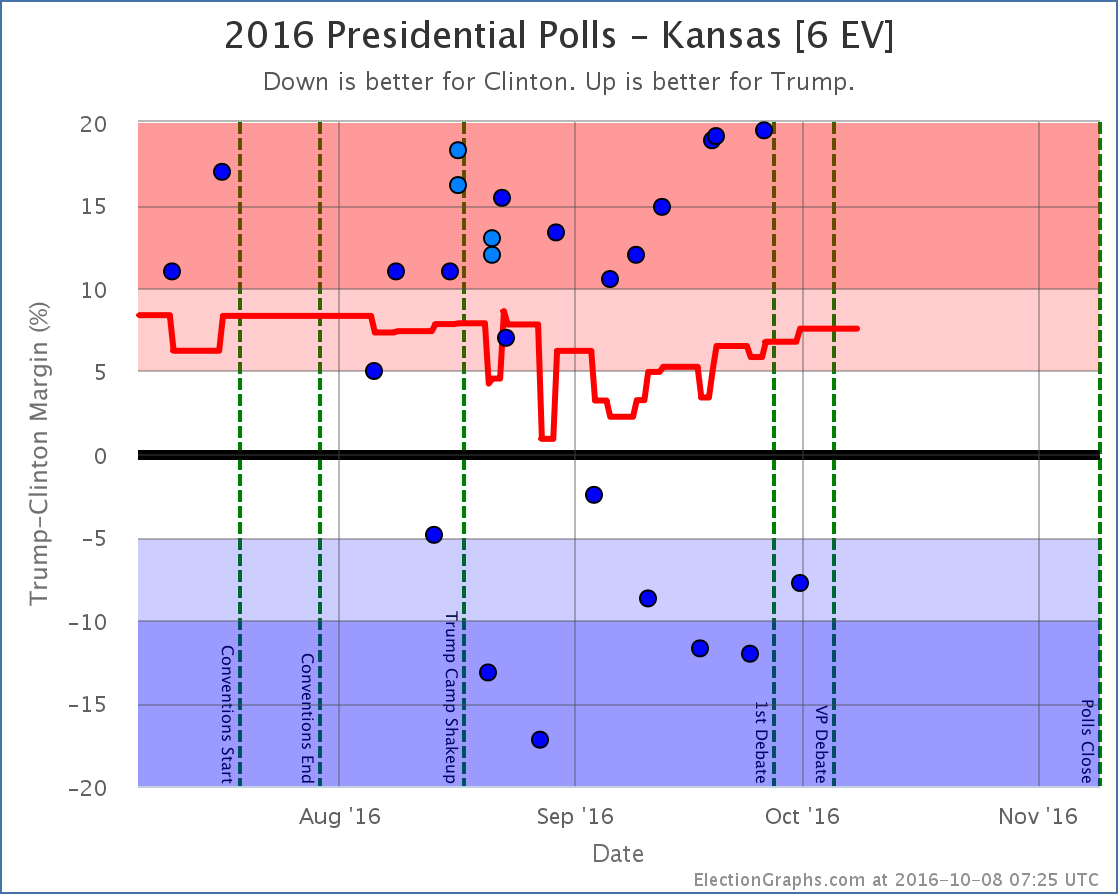
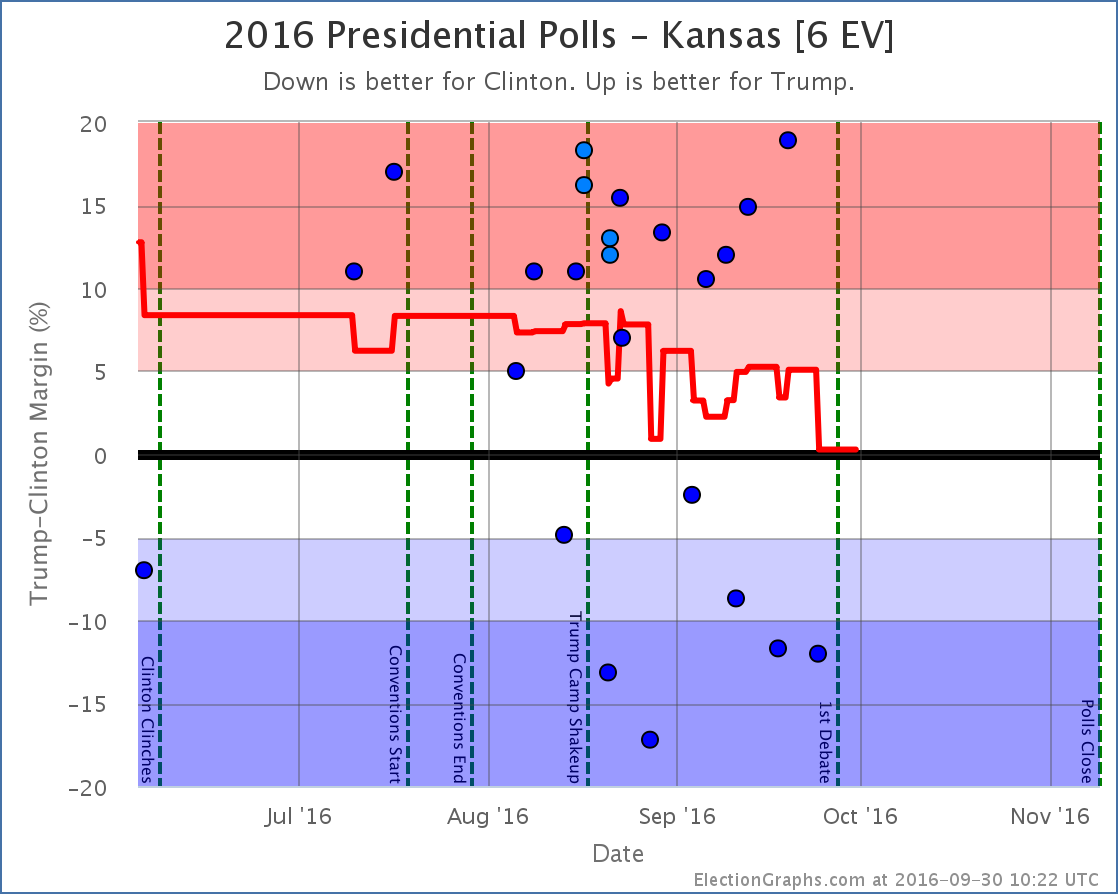
But there are six states where the average shows Trump leading by less than 0.5%… North Carolina, Nevada, Kansas, Ohio, Florida, and Iowa. Even if you don’t believe Kansas (I am personally dubious about that one), that means there are 74 electoral votes where Trump is hanging on by a thread. If more polls pull those five non-Kansas states away, his expected case drops all the way to an 154 electoral vote loss.
Things look very close in the electoral college right now, but that could change in a hurry!
The volatility of the electoral college measure means to really judge how “close” the race is, we’d be better off looking at the tipping point:
Although the tipping point also has ups and downs as states move around, there is a trend here too. Trump peaked on September 7th when Clinton was ahead by only 0.7% (in Nevada). Since then, Trump has been losing ground. With the latest post-debate drop, Clinton’s lead in the tipping point state (now Colorado) is up to 2.1%.
At the moment Trump only has to flip Colorado to be in the lead. And a 2.1% lead is not a huge margin there. This is still close. Just not at close as it was.
So far the post-debate moves actually look more like a continuation of trends that started earlier rather than a big change caused by the debates, but even after five days, most of the close states just have a small number of post-debate polls, so we may not be seeing the complete picture yet.
37.9 days, 2 presidential debates, and 1 VP debate left to go until polls start to close…
State Details
All the state level details for those who want to dig in…
Weak Clinton to Strong Clinton
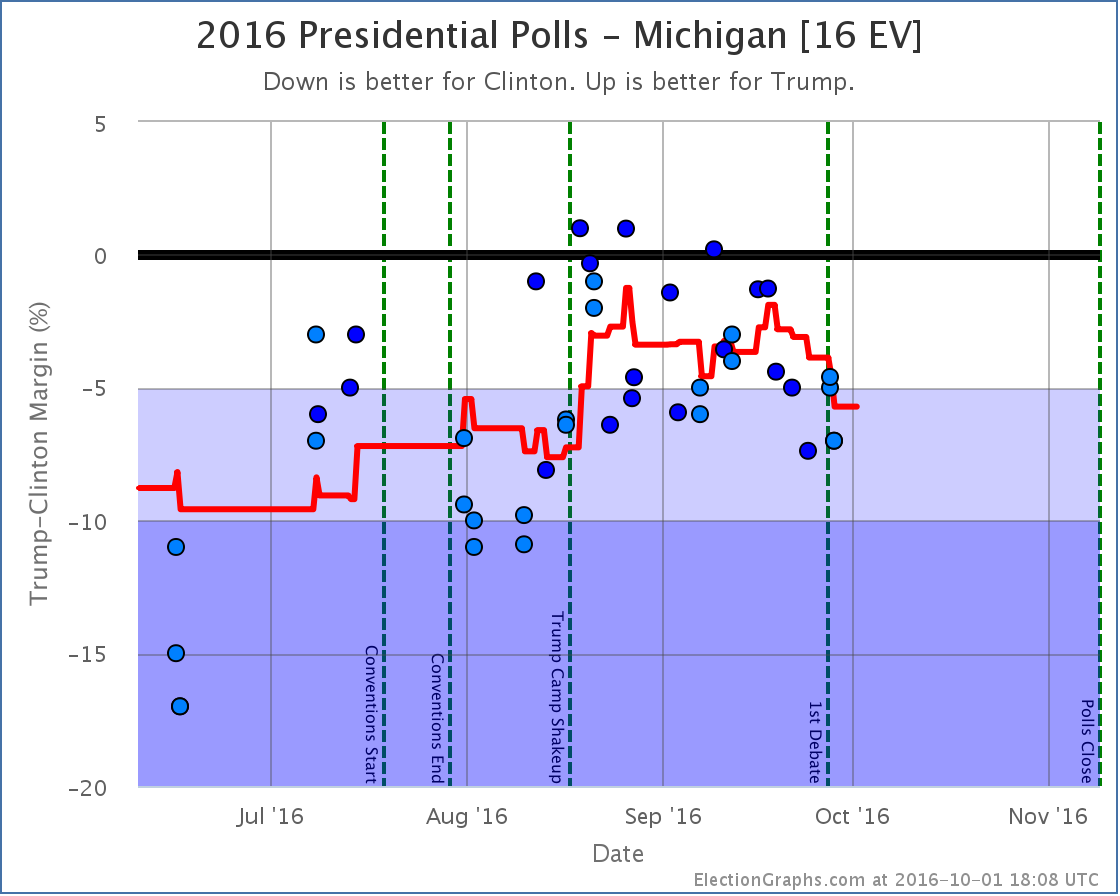
The poll average in Michigan has been moving toward Clinton since September 18th. With the latest update, which included two separate post-debate polls, Clinton’s lead increases to 5.7% which moved the state out of reach for Trump, leading to the reduction of his best case mentioned above.
Didn’t change categories, but moved the tipping point
Weak Trump to Weak Clinton then back again
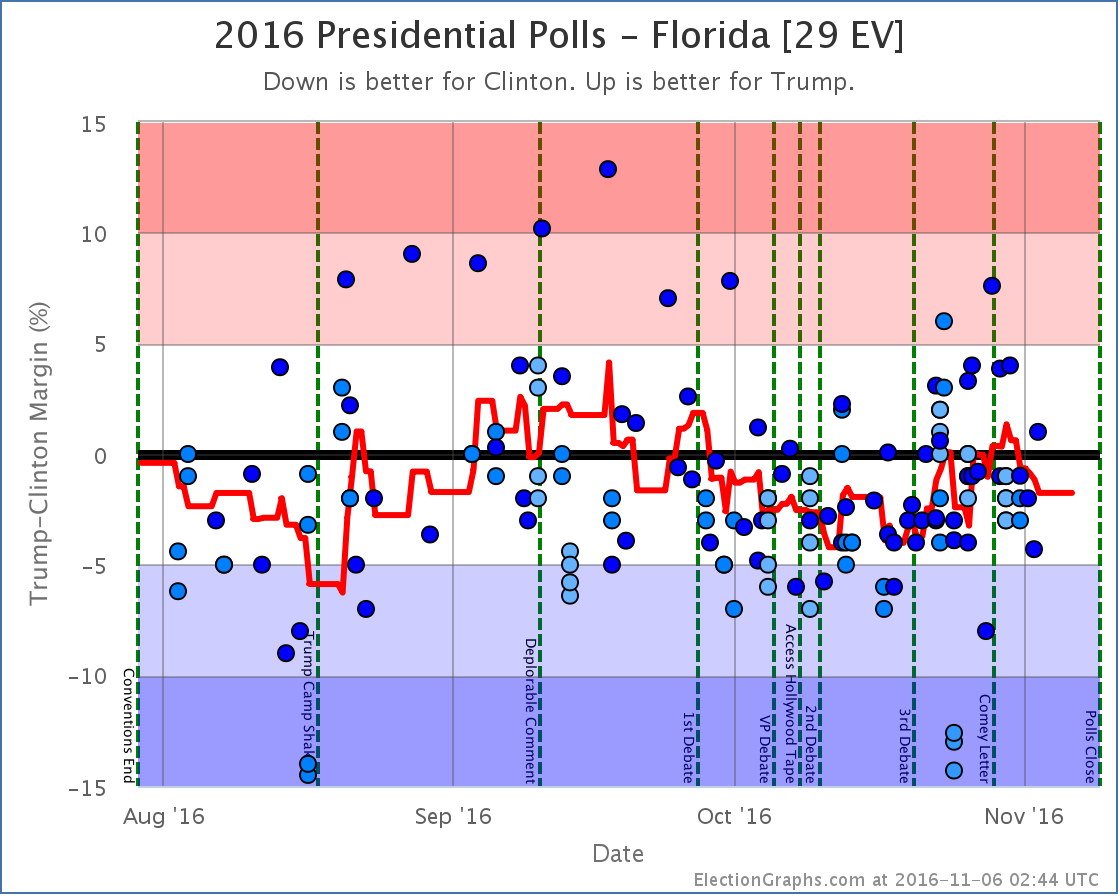
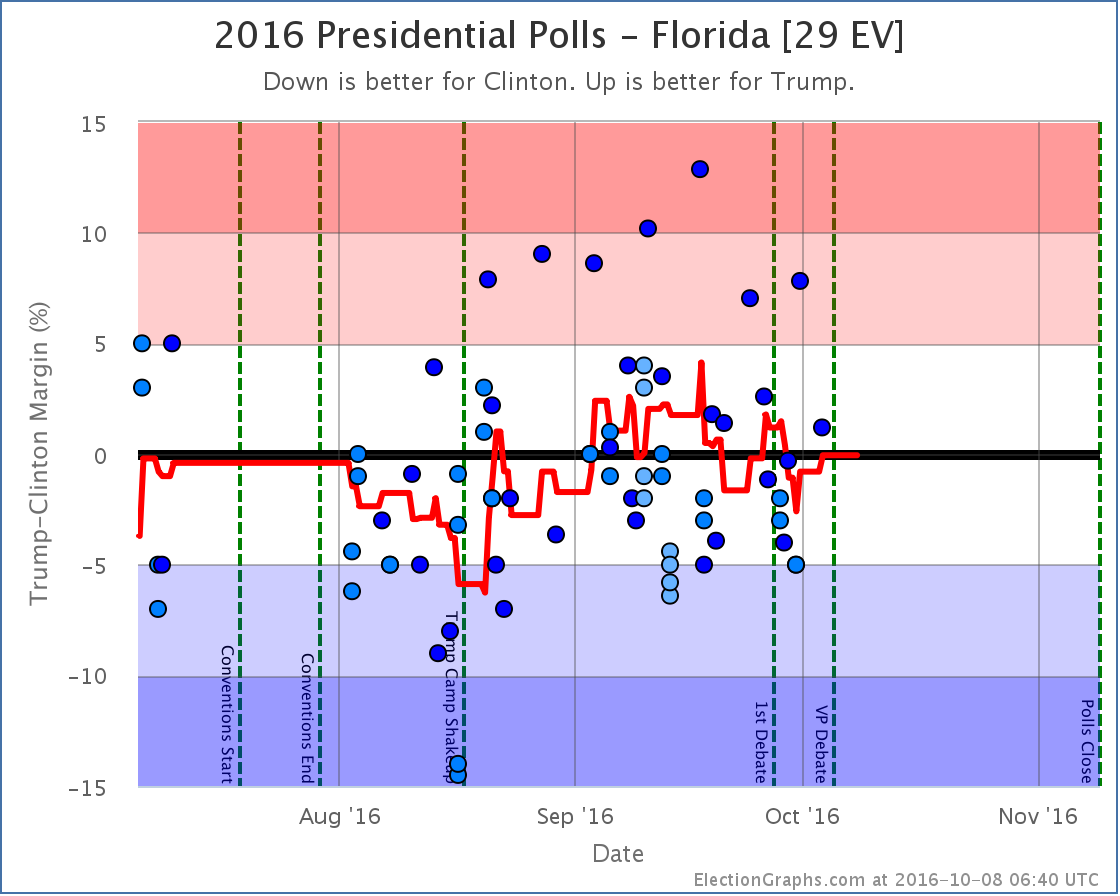
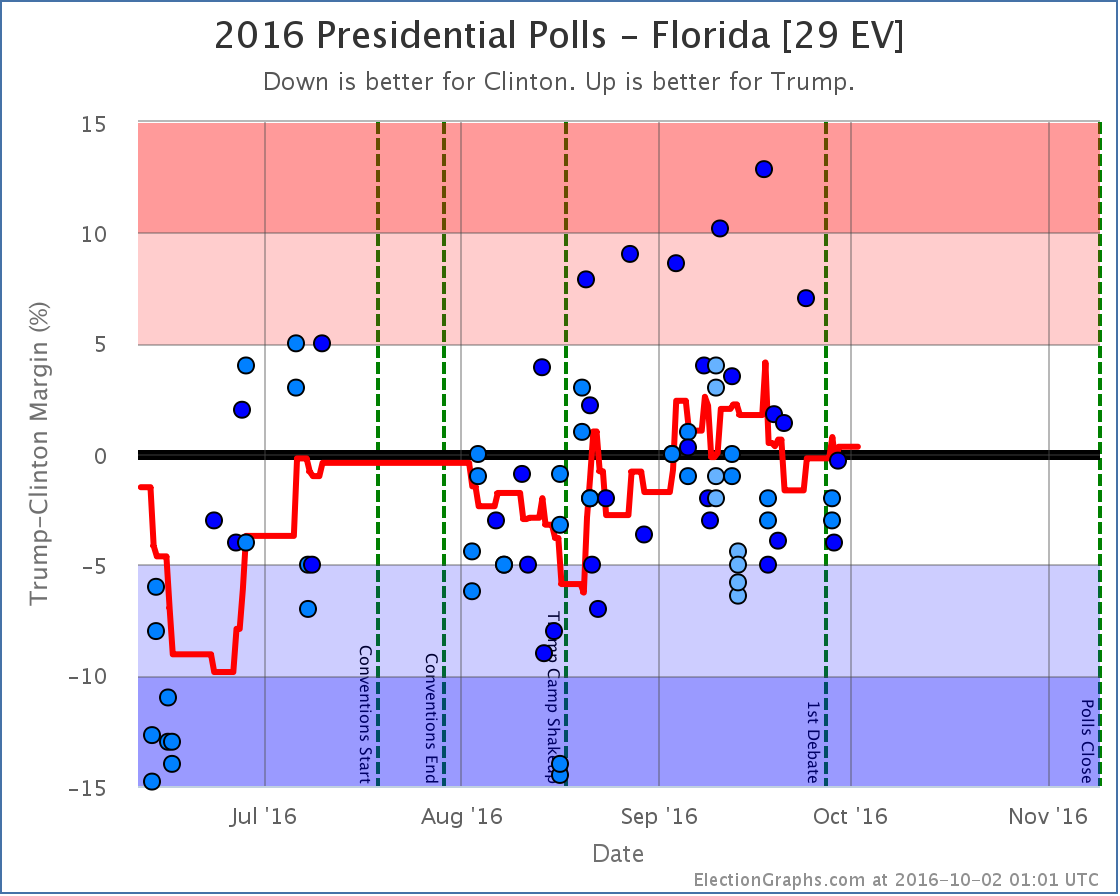
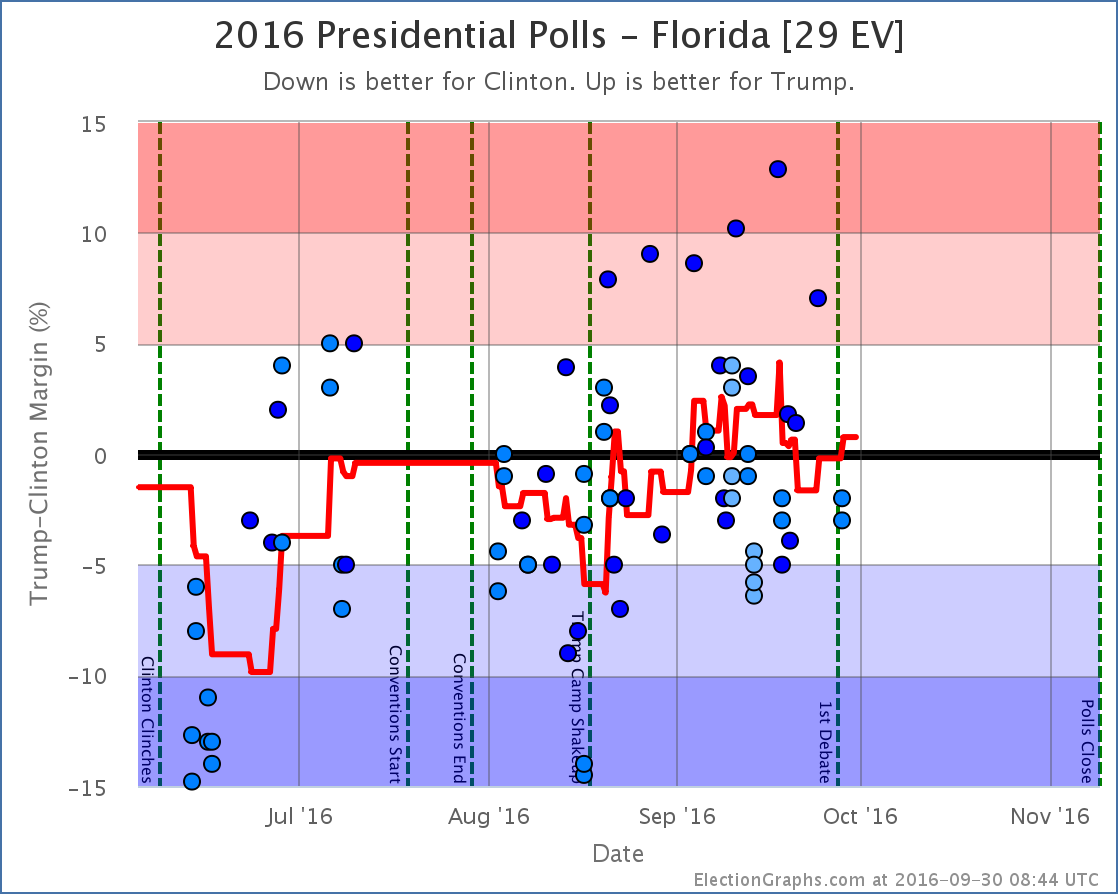
With the latest batch of polls Florida moved from just barely Trump to just barely Clinton, then moved right back again. As this round ended, Florida ends up with an 0.3% Trump lead. The bottom line with Florida is it has been “close” for all but a few days since the conventions ended. Unless we start seeing a definitive movement in one direction or another, Florida remains “too close to call”.
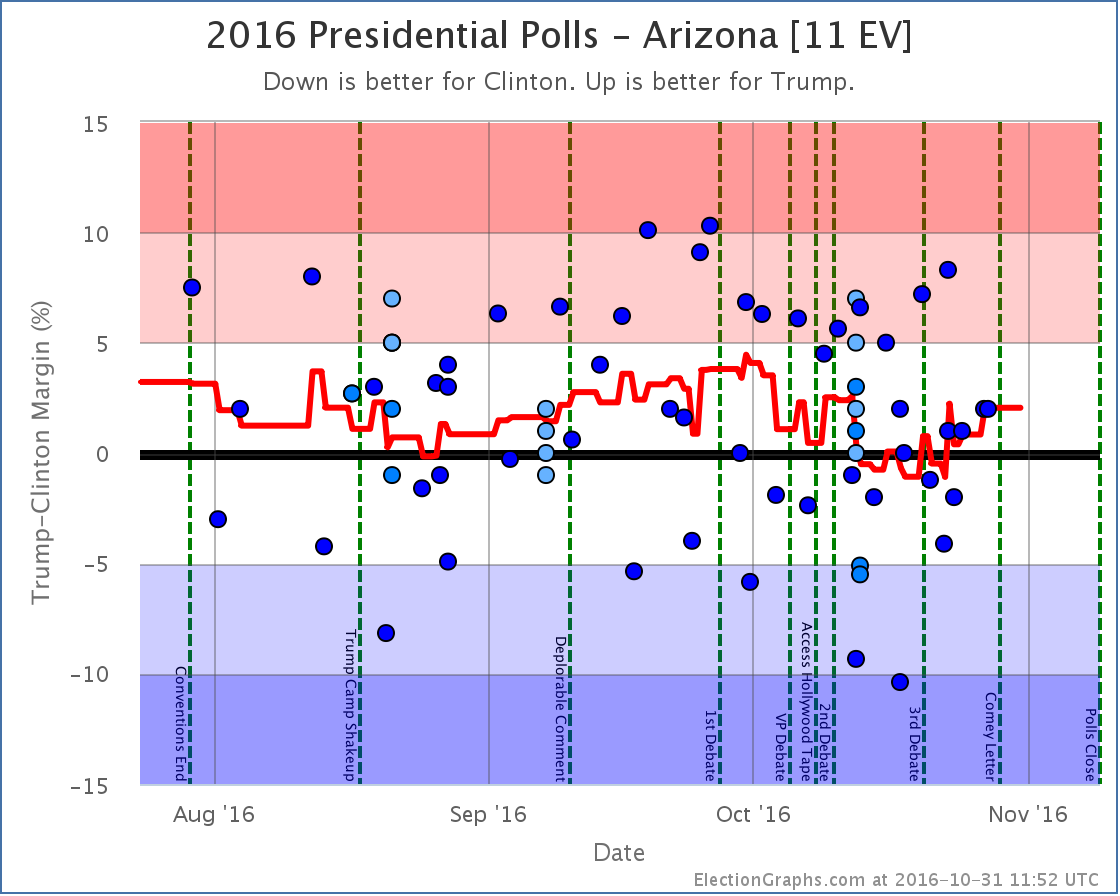
Having said that, Trump has been boosted by outlier Google polls. In the chart above, EVERY poll showing Trump with a lead more than 5% has been a Google poll. Those polls really do look like outliers. If you took Google out, Clinton would be maintaining a small but clear lead in Florida… but we include everything, and so Florida is still hovering right around the zero line.
For more information…
This post is an update based on the data on ElectionGraphs.com. Election Graphs tracks both a poll based estimate of the Electoral College and a numbers based look at the Delegate Races. All of the charts and graphs seen in this post are from that site. Additional graphs, charts and raw data can be found there. Follow @ElectionGraphs on Twitter or like Election Graphs on Facebook to see announcements of updates or to join the conversation. For those interested in individual general election poll updates, follow @ElecCollPolls on Twitter for all the polls as they are added. If you find the information in these posts interesting or useful, please consider visiting the tip jar.
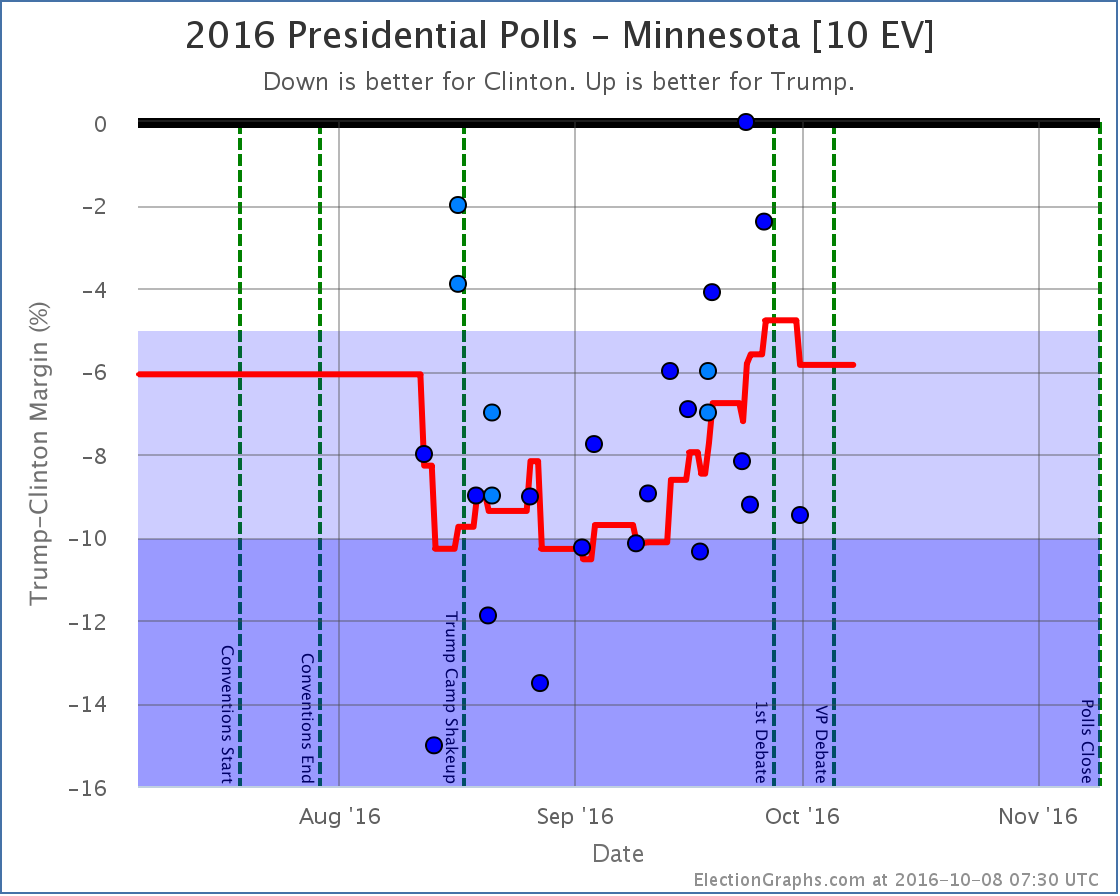
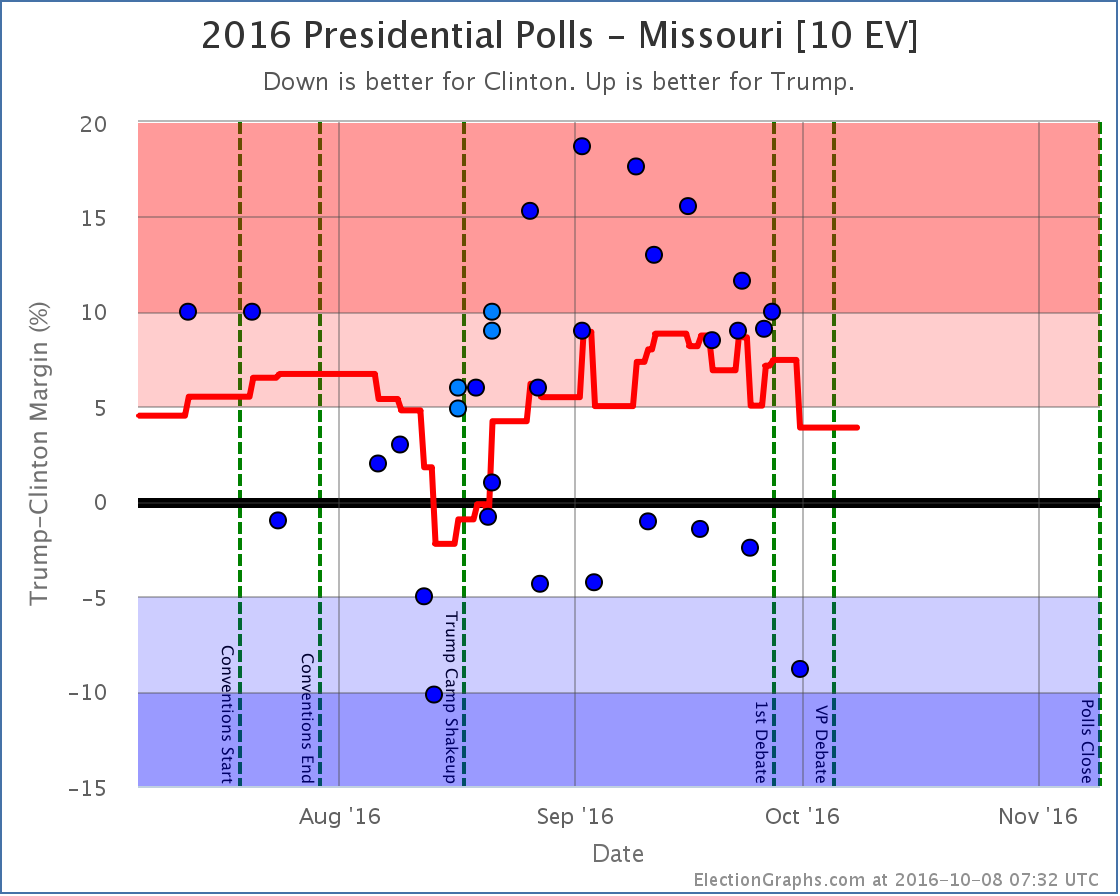
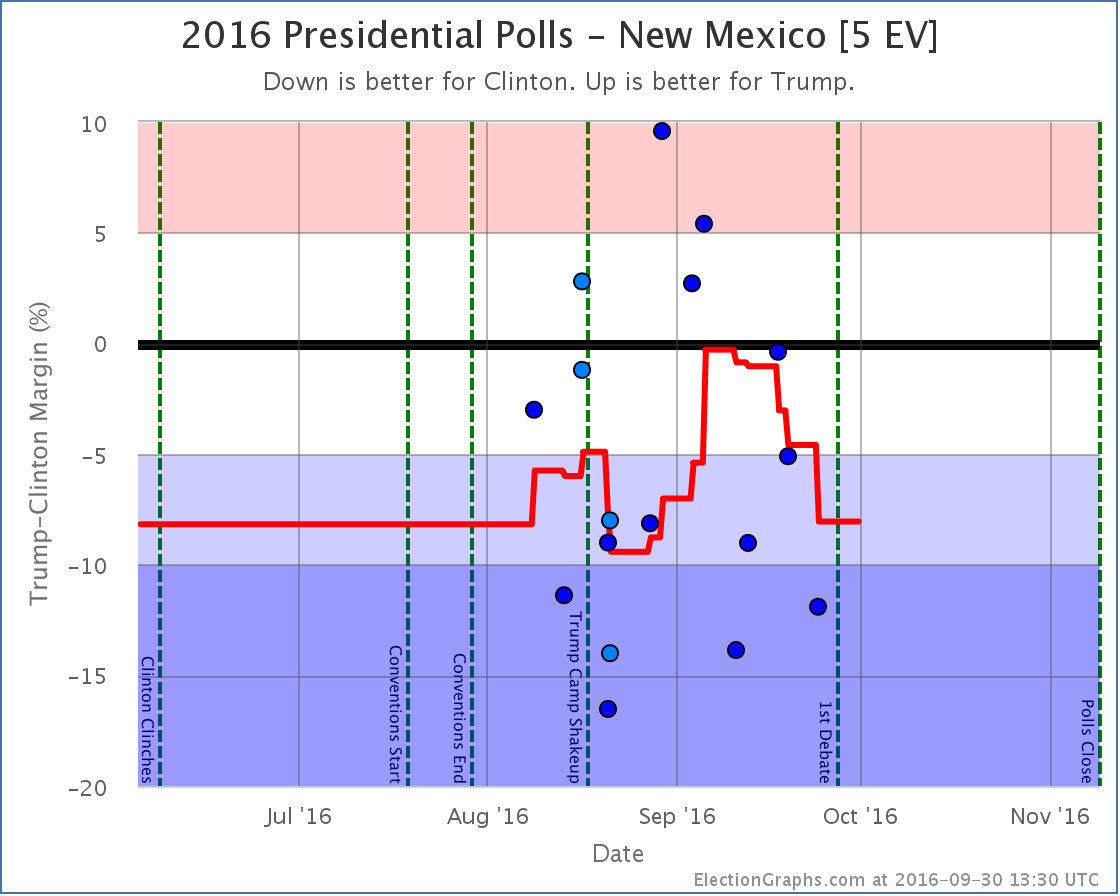
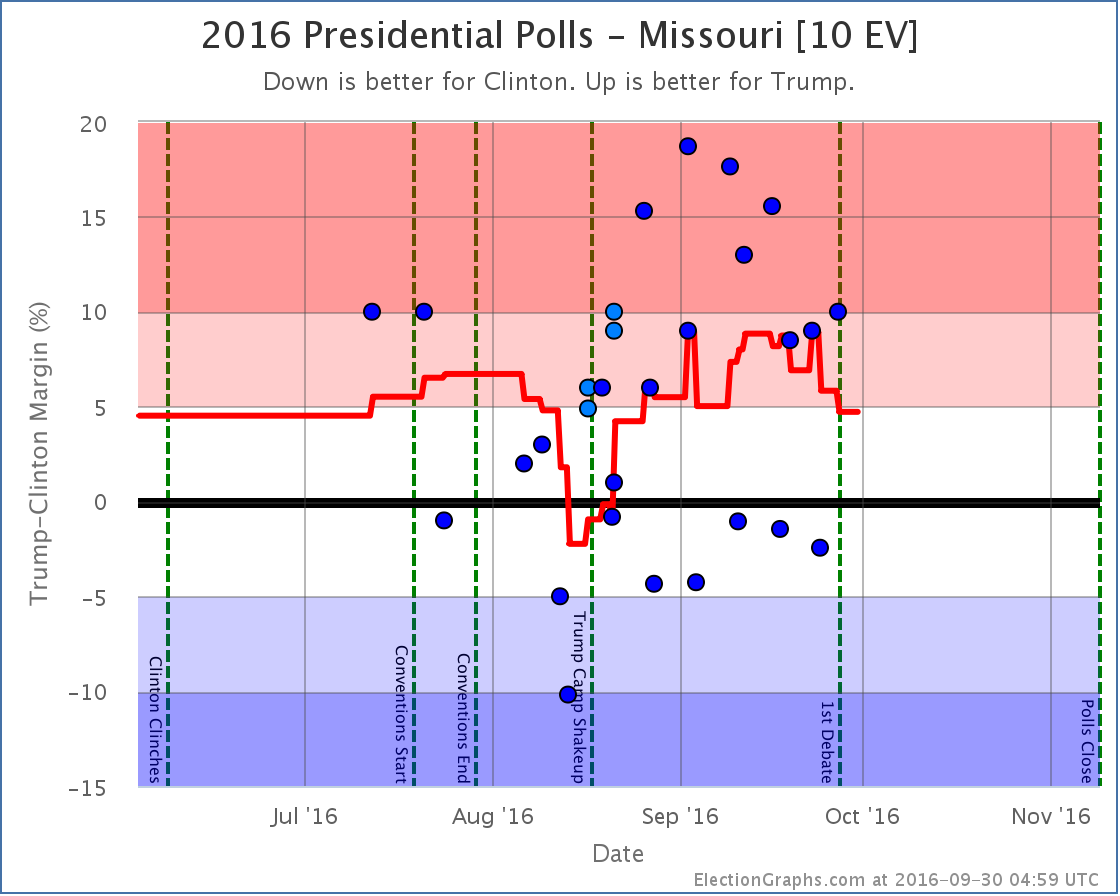
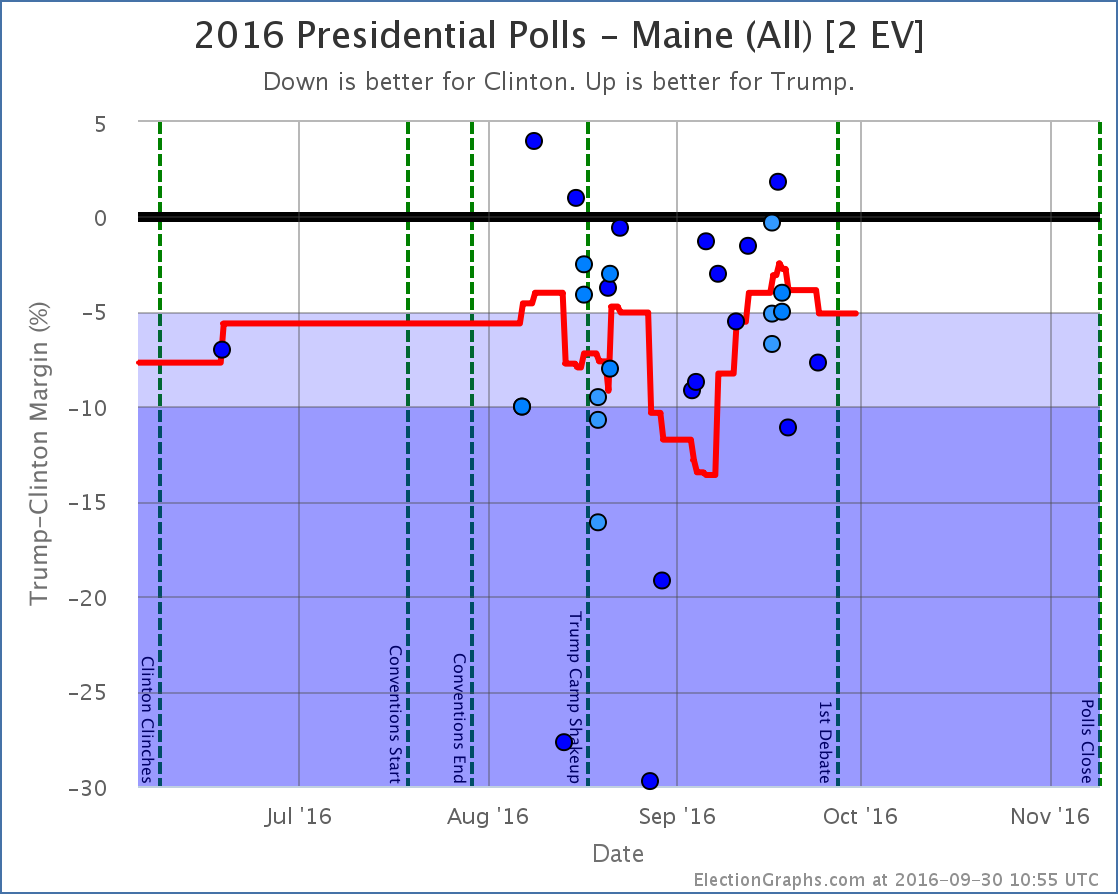
States with new poll data added since the last update: All 50 states, and DC. Notable changes in the tipping point plus New Mexico, Maine (at large), Kansas, and Missouri.
National Summary
With the latest batch of updates, there was a lot of churn that caused some big movements if you look at the charts. For a while as I entered polls it looked like Trump’s peak was definite and a clear downward trend was in place, even before the debate. But then as I continued to enter polls, most of those Clinton gains were reversed.
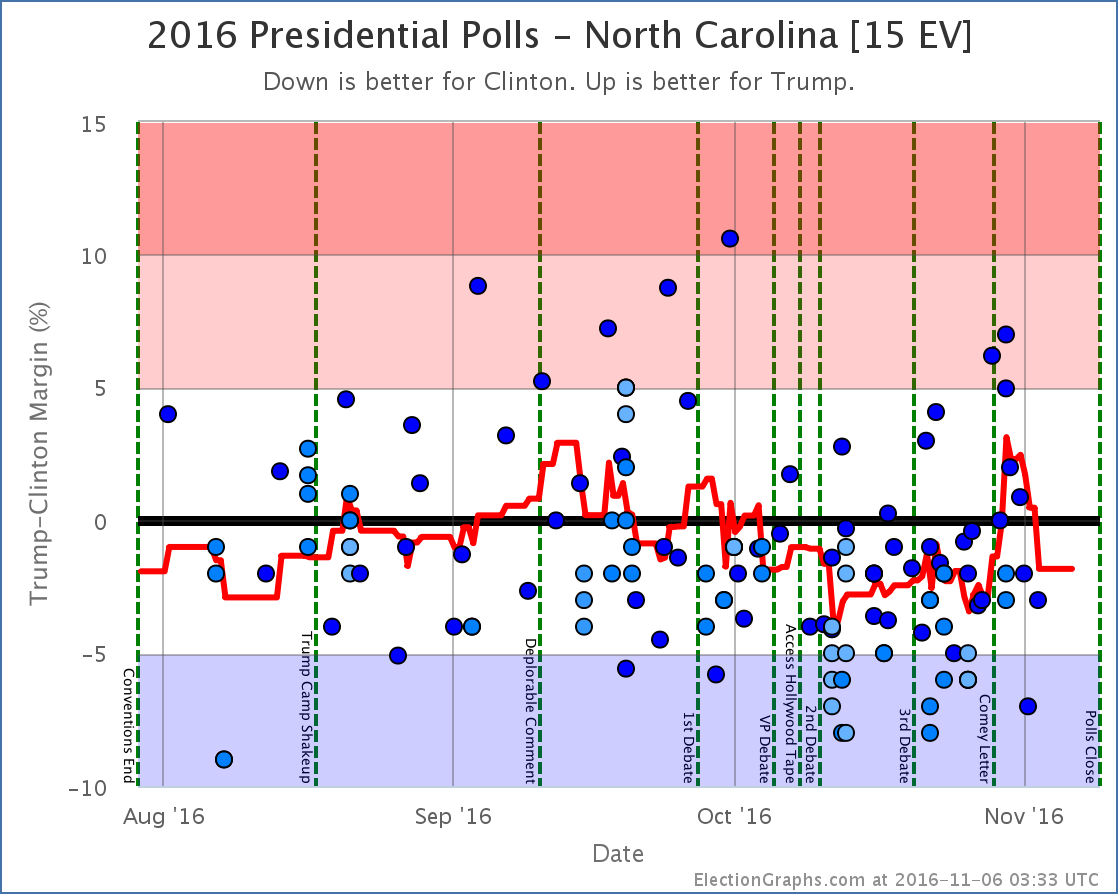
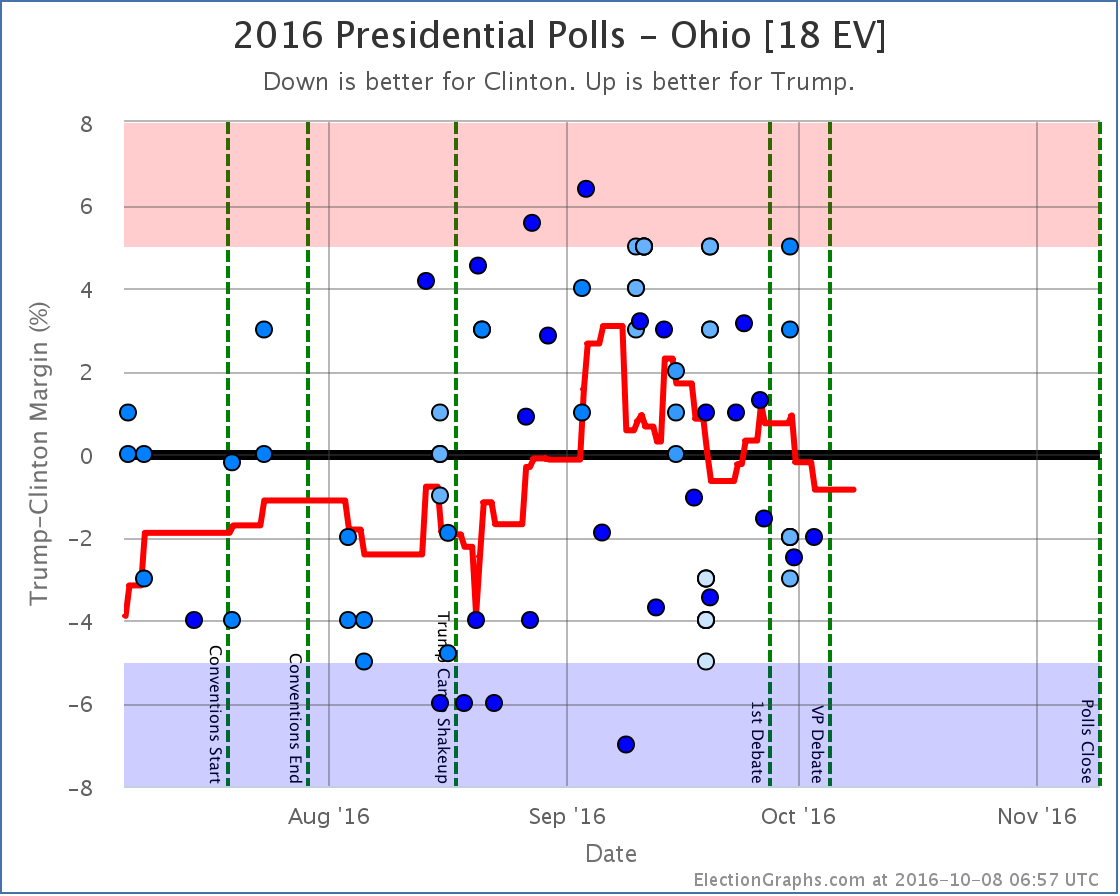
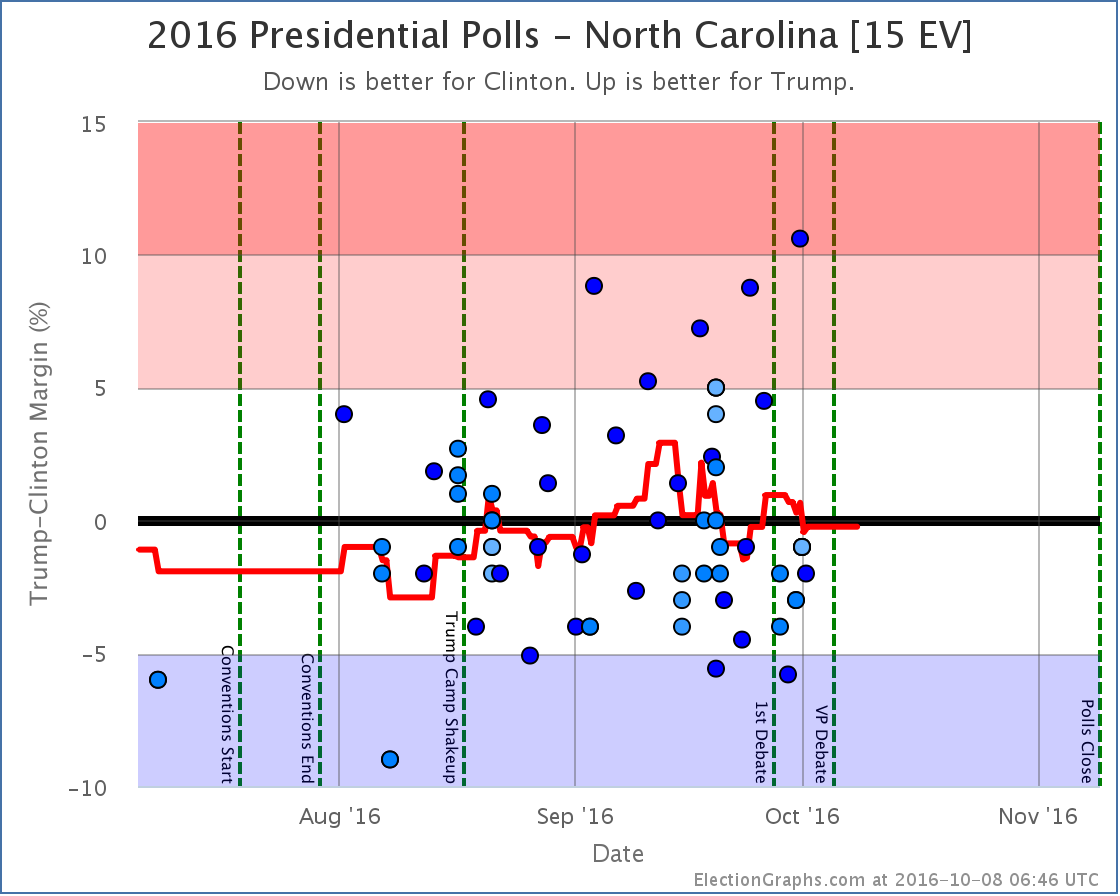
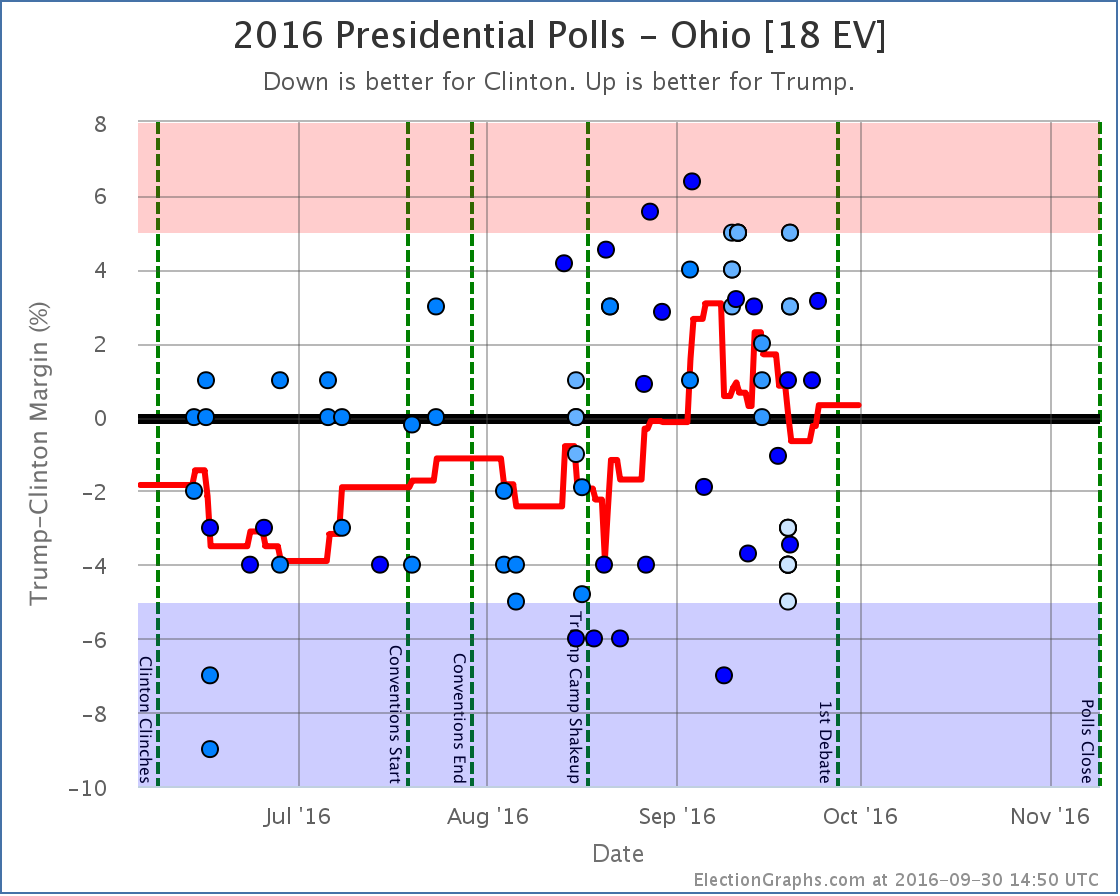
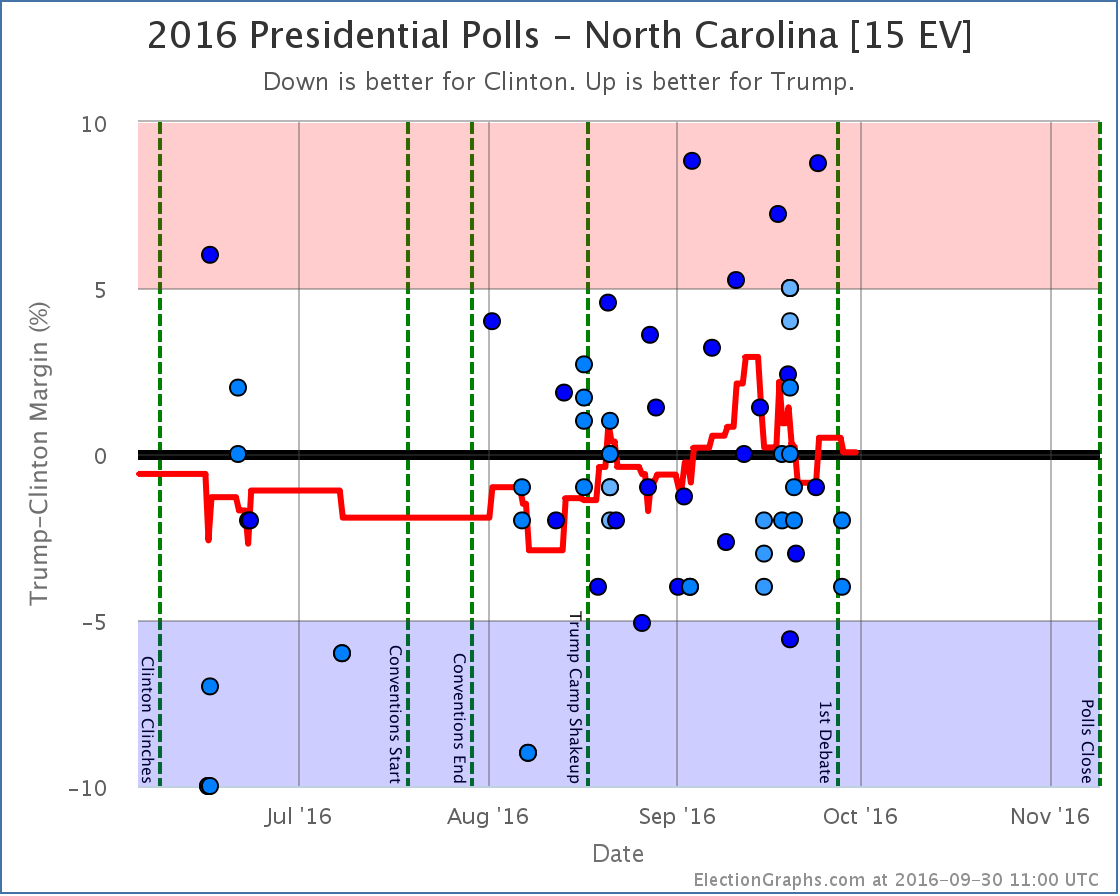
The primary reason for this? Florida [29 EV], Ohio [18 EV], and North Carolina [15 EV] are all currently very close in my averages. Close enough that single polls can move them back and forth across the center line. As I worked through this round of poll updates, all three of these states moved from Weak Trump to Weak Clinton and back again. Now, the actual changes in the averages in these three states were not much. They just happened to pass the zero line, and have large numbers of electoral votes.
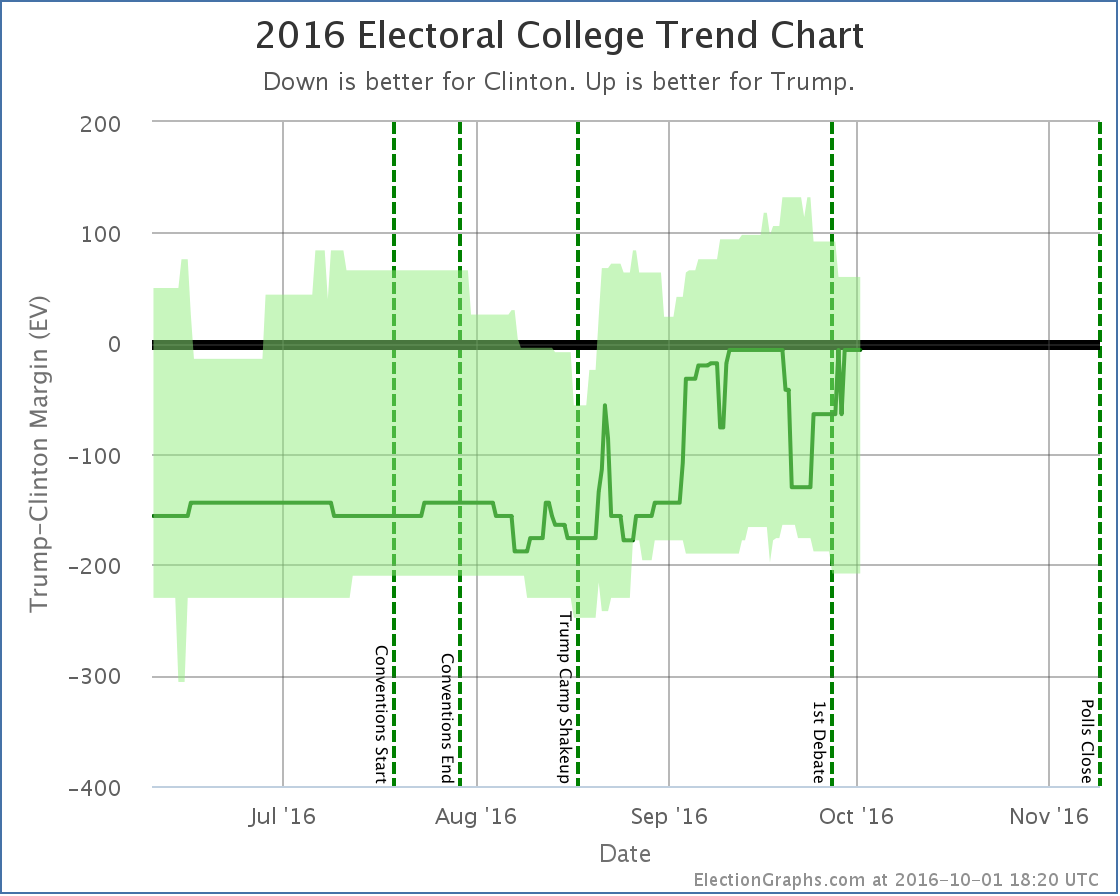
So if you look at the “Expected Case” chart for the electoral college, you see a big move toward Clinton, then a big reversal a few days later. Because of the nature of the electoral college, you should expect (and be careful interpreting) large electoral college moves like this so long as there are big states that are close. In these cases looking at the tipping point provides a different view with a bit less volatility.
In any case, looking only at the final net change from this round of polls, we see these changes in the national picture:
The expected case moves from Clinton by 8 EV to Clinton by 6 EV
Clinton’s best case improves from Clinton by 188 EV to Clinton by 208 EV
Trump’s best case declines from Trump by 106 EV to Trump by 92 EV
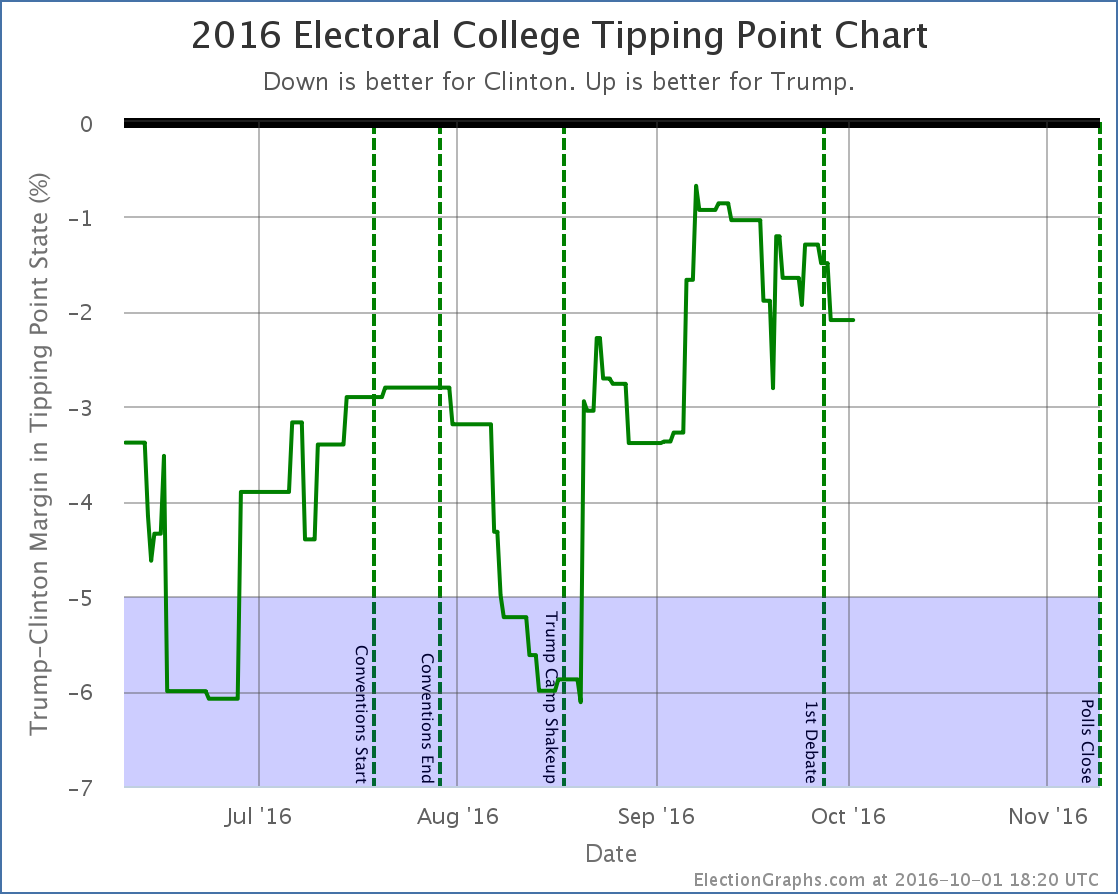
The tipping point moves from Clinton by 0.1% in KS to Clinton by 1.3% in NH
Now, this round includes a handful of post-debate polls, but almost all of the movement discussed here comes from before the debate. (The exception is Florida returning to Weak Trump after the debate.)
Looking at the charts…
Notice the clear dip from about September 19th to September 28th when Florida, Ohio, and North Carolina went slightly blue, then moved slightly red again. In the end, the “expected case” remained flat. The movement Clinton saw from winning by 6 electoral votes to 8 electoral votes in the last update was erased by New Mexico and Kansas both returning to their “normal” colors.
Both “best cases” moved toward Clinton though, with New Mexico and Maine at large both moving out of Trump’s reach, while Missouri moved into Clinton’s reach.
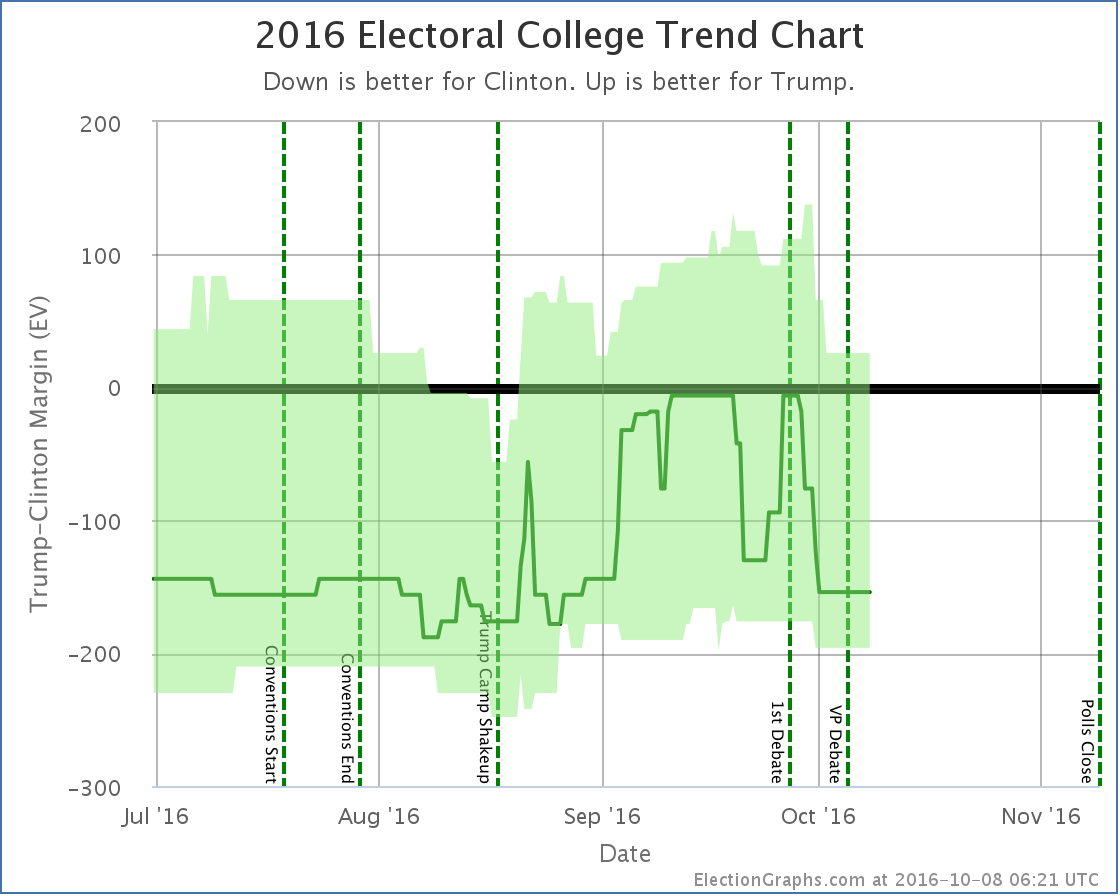
The tipping point chart doesn’t end up with huge moves when big states cross the center line, so it might be a better chart to look at right now to see how the race is moving. What we see is that after big gains starting with Trump’s campaign shakeup on August 17th, Trump seems to have peaked around September 7th… way up from where he had been, but never actually taking the lead… and he has been on a slow decline ever since… but we haven’t yet seen a BIG move back toward Clinton.
By most reports, Trump did badly in the debate, and has been doing things counter-productive to his campaign since the debate. But this does not mean large numbers of people have changed sides. Maybe this will happen, maybe it won’t, but the small number of post-debate polls already included here don’t yet show it. (In fact, as I mentioned, the single state category change post-debate so far is a move toward Trump.)
Additional post-debate polls are coming in quickly now, but I had to cut off the round poll updates somewhere to get this blog post out. There will be another update soon enough, and we’ll start to see a bit better what (if any) lasting change comes out of the first debate. Of course just about as soon as there has been enough time to see that in the polls, it will be time for the next debates…
39.4 days left until polls start to close.
State Details
For those digging into the details, here are the charts for all the states influencing the analysis above:
The big close states:
Weak Clinton to Weak Trump
Strong Trump numbers from Ipsos and CVoter balance out the strong Clinton numbers from Google and leave us with an essentially tied Kansas and erase the short blue period for the state I noted last time. (The Ipsos and CVoter results came out later, but covered an earlier time period, so they moved the lines in the past, not just the current number.)
As I stated last time I am incredulous about the Google numbers, and wish there was more additional polling in Kansas to clear up what is really going on there.
Weak Trump to Strong Clinton
New polls in New Mexico erased the short foray into red territory for New Mexico. As with Kansas, since some of the “new” polls covered older date ranges, the shape of the curve in the past changed as well as the current number.
Strong Trump to Weak Trump
Weak Clinton to Strong Clinton
Other states that influenced the Tipping Point
Note on placing polls on the timeline
I somehow forgot to mention this in my recent interview about this site, but it seems relevant to the discussion above… Many other election tracking sites place polls based on the END of the poll’s time in the field. I place polls on the timeline based on the mid-date of their time in the field. I think this does a better job at trying to identify when directional changes happen, because if an event and a mid-date are aligned, you know that the poll was half before and half after the event. When you place polls by the end of their field time, you can’t make any sort of statements like that about how the poll results match up with the event without referring to the specific start and end dates.
For more information…
This post is an update based on the data on ElectionGraphs.com. Election Graphs tracks both a poll based estimate of the Electoral College and a numbers based look at the Delegate Races. All of the charts and graphs seen in this post are from that site. Additional graphs, charts and raw data can be found there. Follow @ElectionGraphs on Twitter or like Election Graphs on Facebook to see announcements of updates or to join the conversation. For those interested in individual general election poll updates, follow @ElecCollPolls on Twitter for all the polls as they are added. If you find the information in these posts interesting or useful, please consider visiting the tip jar.
Edit 2016-10-01 00:34 UTC to correct the one state that moved after the debates. I had said it was North Carolina moving back from Weak Clinton to Weak Trump, it was actually Florida.