States with new poll data since the last update: Iowa, Colorado, Michigan, Ohio, Pennsylvania, Virginia, Wisconsin, Florida
In advance of the conventions there has been a large volume of recent polling. For the first time with this update the polling average in some states is based fully on polls with their middates within the last seven days. Right now there is no shortage of state level polling and we are seeing lots of movement. Some of this may be random movement depending on which polls are most recent at any given time, but it is likely we are also detecting actual changes on the ground as well.
With the current batch of polls there are notable changes in four states. Pennsylvania, Ohio, and Iowa move toward Trump, while Colorado moves toward Clinton. Lets look at all four of these changes individually, then we’ll review the national picture.
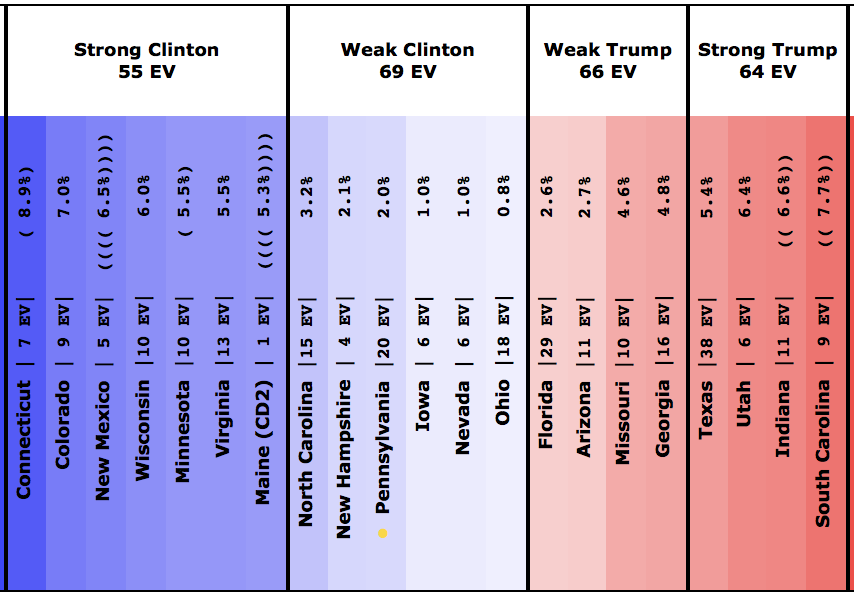
Pennsylvania [20 EV]
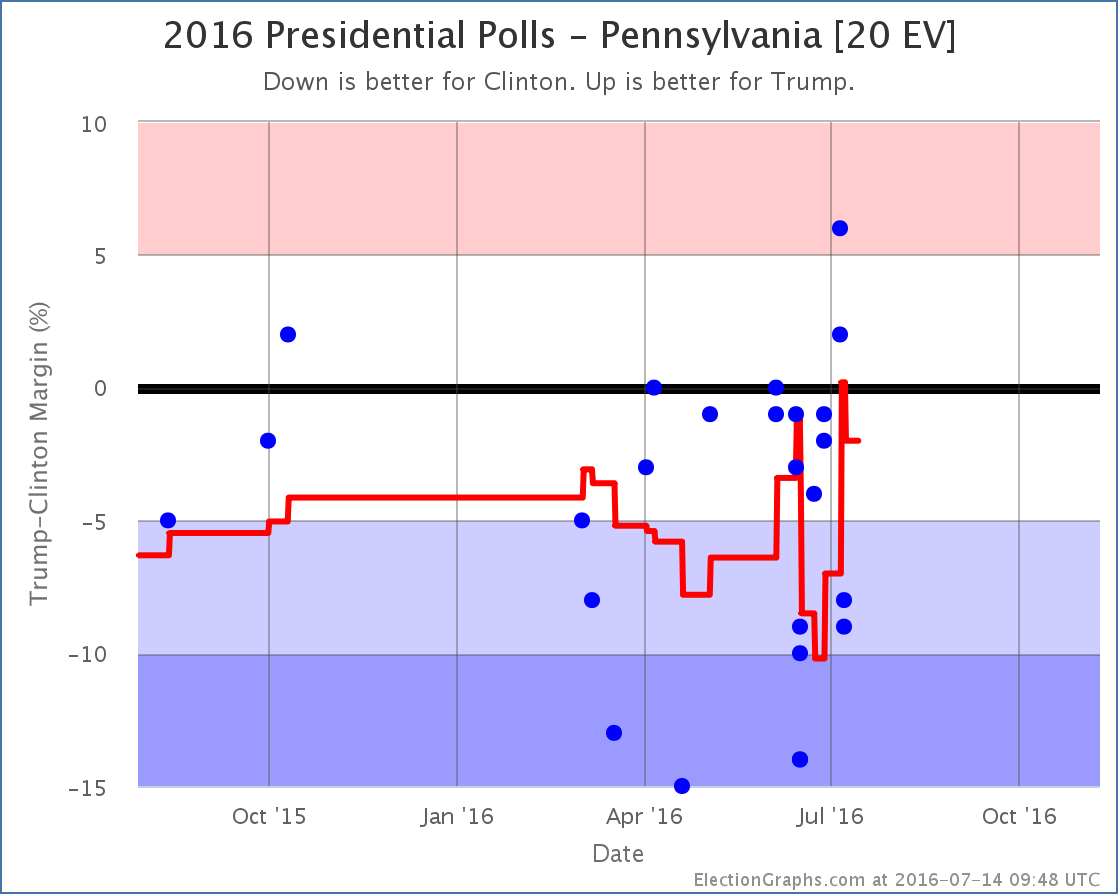
Polls for both Quinnipiac and Marist were added with this update. These were released and added on the same day. You can see above though that the Quinnipiac poll (which covers a slightly earlier date range) actually briefly spiked Pennsylvania into Weak Trump before the Marist poll pushed things back to the Clinton side.
Net result together though, Pennsylvania tightens, but Clinton is still ahead… by a narrow 2.0% margin.
With Pennsylvania in play again, Trump’s best case improves. In addition, this change contributed to moving the tipping point toward Trump.
Ohio [18 EV]
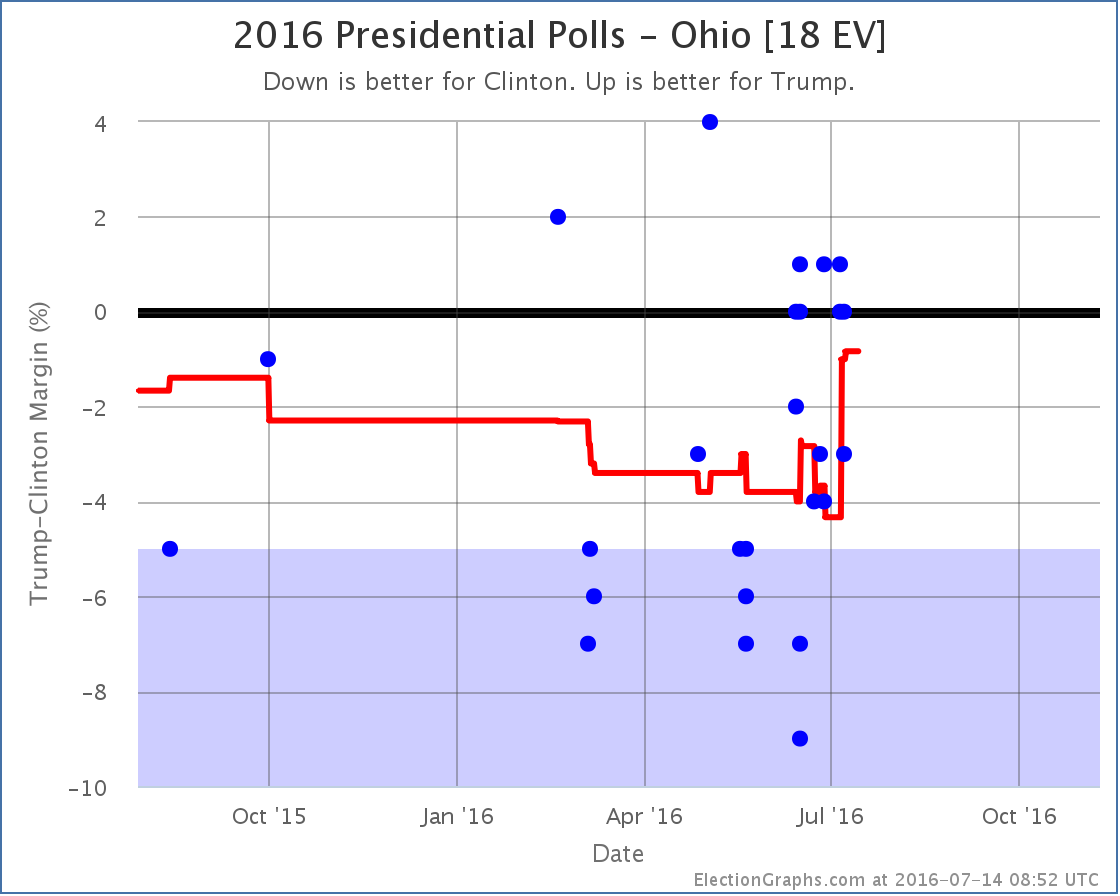
With the newest polls Trump sees a bump as some polls very favorable to Clinton from mid-June roll off the average. Clinton now leads Ohio by only 0.8%. There is no change in categories here. Weak Clinton before, Weak Clinton after. But the movement in Ohio combines with the movement in Pennsylvania above to impact the tipping point.
Colorado [9 EV]
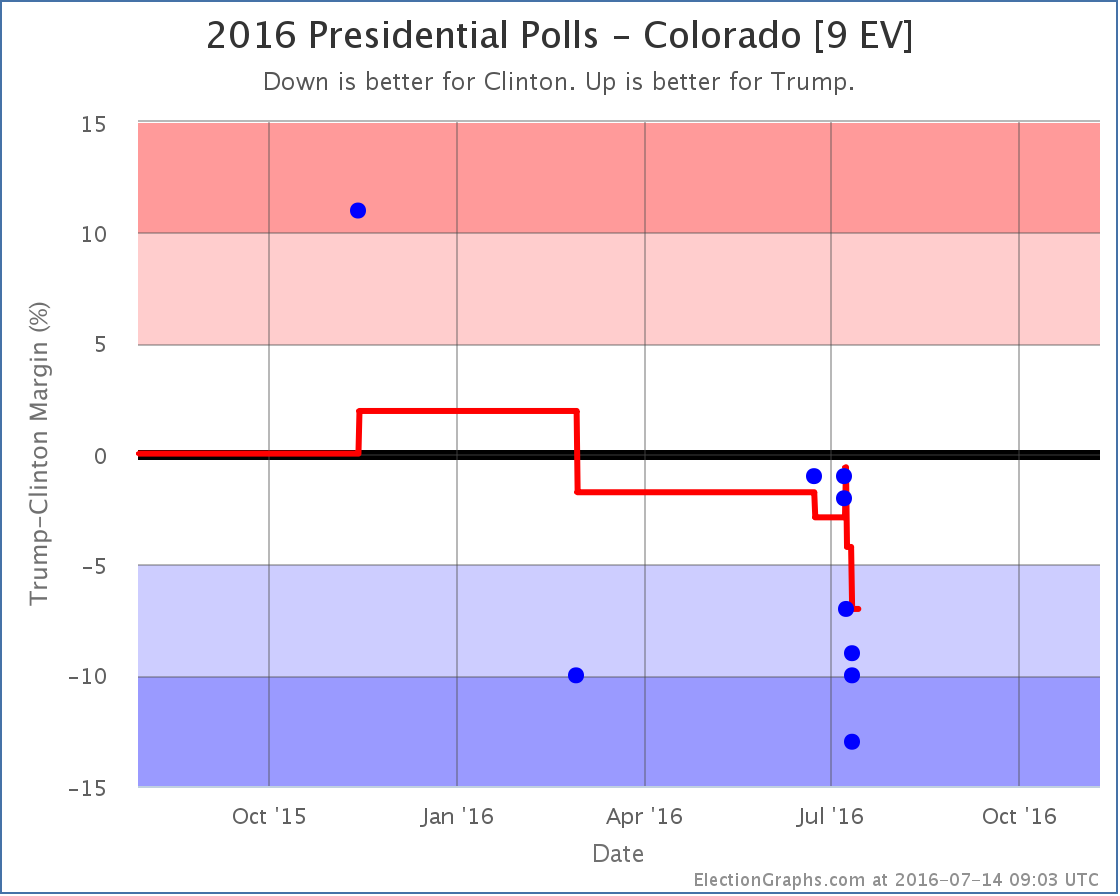
After spending what seemed like forever as the least polled “close state”, we all of a sudden have lots and lots of polls in Colorado. The end result? Colorado had looked like a very close state based on the average results of the last few elections. But now that we finally have a decent volume of Clinton vs Trump polls, Clinton has a clear lead. She is now ahead by a healthy 7.0%.
So in the only one of today’s moves that is in Clinton’s direction, Colorado moves out of reach for Trump. At least for now. This reduces Trump’s best case.
Iowa [6 EV]
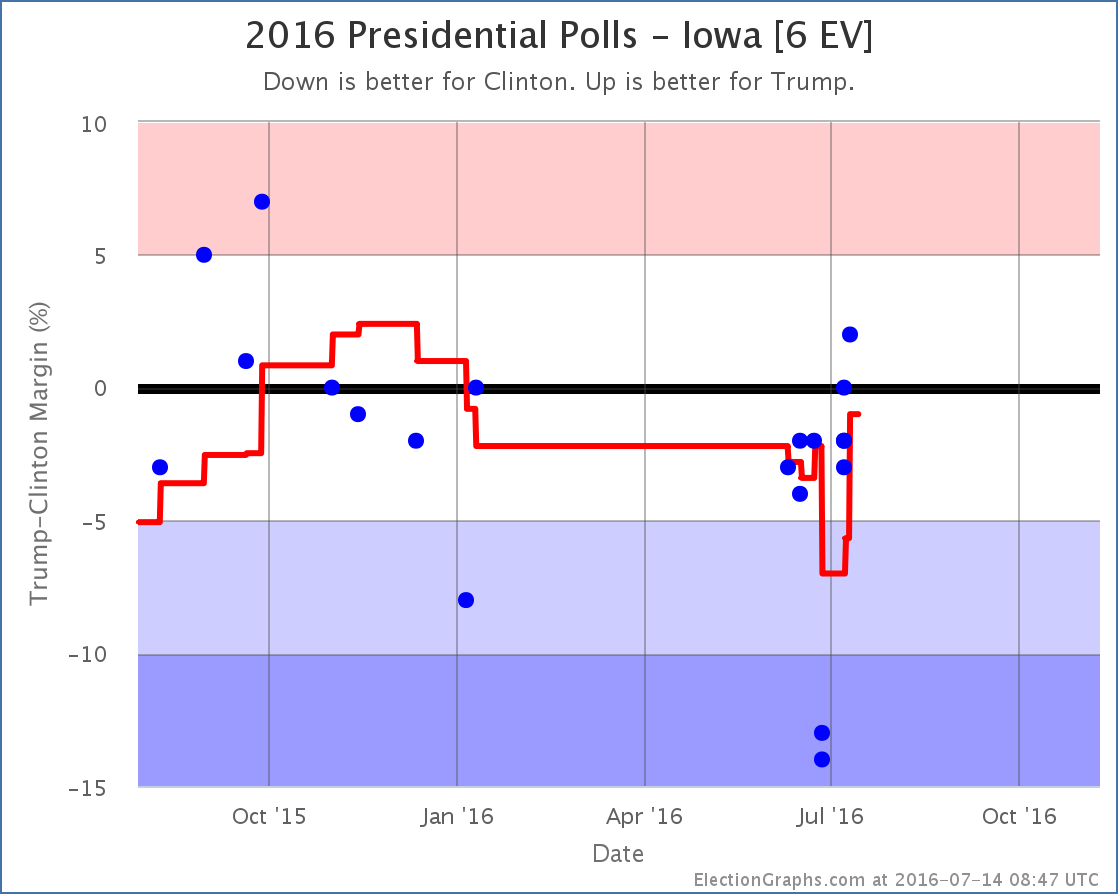
New Gravis and Marist polls push Loras polls from the end of June off the average… polls which now look like clear outliers… and so the average moves in Trump’s direction. Iowa now looks very close, sitting at a 1.0% Clinton lead.
With Iowa close again, it is once again included as a possible Trump pick up, improving his best case.
National View
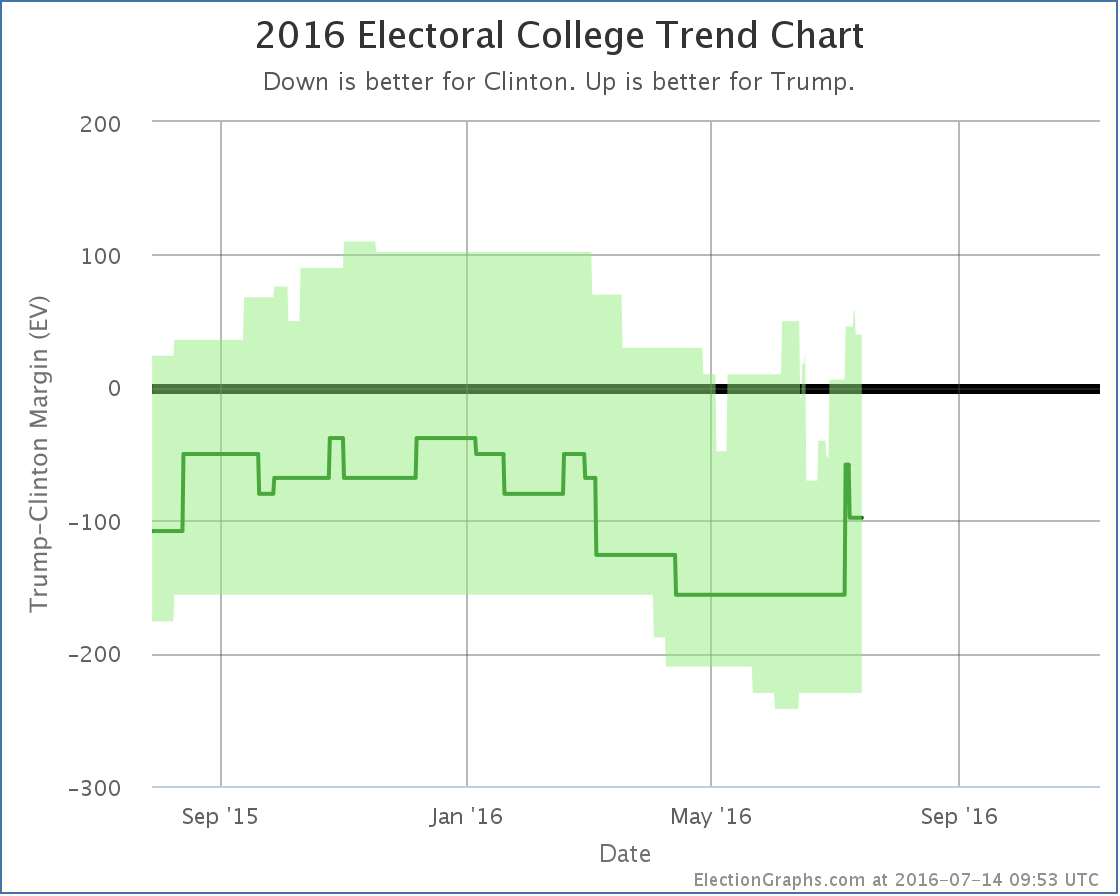
Once you factor in the two states moving toward Trump and the one state moving forward Clinton, Trump’s best case moves from winning by 6 electoral votes to winning by 40 electoral votes. No net change for the expected case despite the temporary spike.
The more impressive change though is actually with the tipping point:
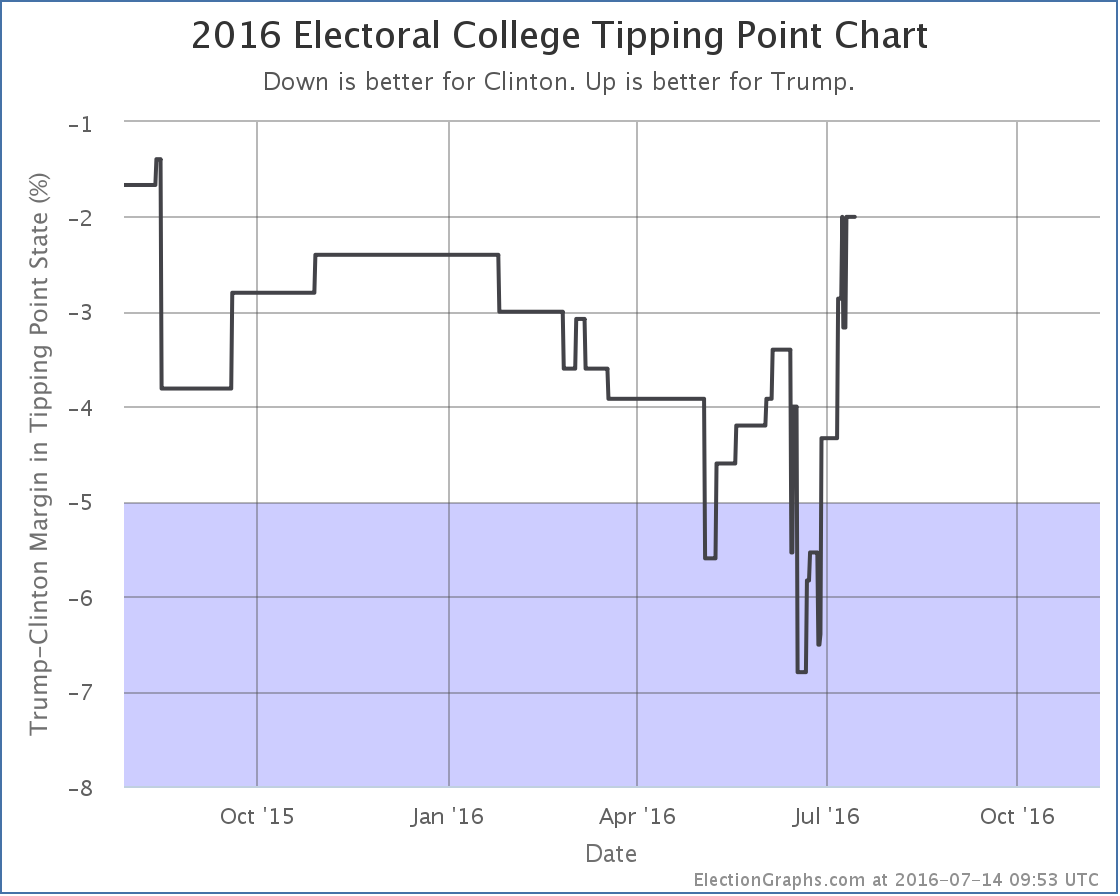
With two states moving in ways that impact the tipping point, it moves from Clinton by 4.3% in Ohio to Clinton by 2.0% in Pennsylvania. This is the best position Trump has had in this metric since last August.
Trump is of course still behind. But a 2.0% tipping point means you only would need 1% of people flipping from Clinton to Trump to push Trump into the lead, or undecideds breaking in his direction. For the first time in a long time, this is looking like a close race again.
Looking at the center of the spectrum, Trump’s shortest path to being in the lead goes through Ohio, Nevada, Iowa, and Pennsylvania. All of those states have Clinton in the lead, but by less than 2.0%, a margin that could easily evaporate overnight.
With the Republican convention starting in less than 4 days, if we see Trump get the traditional “bump” we may well see him actually in the lead for the first time this cycle sometime in the next couple weeks. This assumes of course the convention ends up coming off smoothly. If the convention becomes chaotic, the bump may evaporate.
Also acting against the bump, the Democratic convention starts only a few days after the Republican convention ends. There is no significant gap between the two conventions. Which may make any bump too transitory to measure in an electoral college based view.
If we see even a minor bump though, at this point it would be enough to put Trump in the lead.
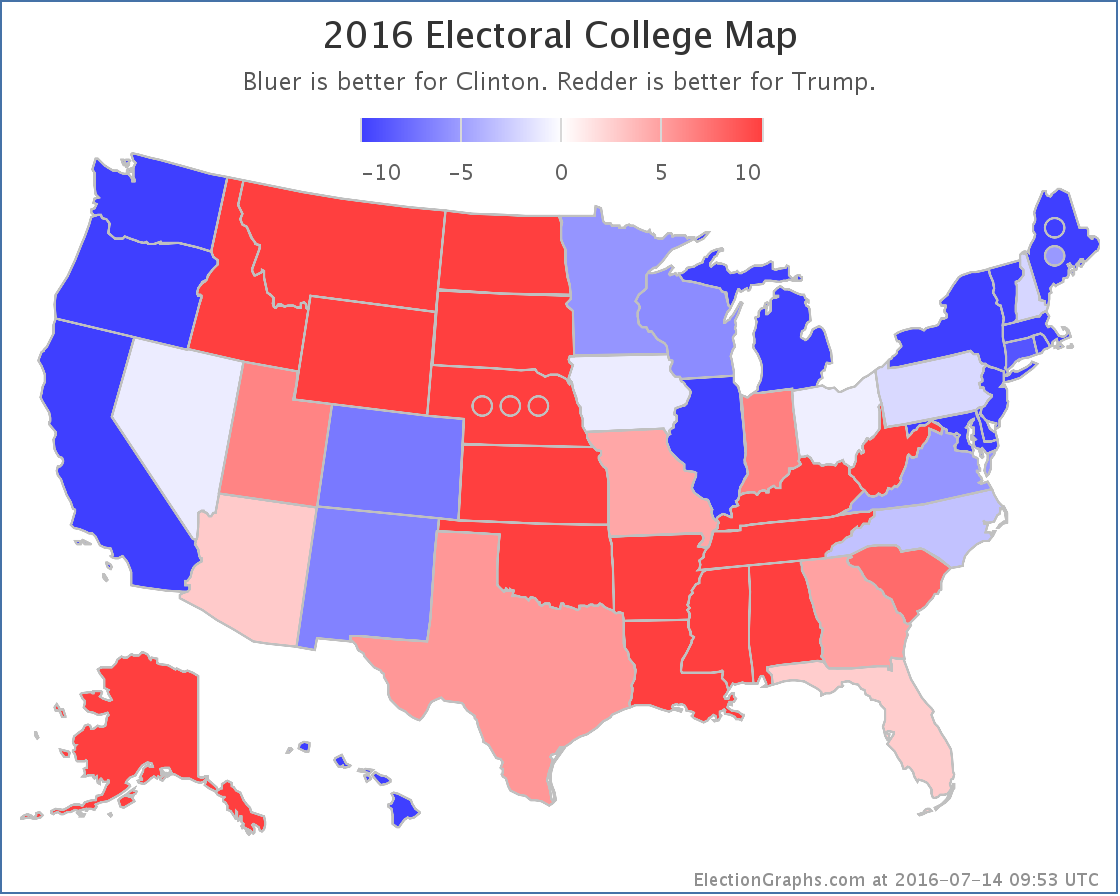
To close up today, a quick look at the current map:
117.2 days until polls start closing on Election night 2016. The conventions are upon us. Things will be nuts from here until November. Hold on tight! :-)
Note: This post is an update based on the data on ElectionGraphs.com. Election Graphs tracks both a poll based estimate of the Electoral College and a numbers based look at the Delegate Races. All of the charts and graphs seen in this post are from that site. Additional graphs, charts and raw data can be found there. Follow @ElectionGraphs on Twitter or like Election Graphs on Facebook to see announcements of updates or to join the conversation. For those interested in individual general election poll updates, follow @ElecCollPolls on Twitter for all the polls as they are added. If you find the information in these posts interesting or useful, please consider visiting the tip jar.
[Blog Post] Electoral College: Trump continues to tighten the race https://t.co/mRihrirhbp
RT @ElectionGraphs: [Blog Post] Electoral College: Trump continues to tighten the race https://t.co/mRihrirhbp