- 07:06:12 Retweeted @ElecCollPolls 07:05:33 That is all for today. New polls in GA/PA/NV. Notable changes in PA/NV so there will be an @ElectionGraphs blog post later.
- 19:54:46 [Blog Post] Electoral College: Pennsylvania and Nevada move in different directions https://t.co/c5FNSlOqVl
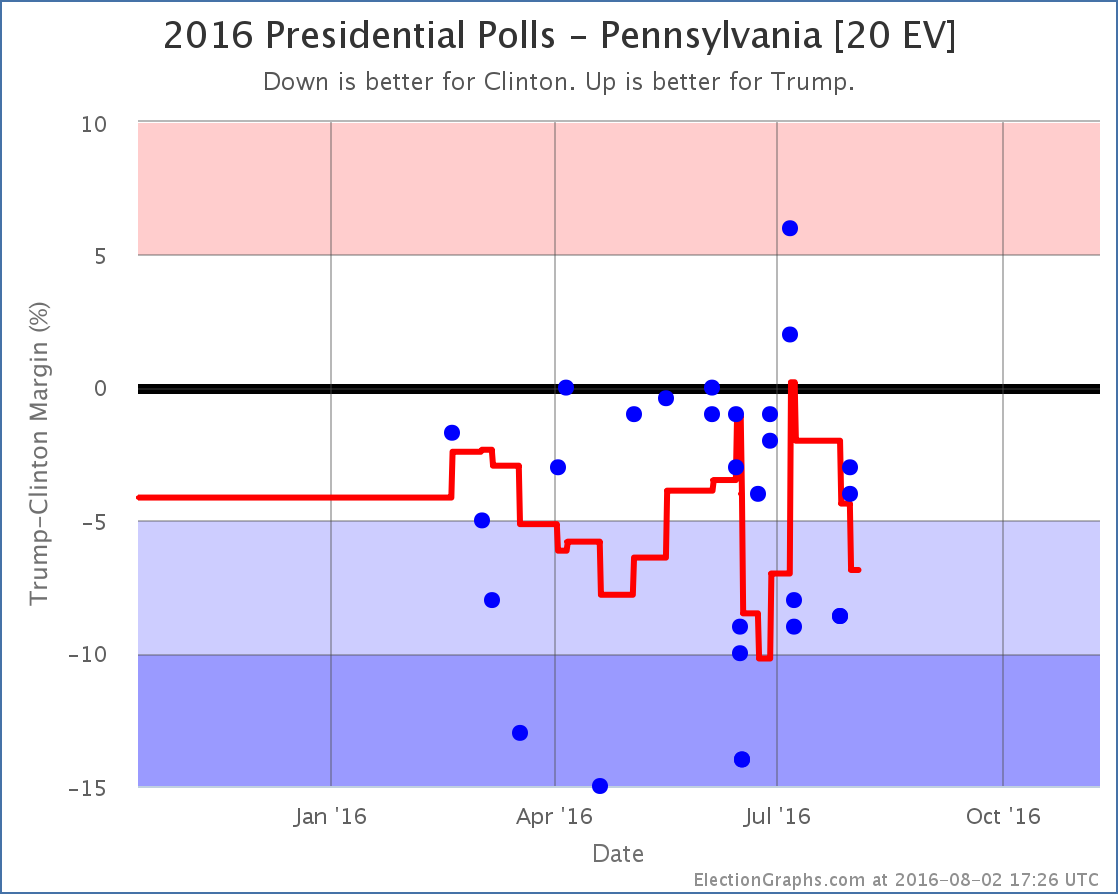
States with new poll data since the last update: Georgia, Pennsylvania, Nevada. The post convention polls continue to come in, but the most recent batch brings mixed results. One state moving toward Clinton, another moving toward Trump. Lets look at them. Pennsylvania [20 EV]
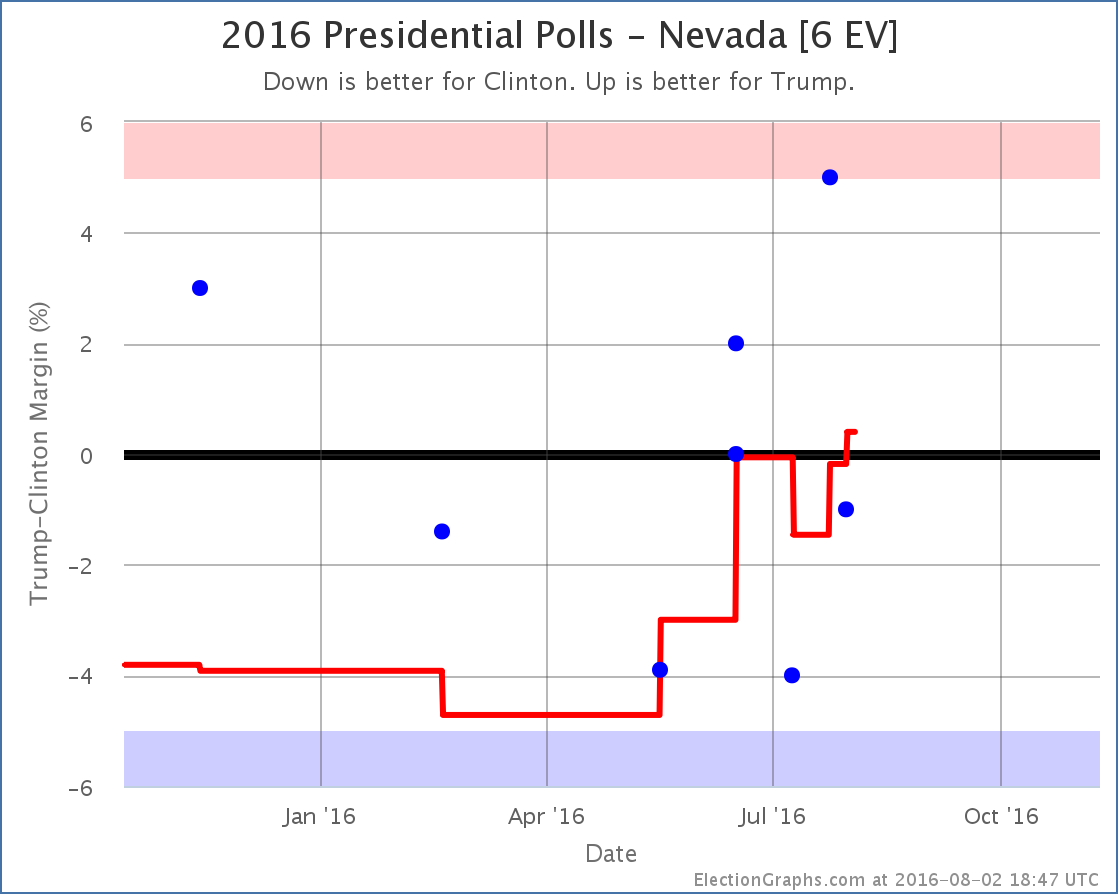
With the new PPP results added, Quinnipiac data from early July drop off the average. Those Quinnipiac results were the best polls for Trump in Pennsylvania in almost a year. Without them, Clinton looks much better off. The poll average moves from a Clinton lead of 4.4% to a Clinton lead of 6.9%. With that, we once again classify Pennsylvania as “Strong Clinton” and take it off the list of states where Trump is “close” and thus a Trump win is plausible. Nevada [6 EV]
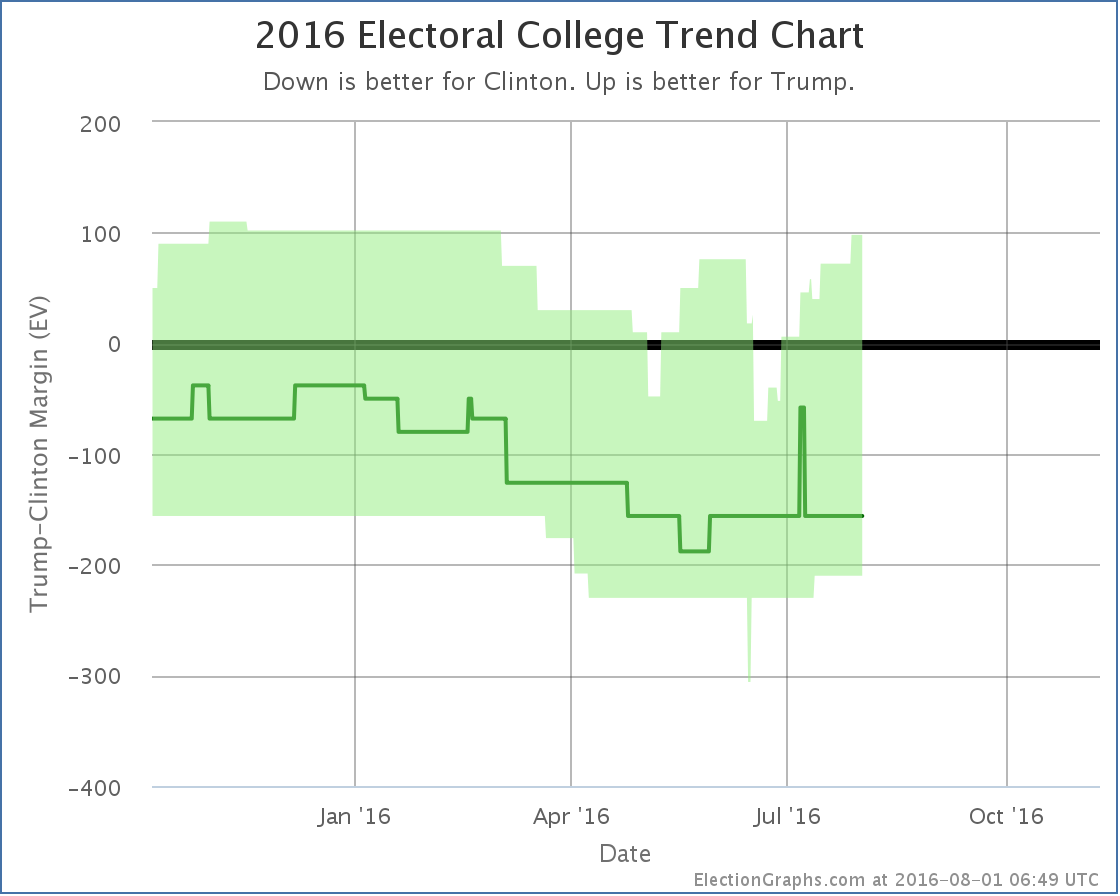
Compared to many other close states, Nevada has been sparsely polled. The latest poll actually has Clinton ahead, but by less than the poll it replaces in the average, so the average moves toward Trump… and crosses the center line! For the first time this election cycle, the Nevada poll average shows a Trump lead. A small 0.4% Trump lead, but a lead none the less. National Picture Between these two states, we have two changes in the national picture which can be seen on the national trend chart:
The upper right of the “bubble” shows a brief spike from Virginia moving into the close category yesterday, immediately followed by a drop due to the Pennsylvania change today. This looks like it might be a “top” and a start of a Trump decline in his “best case”, but as usual, use caution in making those sorts of determinations based on a single change. If more states move from Weak Clinton to Strong Clinton over the next few weeks, then that might be a valid conclusion. For now though it is premature. And of course we have Nevada moving in the opposite direction at the same time. Nevada is a small state, but moves in the “expected case” are rare compared to changes in Trump’s best case. There was a short spike in early July that lasted a grand total of two days, but other than that this is the first move of the actual expected result toward Trump since May. We’ll see if this time it lasts longer than two days. 98.2 days until polls start to close. Note: This post is an update based on the data on ElectionGraphs.com. Election Graphs tracks both a poll based estimate of the Electoral College and a numbers based look at the Delegate Races. All of the charts and graphs seen in this post are from that site. Additional graphs, charts and raw data can be found there. Follow @ElectionGraphs on Twitter or like Election Graphs on Facebook to see announcements of updates or to join the conversation. For those interested in individual general election poll updates, follow @ElecCollPolls on Twitter for all the polls as they are added. If you find the information in these posts interesting or useful, please consider visiting the tip jar.
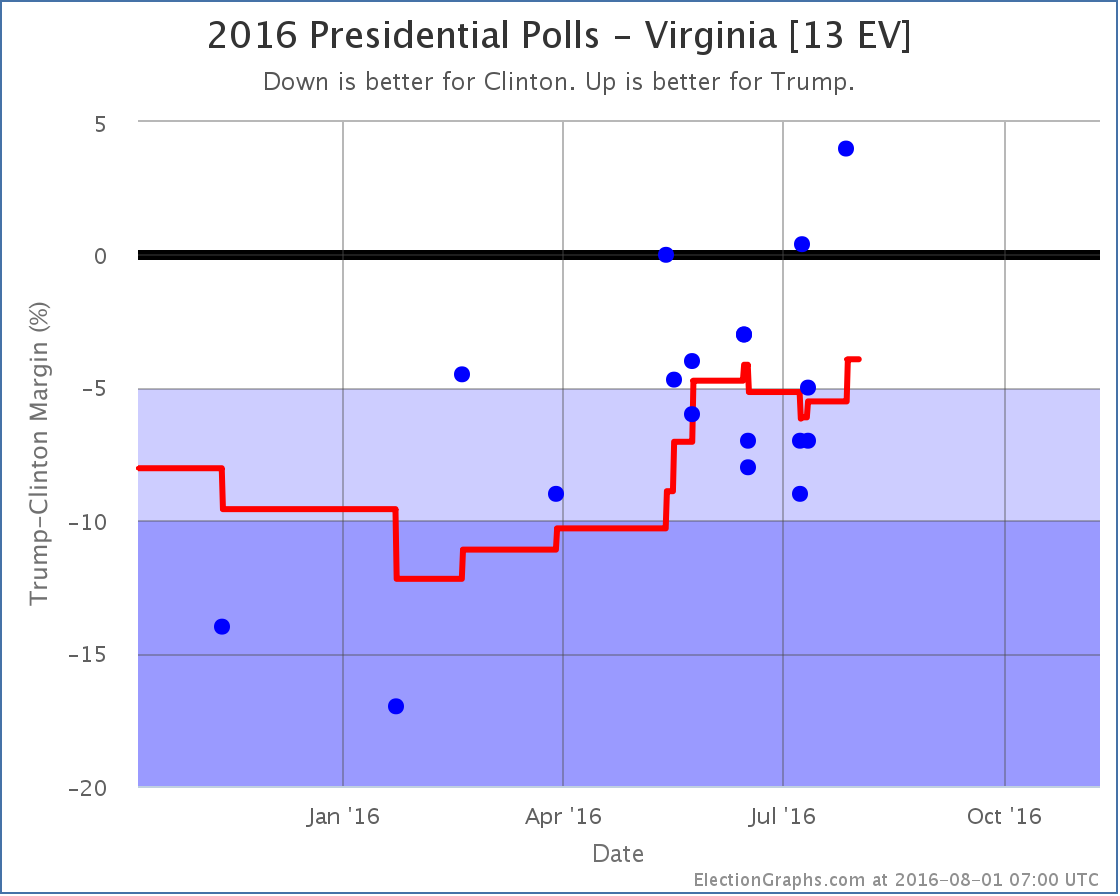
States with new poll data since the last update: Missouri, Arizona, Virginia, Oklahoma We’ve only had a couple of polls that were taken completely after both conventions, but one of them, a RABA poll in Virginia, actually makes a notable difference:
The RABA poll actually shows Trump ahead in Virginia by 4%. This is the best single result Trump has ever gotten against Clinton in Virginia, and is noticeably out of line with other recent results. This could be a real result of movement caused by the two conventions… or it could just be an outlier. In any case, we just throw it into the average with everything else for now, and Virginia moves from Clinton +5.5% to Clinton +3.9%. This is of course under 5%, so our categorization for Virginia changes from “Strong Clinton” to “Weak Clinton” and Virginia is now considered a possible Trump pick up in his “best case”:
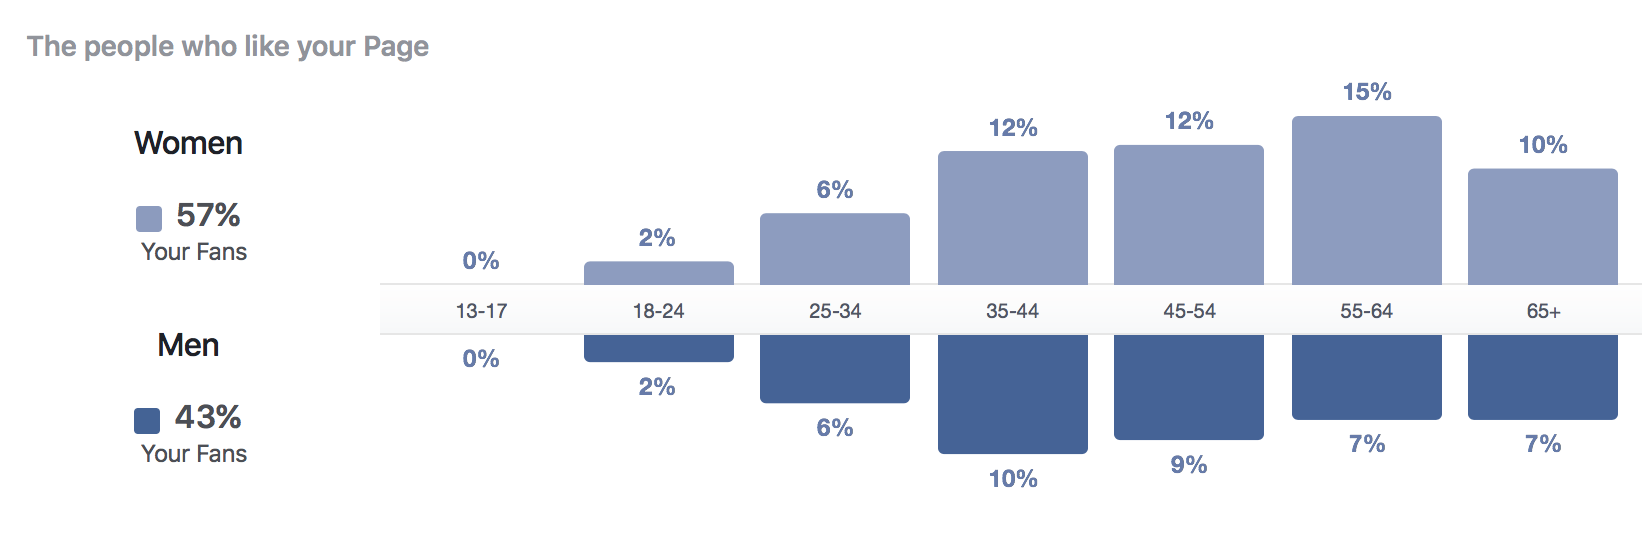
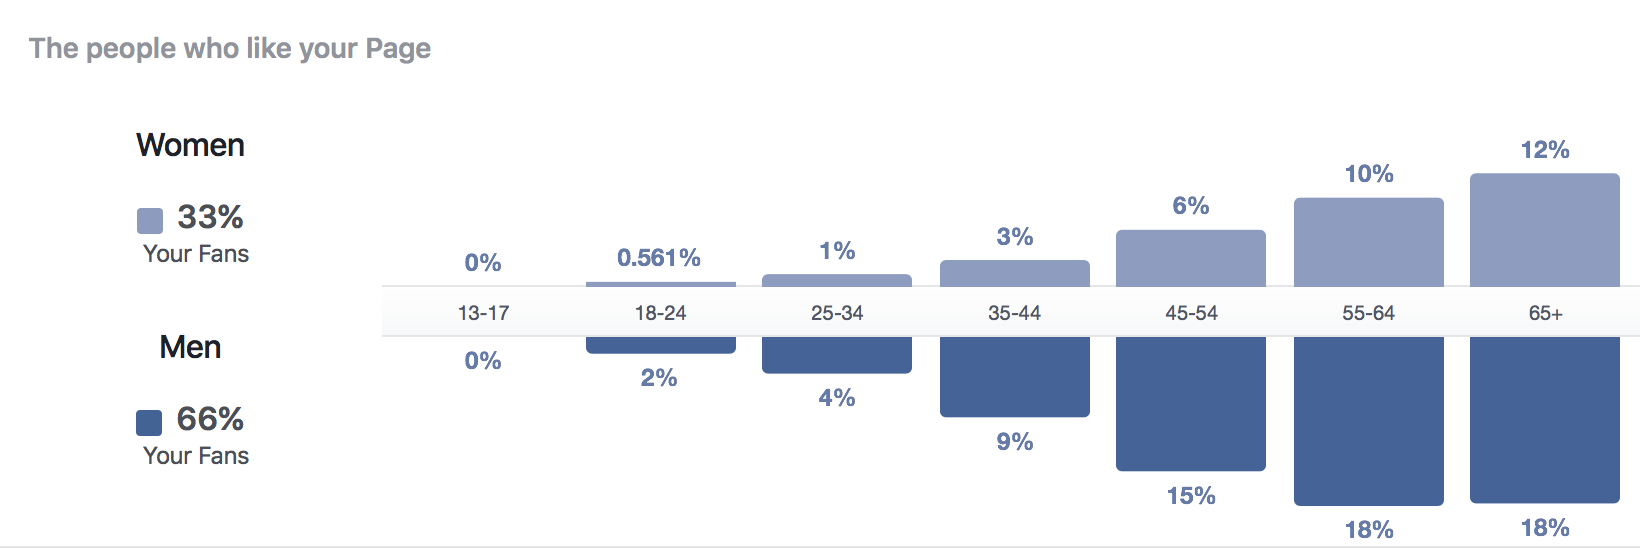
If Trump holds all the states he is ahead in, and then steals all the states where Clinton’s lead is less than 5%, we end up with Trump 318 to Clinton 220, a 98 electoral vote win for Trump. This is the best best case Trump has seen since early March. Trump is succeeding in making a lot of states close, but so far has not had much success in actually dragging them over the line to his side. The “expected case” remains stubbornly stuck at Clinton 347, Trump 191, a 156 electoral vote win for Clinton. We have now broken the 100 day barrier. 99.4 days left until the polls start to close on Election Day. Note: This post is an update based on the data on ElectionGraphs.com. Election Graphs tracks both a poll based estimate of the Electoral College and a numbers based look at the Delegate Races. All of the charts and graphs seen in this post are from that site. Additional graphs, charts and raw data can be found there. Follow @ElectionGraphs on Twitter or like Election Graphs on Facebook to see announcements of updates or to join the conversation. For those interested in individual general election poll updates, follow @ElecCollPolls on Twitter for all the polls as they are added. If you find the information in these posts interesting or useful, please consider visiting the tip jar. Presented without comment other than… “Interesting”. Demographics of those liking the Facebook pages for my podcast and my election tracker:
|
||