On this week’s Curmudgeon’s Corner, Sam and Ivan talk about the latest developments with Impeachment and Election 2020. But first, they talk a little about a few other things. Like the China trade deal, Carlos Ghosn, VR, and more! Plus, stay past the end, and listen to some bloopers.
Click below to listen and subscribe!
1-Click Subscribe in iTunes View Podcast in iTunes View Raw Podcast Feed Download MP3 File Follow the podcast on Facebook Support us on Patreon
Show Details:
Recorded 2020-01-18 Length this week – 2:12:33
(0:00:01-05:54) Cold Open
(0:06:18-0:36:46) Mini Lightning
(0:37:27-1:26:15) Impeachment
(1:27:24-2:03:45) Election 2020
(2:04:05-2:12:33) Bloopers
The Curmudgeon’s Corner theme music is generously provided by Ray Lynch.
On this week’s Curmudgeon’s Corner, Sam and Ivan talk about a phishing link Sam clicked on, the Bezos blackmail attempt, the Virginia mess, and the latest Trump stuff. They also do a run down of the Democratic field for the 2020 Presidential race. Oh, and they have news about a Seattle meetup, and more!
Click below to listen and subscribe!
1-Click Subscribe in iTunes View Podcast in iTunes View Raw Podcast Feed Download MP3 File Follow the podcast on Facebook Support us on Patreon
Show Details:
Recorded 2019-02-08 Length this week – 2:32:23
(0:00:20-0:08:56) But First
Agenda
Bruce predictions
Seattle Meetup being planned
(0:11:09-1:21:12) Potpourri
Sam Clicked a phishing link
Bezos Blackmail
Virginia Mess
(1:21:53-1:49:09) Trump
Executive time
SOTU
SDNY Investigating Trump inaugural
New House investigations
(1:50:29-2:32:03) Democratic candidate roundup
The whole field
Joe Biden
Bernie Sanders
Beto O’Rourke
Kamala Harris
Elizabeth Warren
Cory Booker
The others
The Curmudgeon’s Corner theme music is generously provided by Ray Lynch.
This week on Curmudgeon’s Corner, Sam and Ivan do eventually talk politics… namely Donna Brazile, this week’s election results, and the accusations against Roy Moore… but first they talk about some more pedestrian things. Ivan has ants! Sam and his wife have issues with iPhones! Sam and his family have an adventurous vacation! So a lot of everything this week. Enjoy!
Click below to listen and subscribe!
1-Click Subscribe in iTunes View Podcast in iTunes View Raw Podcast Feed Download MP3 File Follow the podcast on Facebook Support us on Patreon
Show Details:
Recorded 2017-11-10
Length this week – 1:51:07
(0:00:15-0:03:25) Intro
(0:04:34-0:11:44) Ivan’s Ants
(0:12:59-0:29:58) iPhone Travails
(0:30:43-0:44:13) Sam’s Trip
(0:45:55-1:02:42) Donna Brazile Book
(1:03:22-1:27:57) Election 2017
(1:29:33-1:50:46) Ray Moore
The Curmudgeon’s Corner theme music is generously provided by Ray Lynch.
States with new poll data added since the last update: All 50 states and DC.
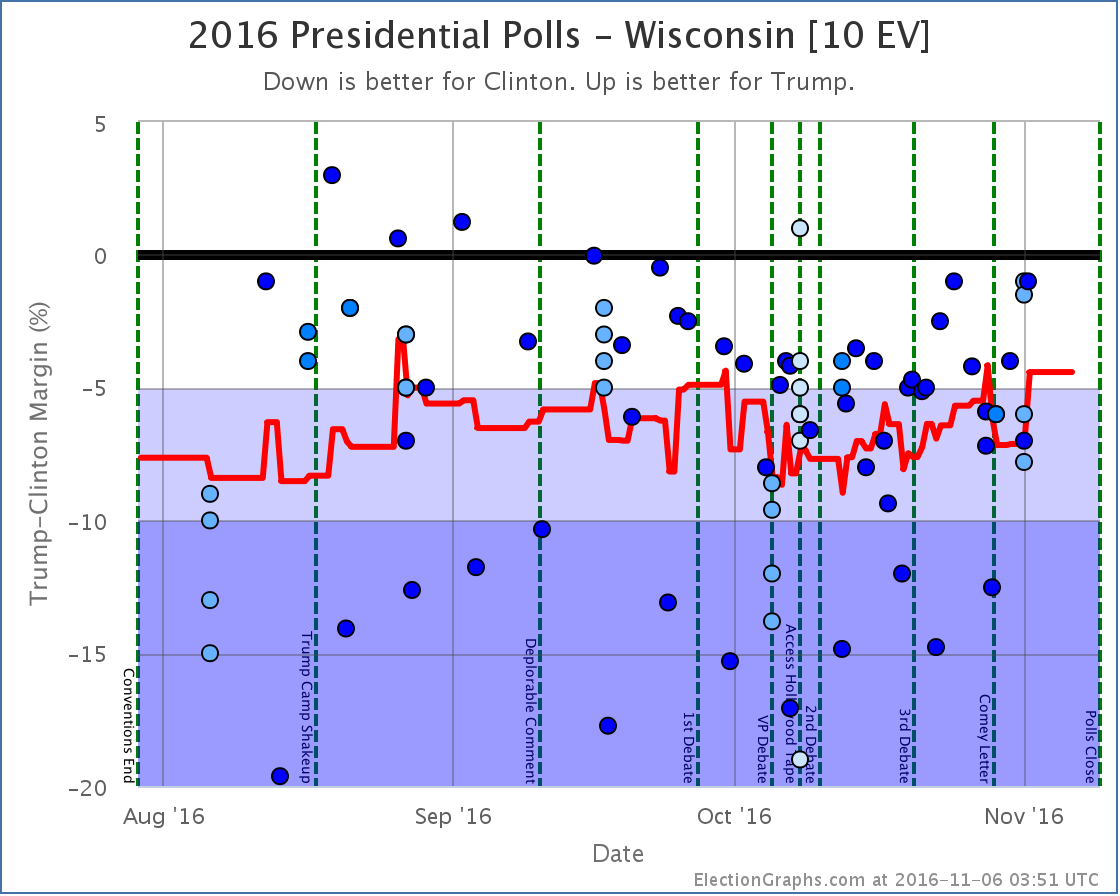
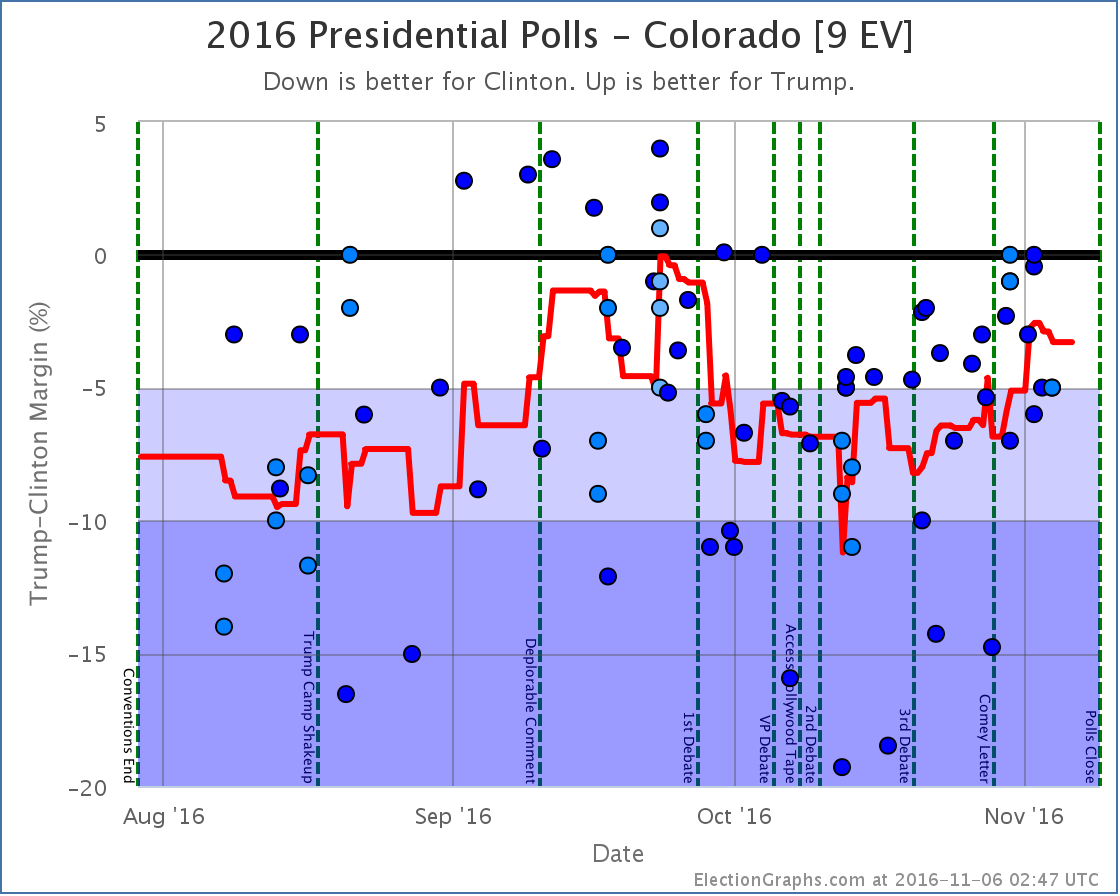
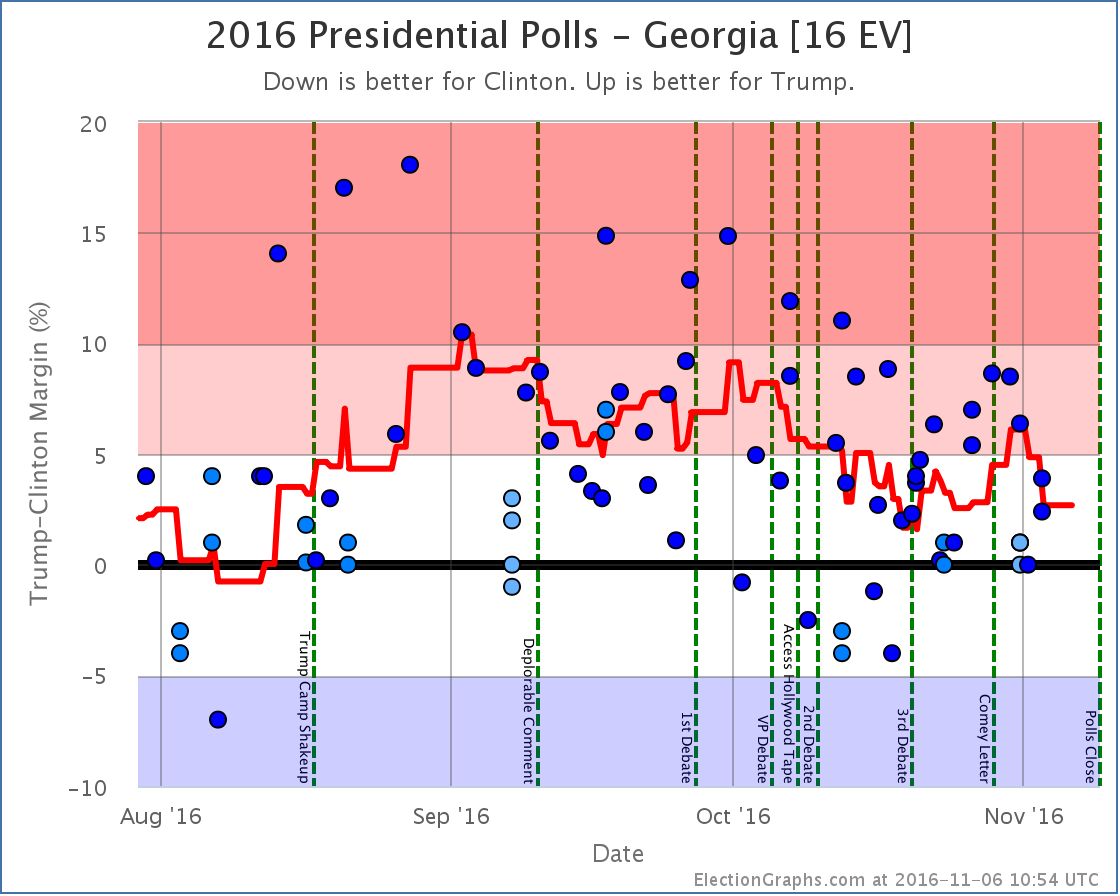
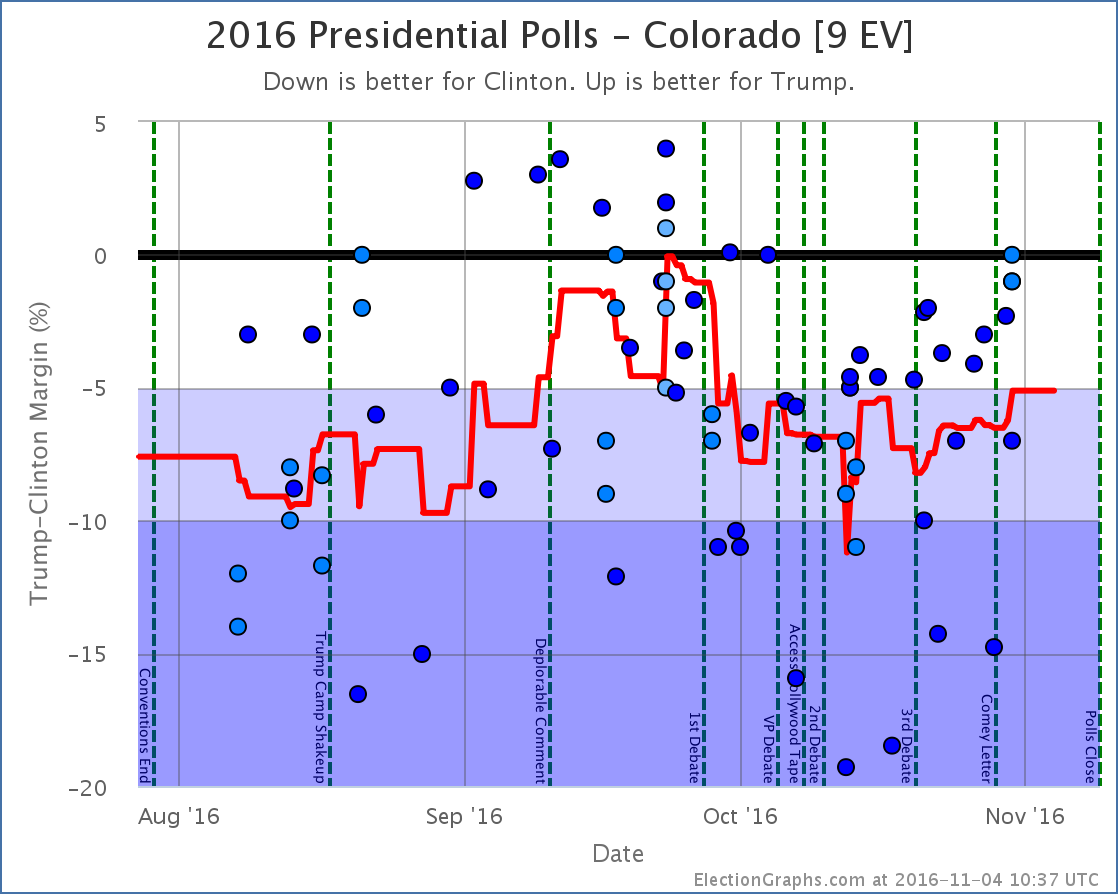
Notable changes in: Florida (29), Georgia (16), North Carolina (15), Virginia (13), Wisconsin (10), Colorado (9), Iowa (6), and the tipping point.
National Summary
It has been about two days since the last update. Since then the changes have been mixed, indicating that perhaps the recent movement toward Trump has topped out.
Good for Trump
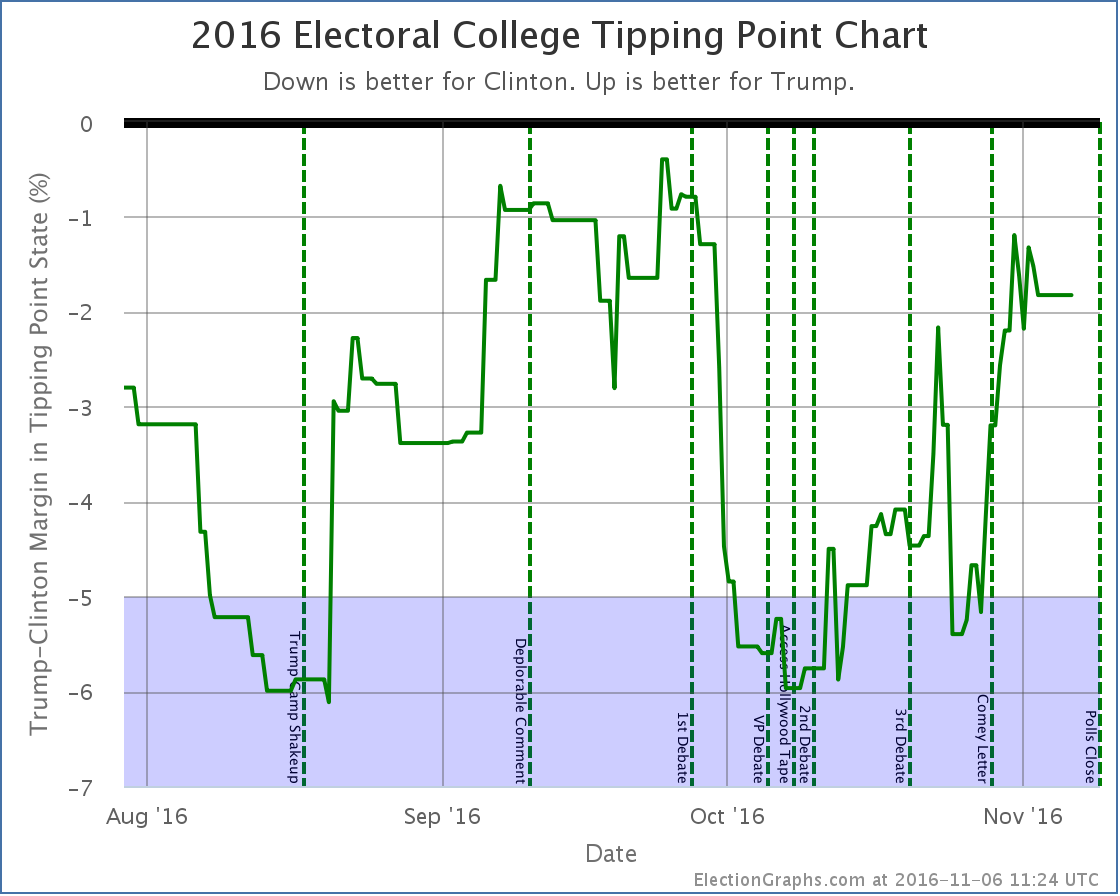
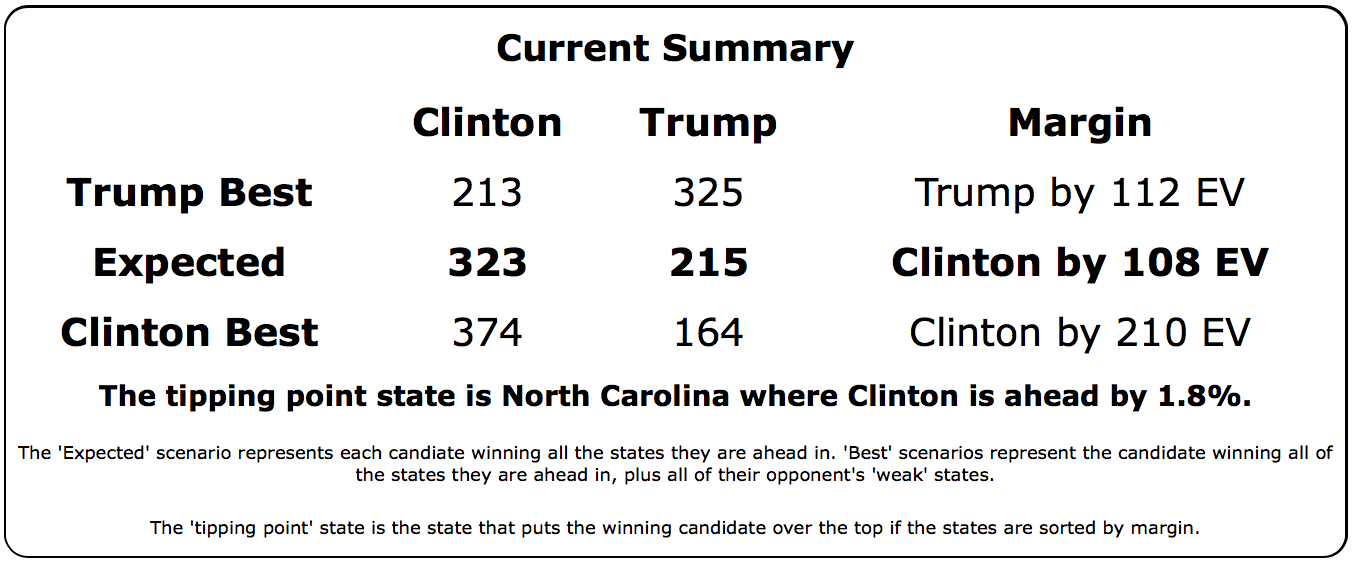
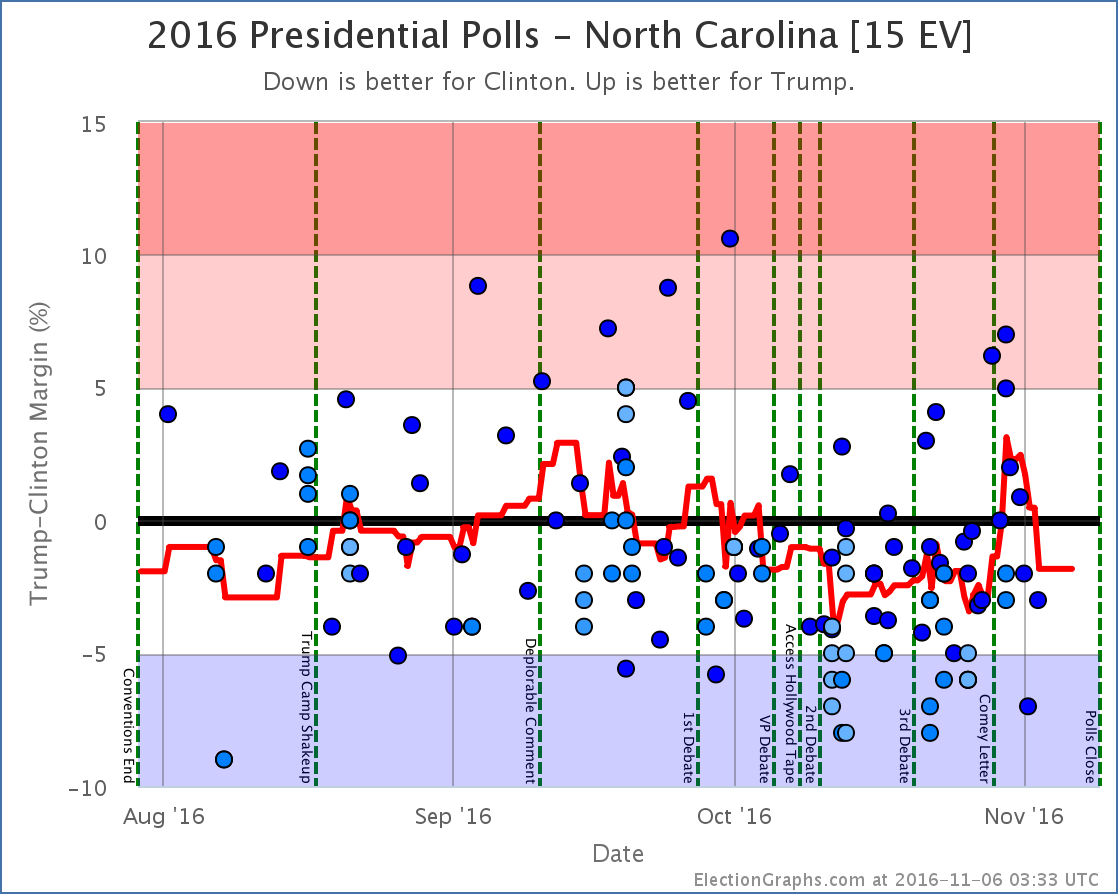
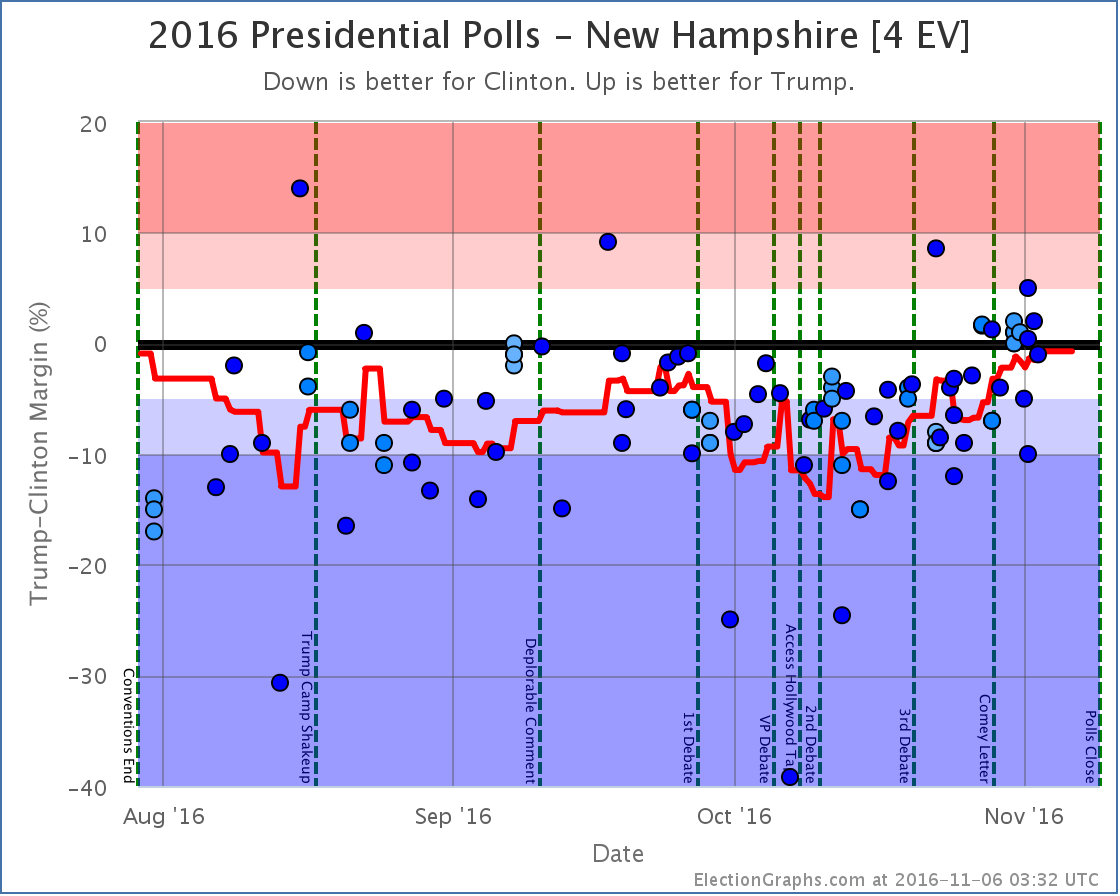
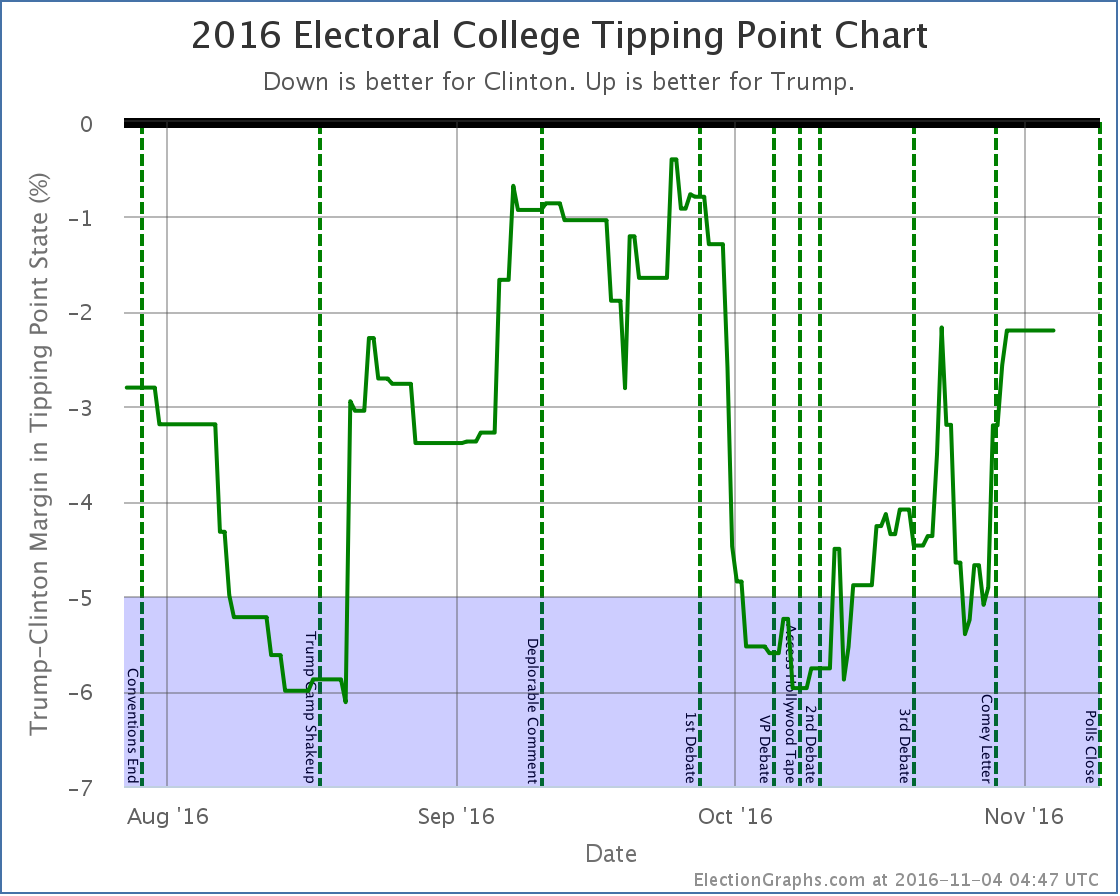
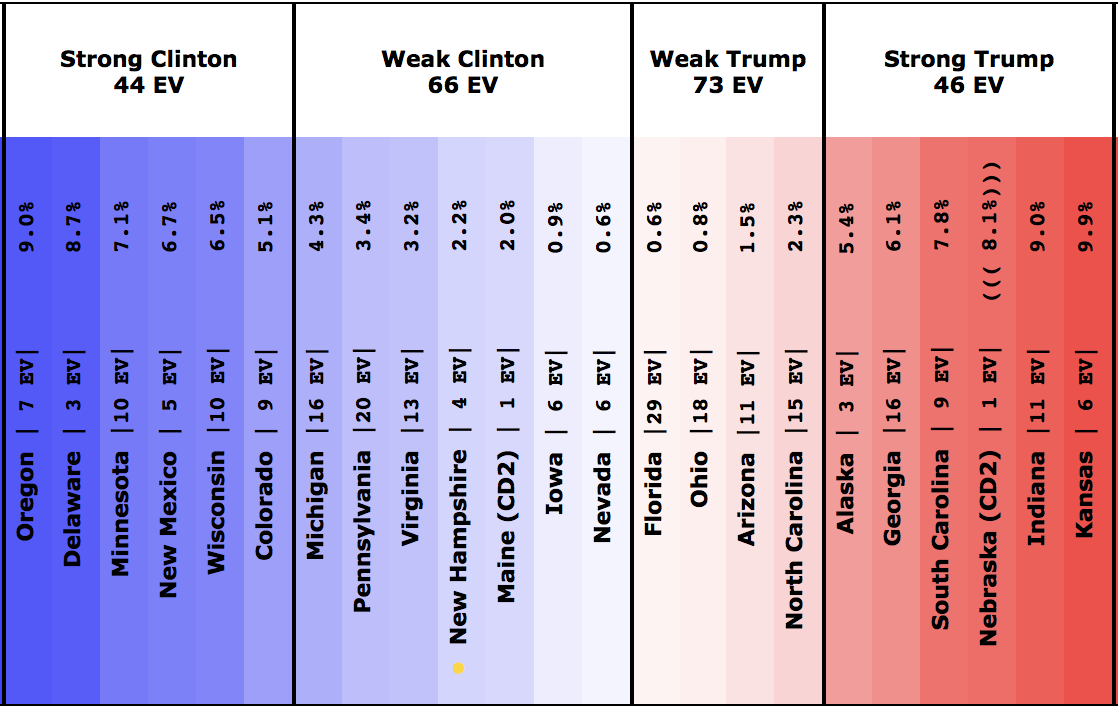
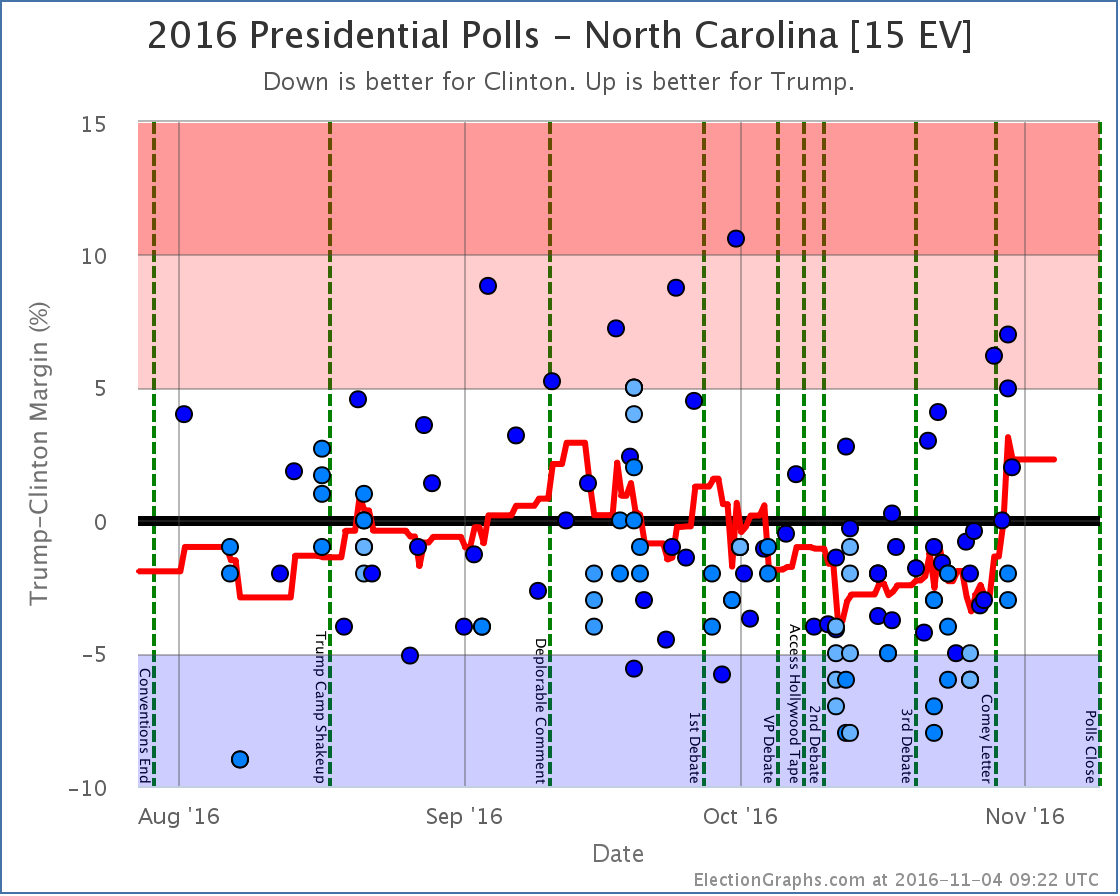
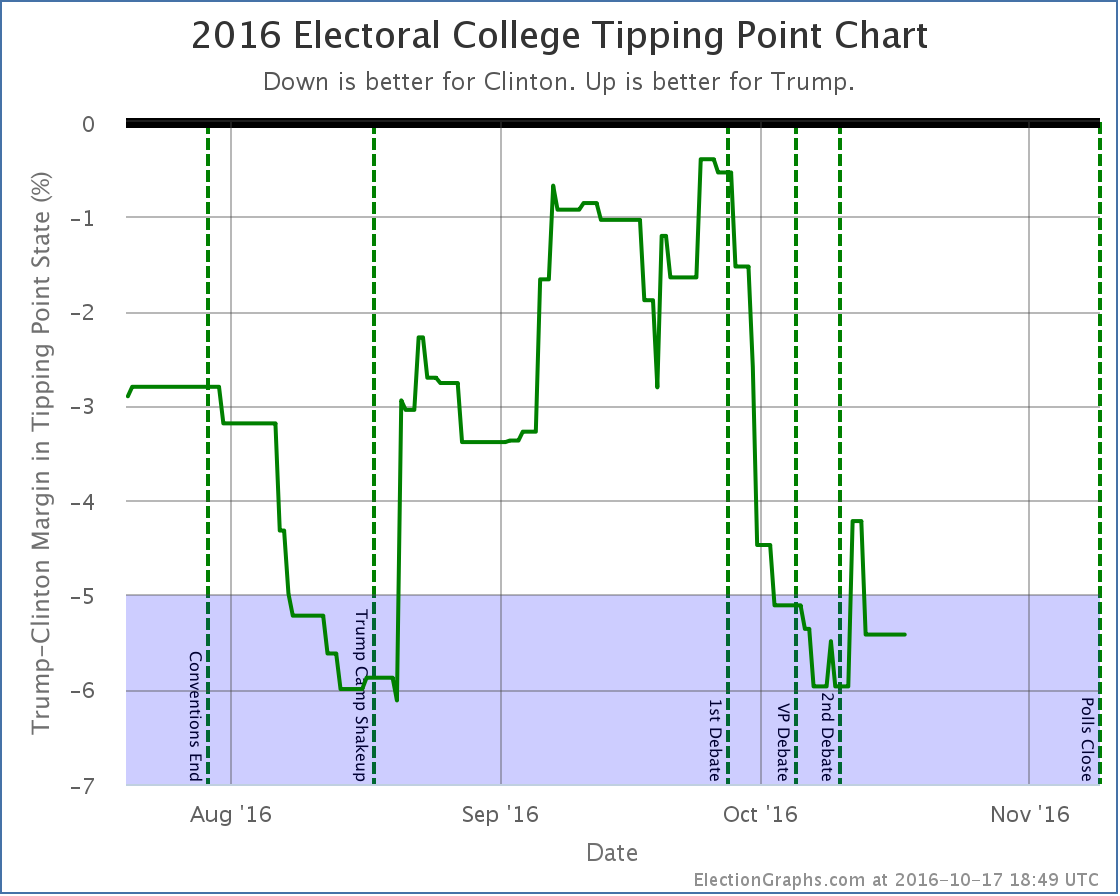
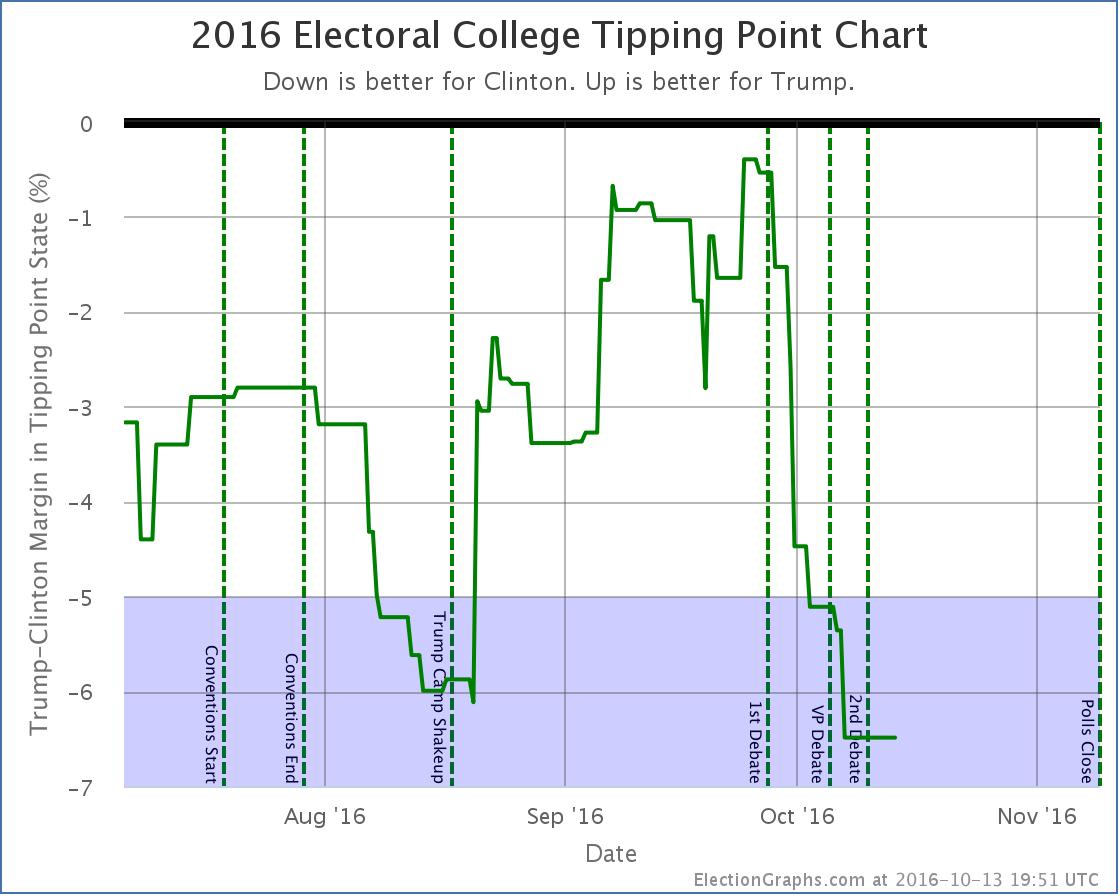
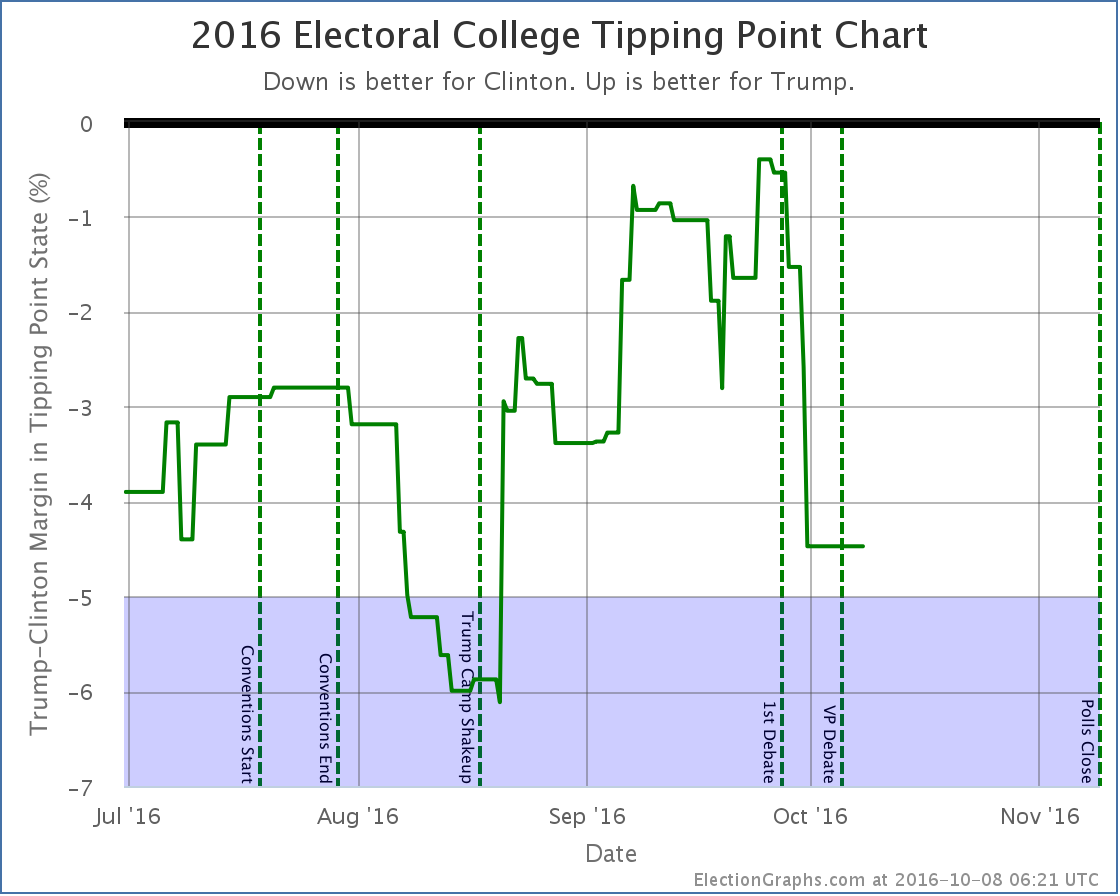
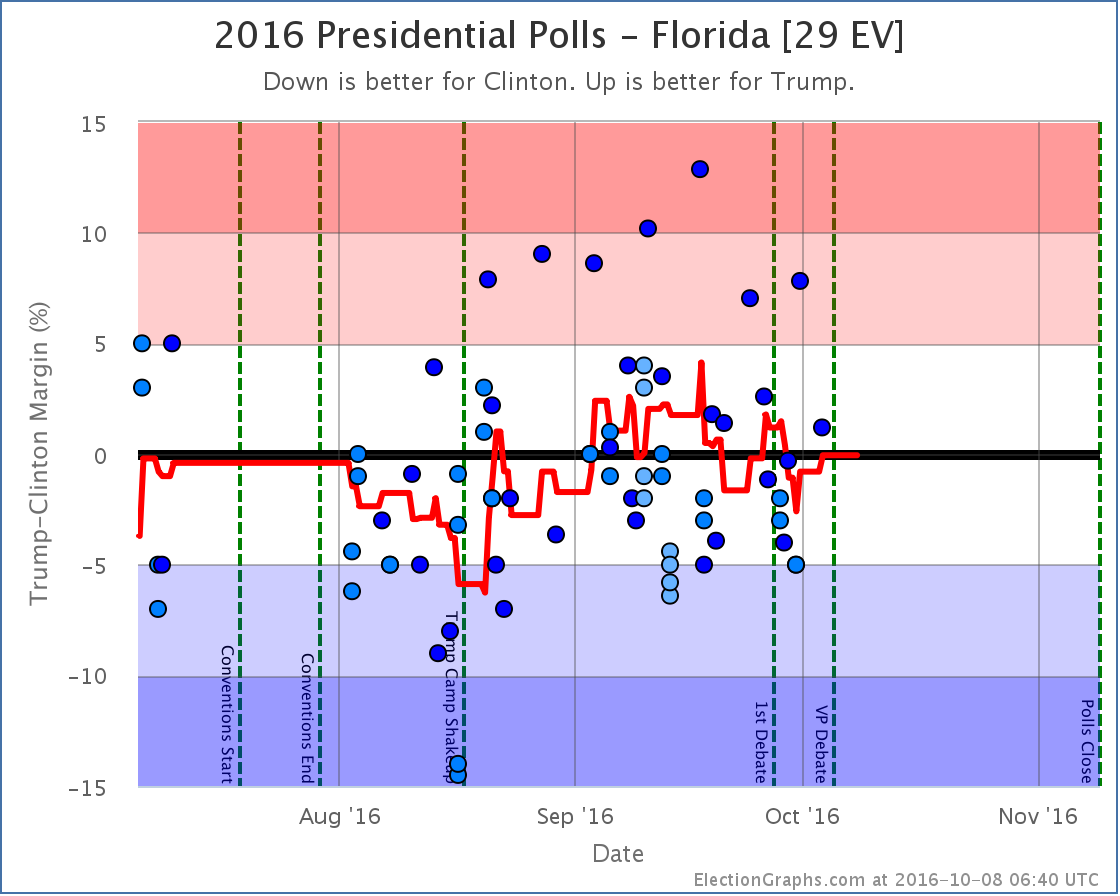
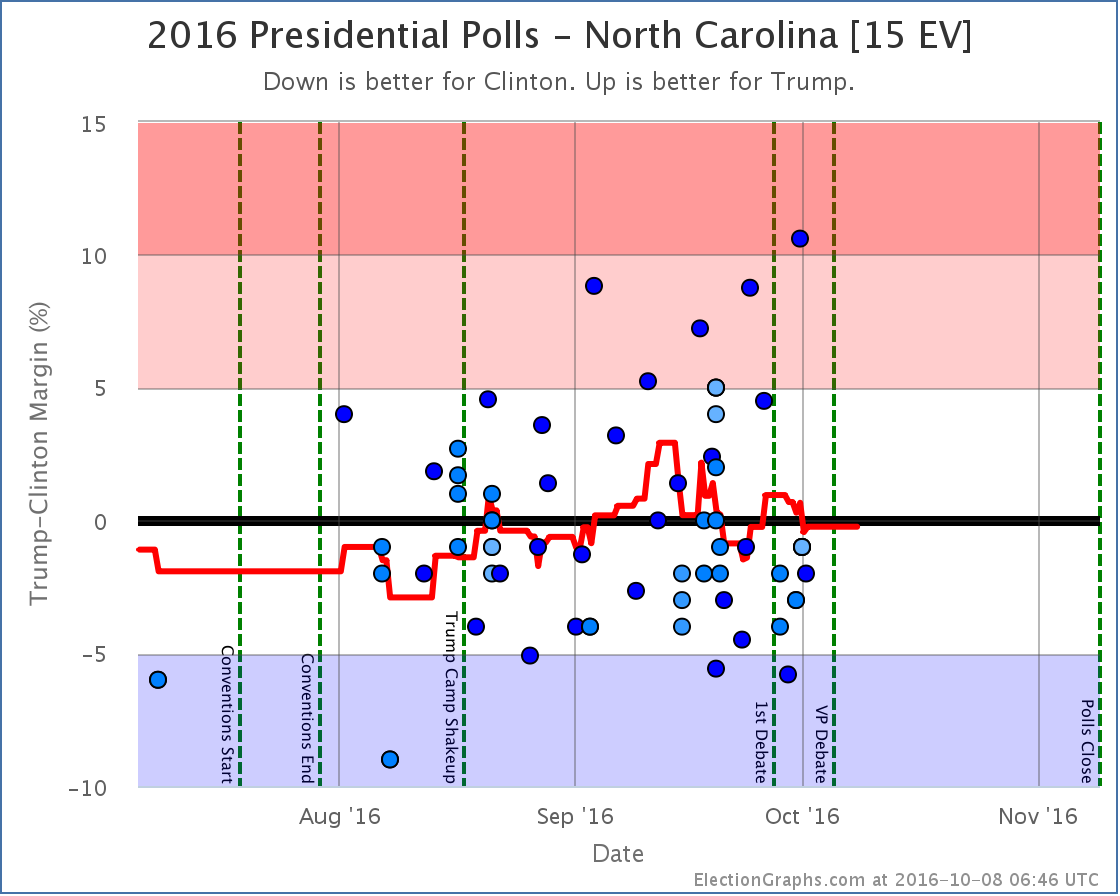
The tipping point moves from Clinton by 2.2% in NH to Clinton by 1.8% in NC
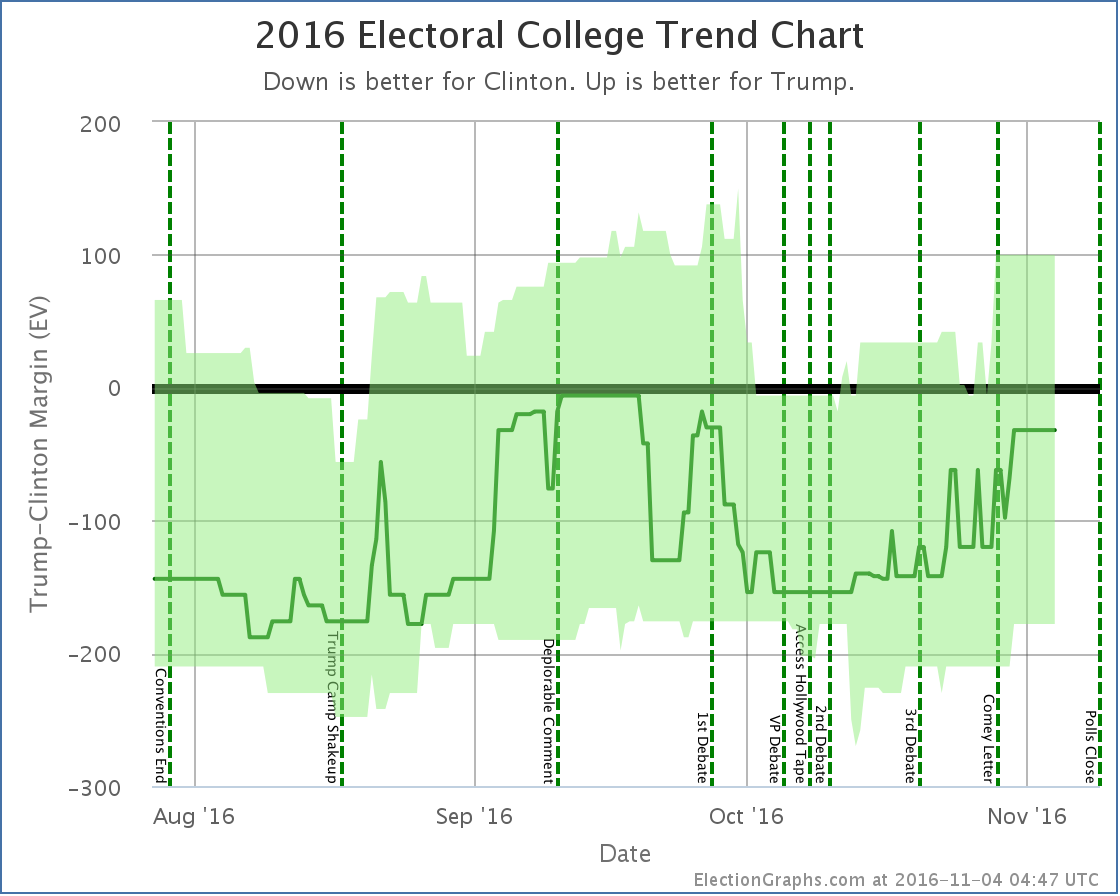
Trump’s best case has improved from a 100 EV win to a 112 EV win
Good for Clinton
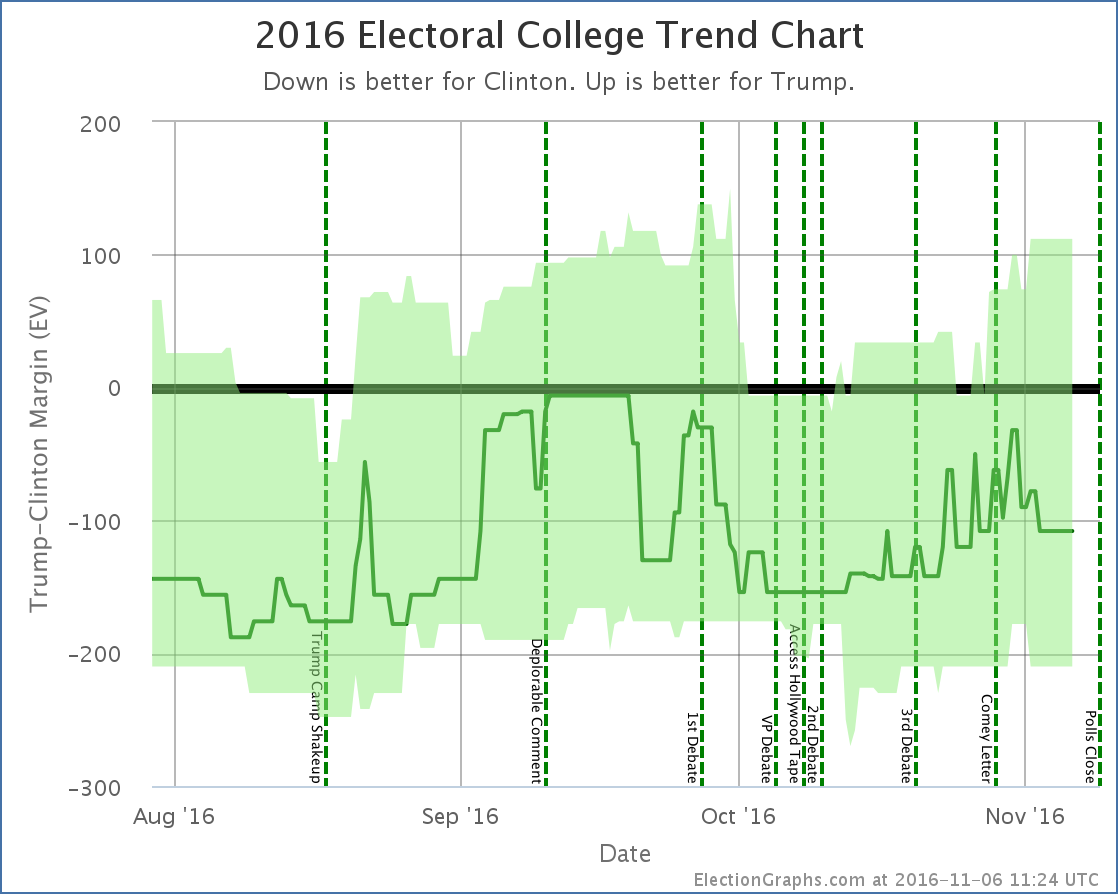
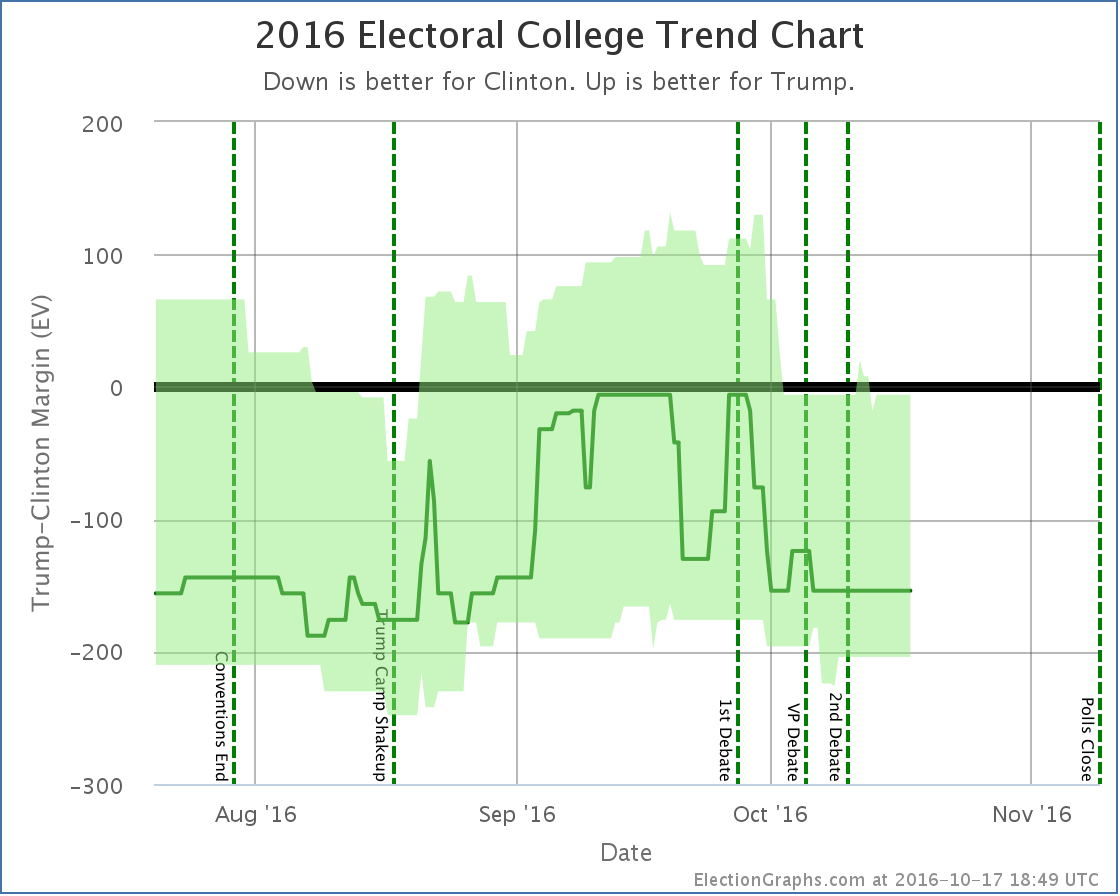
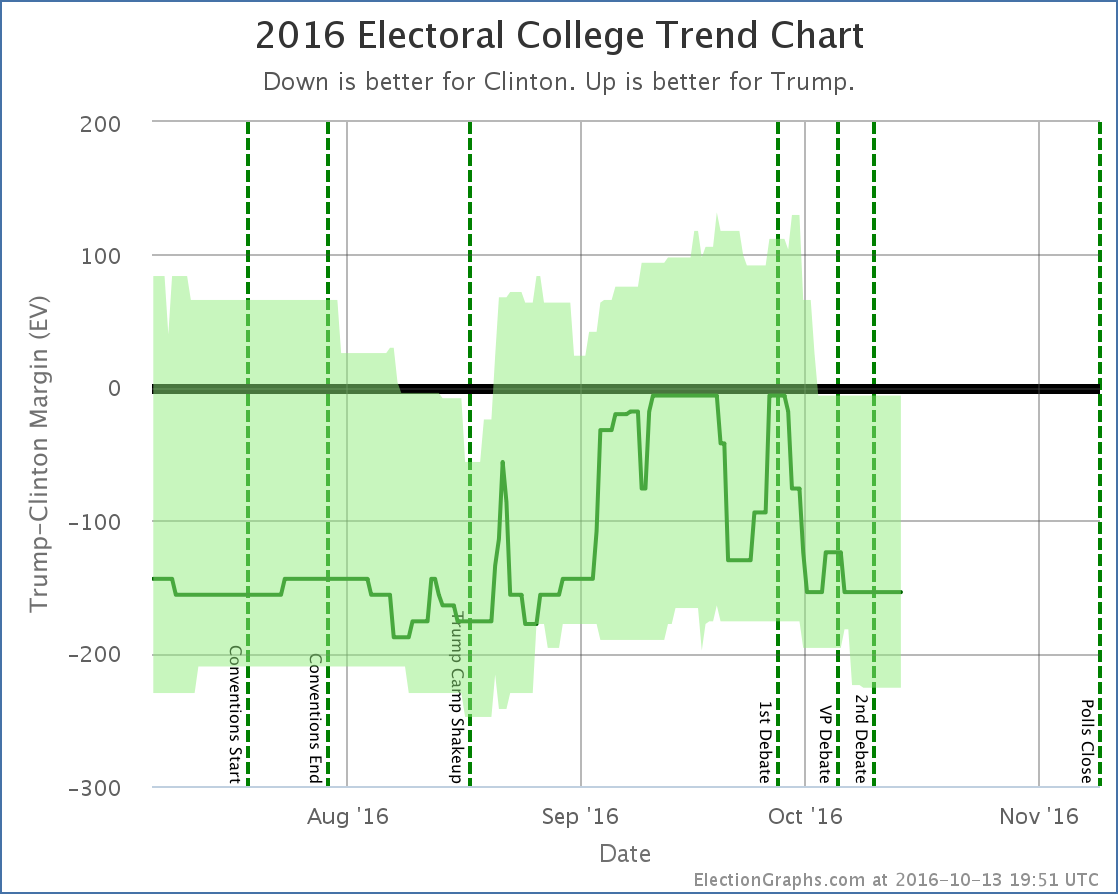
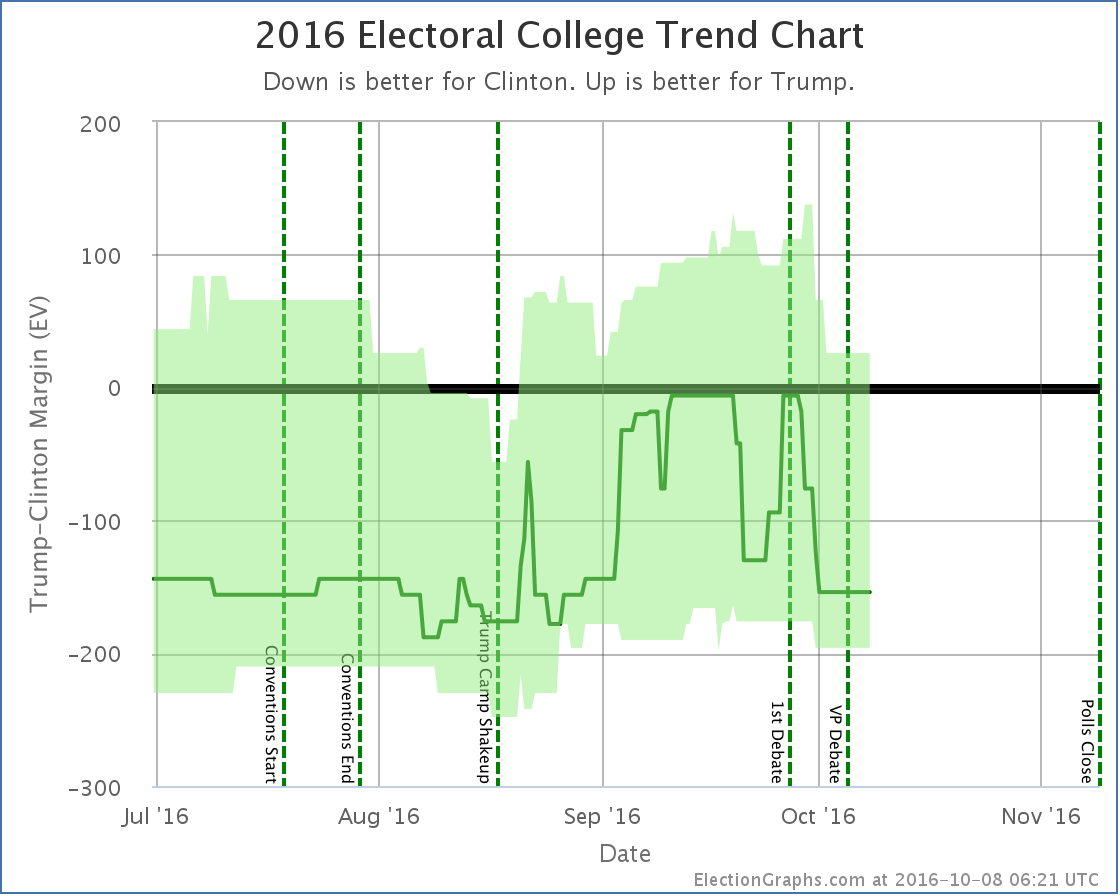
The expected case moves from Clinton winning by 32 EV to Clinton winning by 108 EV
Clinton’s best case moves from a 178 EV win to a 210 EV win
Charts
Discussion
While we have some indicators moving in each direction, the two to pay attention to are the expected electoral college result and the tipping point. The two “best case” scenarios give all states with a margin under 5% to one candidate or another. Those are both highly unlikely scenarios less than three days out from polls closing.
Even those two indicators are mixed though. If you had to decide who is favored in this update, you would still pick Trump though. Even though his expected electoral total has gone down, the tipping point moves a bit in his favor, meaning that the amount he has to move polls in order to win has lessened.
So while he is losing by more, the amount of effort to change that has still decreased.
The one caveat there is that while the tipping point has improved since my last update, looking at the actual trend line it seems to be down from a recent peak.
If you put all these mixed messages together, it looks like the recent “Trump Surge” may have reached a high water mark… or at least a pause.
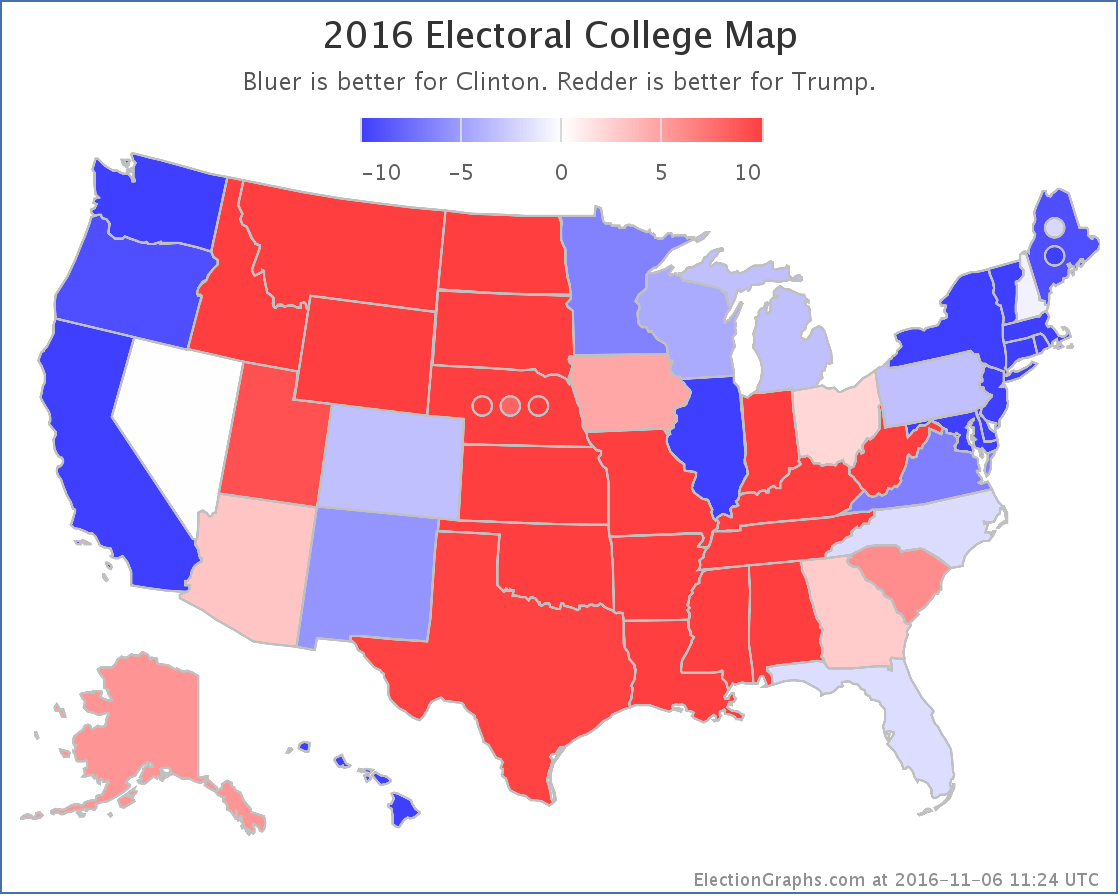
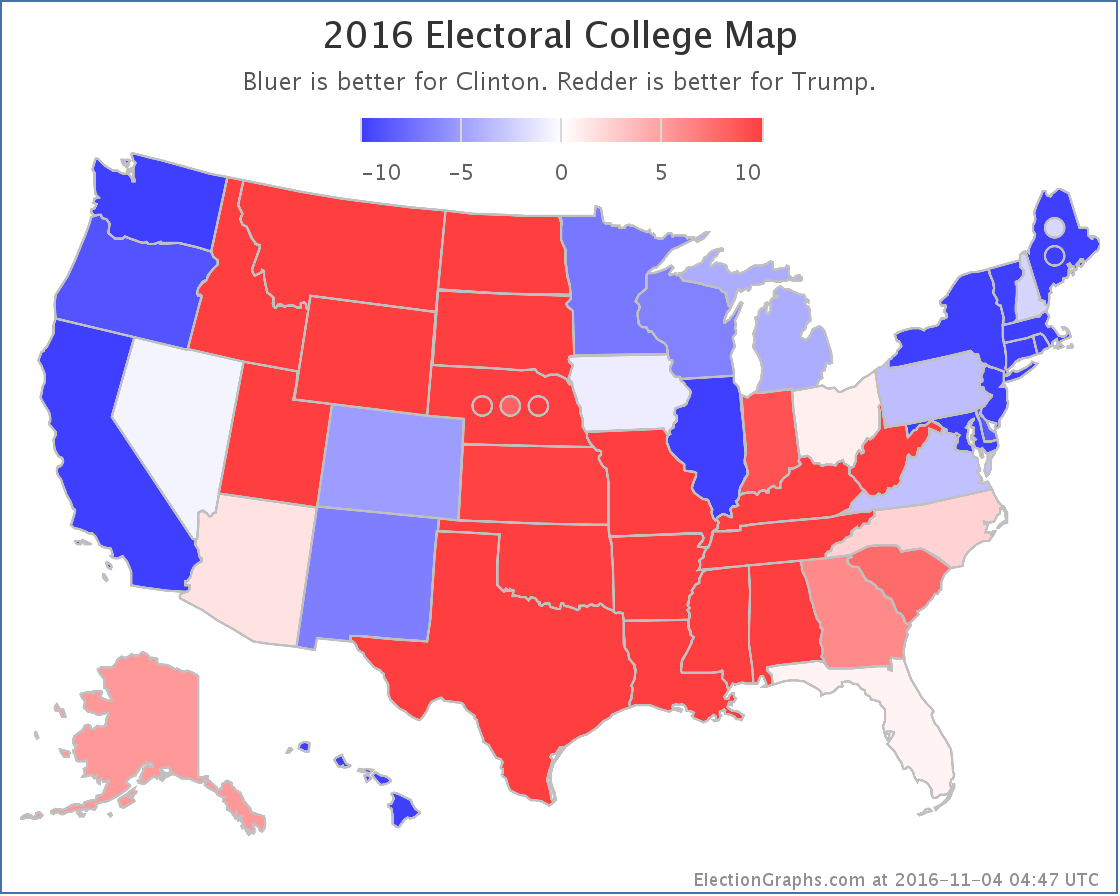
At these levels Clinton is of course still winning. The electoral result according to the current averages would be Clinton 323 to Trump 215, a 108 electoral vote win for Clinton. Trump does better than Romney did here, but still loses.
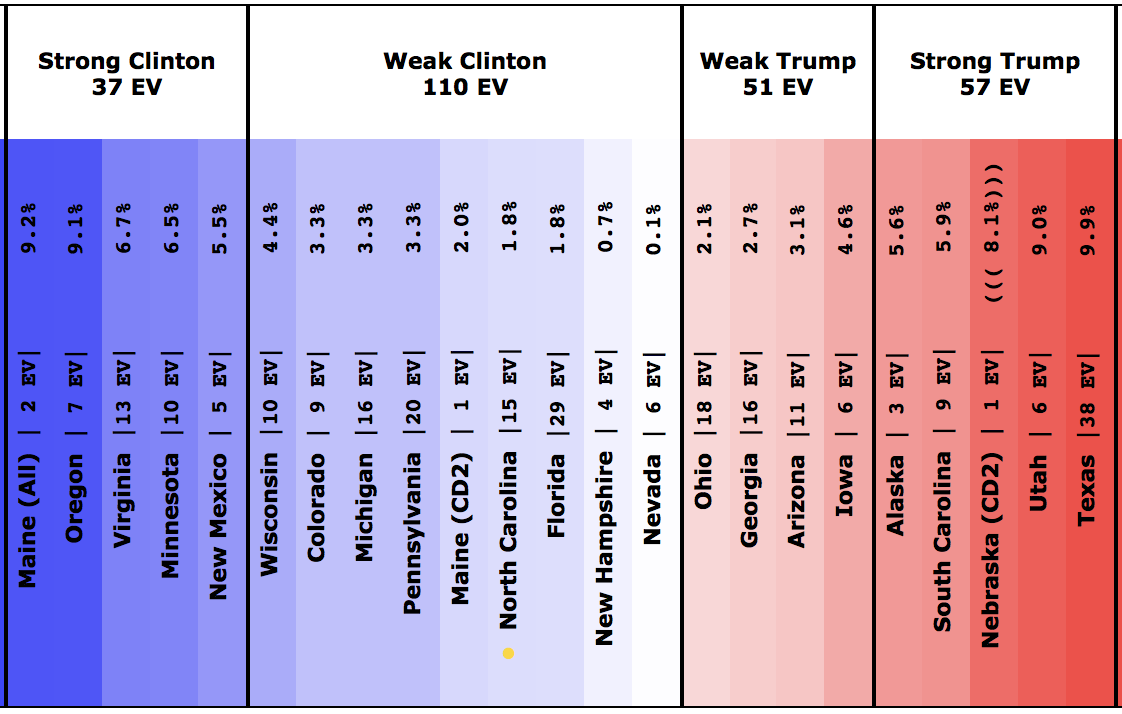
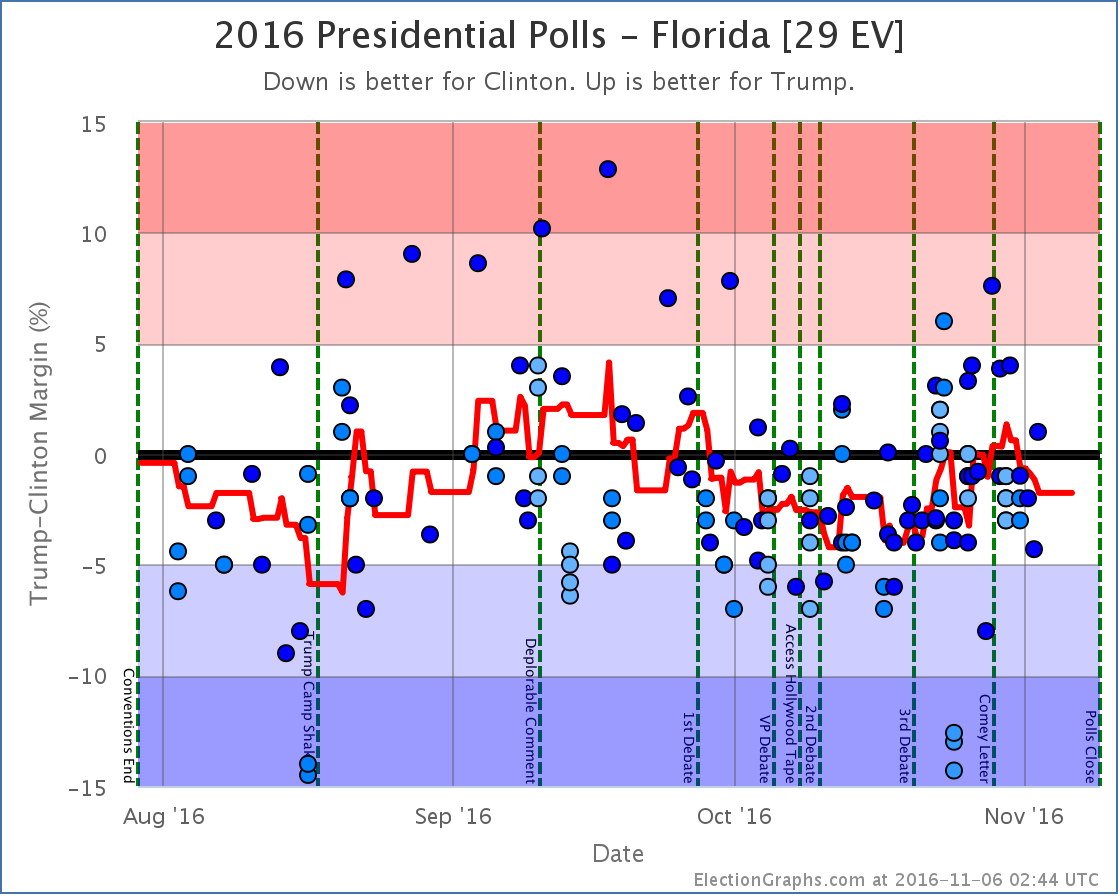
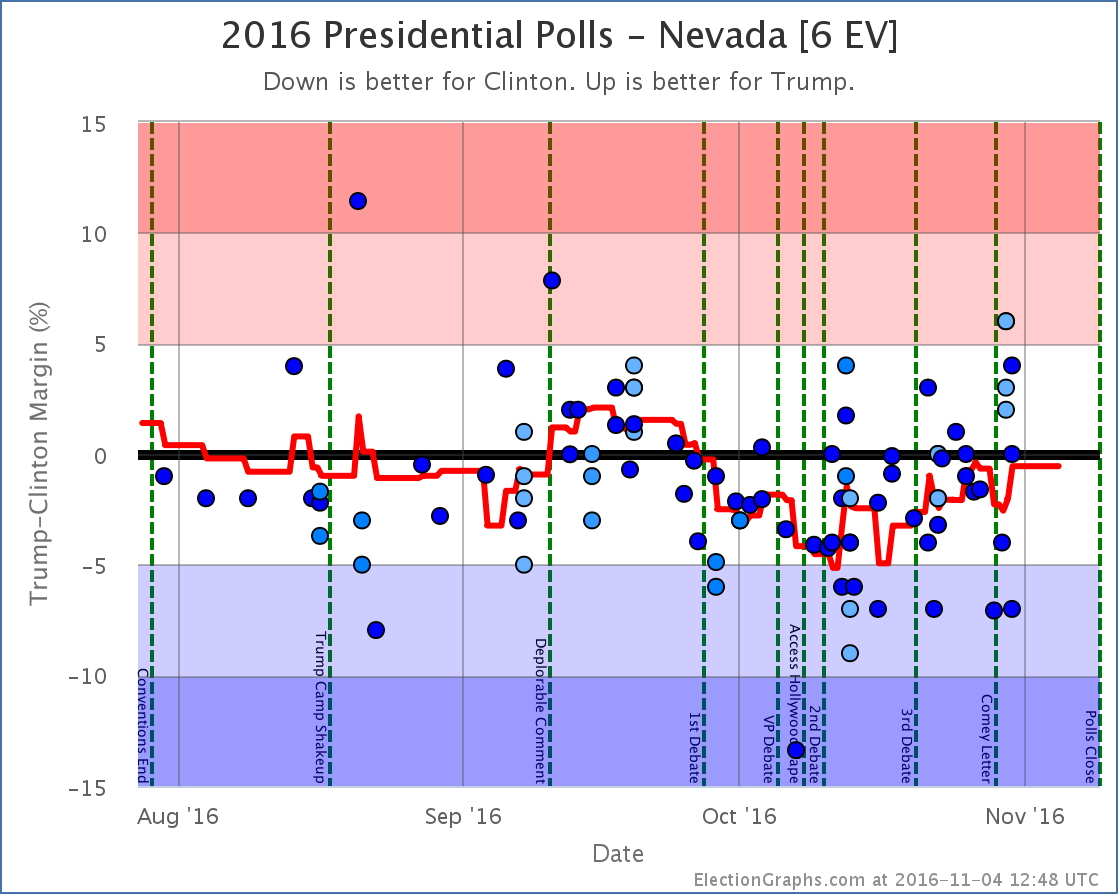
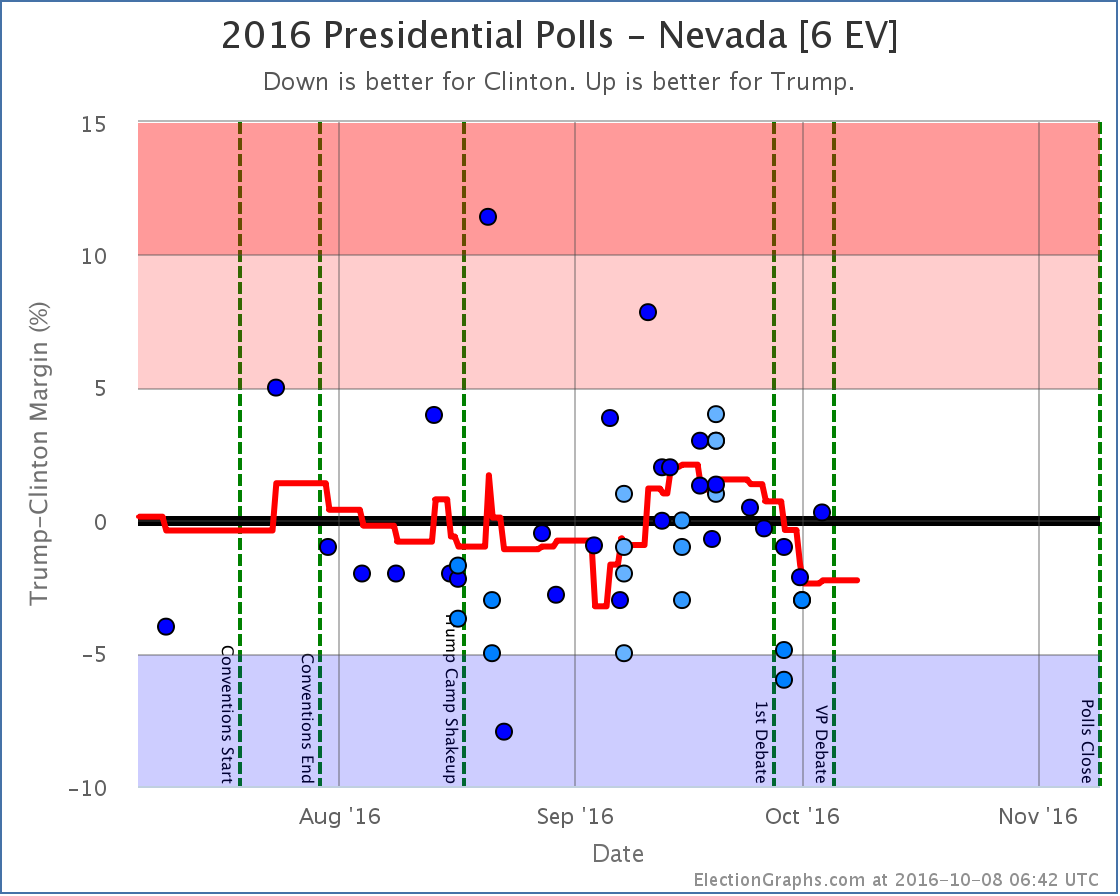
Trump still has ways to win though. The easiest way right now would be for him to pull in Nevada (0.1% Clinton lead), New Hampshire (0.7% Clinton lead), Florida (1.8% Clinton lead), and North Carolina (1.8% Clinton lead). That would get him to a 269-269 tie and throw the election into the House of Representatives, where he would probably win. To win outright, he would need to also pull in Maine’s 2nd congressional district, where Clinton is currently leading by 2.0% in the Election Graphs average.
Moving things by 2% doesn’t seem that big a move in the grand scheme of things, but given the history of the race in terms of what seem to be the candidate’s floors and ceilings, as well as reports of early voting trends in some of those states (specifically Nevada and Florida), moving those states that last little bit is harder than it may seem just looking at the percentages. If anything, the preliminary early voting data seems to indicate Clinton may end up over-performing the polling, not the other way around.
Just to check in with the sites that give odds (which we do not), the chances of a Trump win given all the current information:
The median of these 8 estimates is 12%. That seems reasonable and in line with what I would expect from the Election Graphs numbers and the small amount of time left before the election is over.
2.5 days until polls start to close. We are almost there.
State Details
The following are the detailed charts for all the states that influenced the national changes outlined above.
Moving from Trump to Clinton
Moving from Clinton to Trump
Now possible Trump pickups
Now possible Clinton pickups
No longer possible Trump pickups
Other states that helped move the tipping point
A note about faithless electors
In the past few days there have been reports of first one, then two, expected electors from Washington state saying that that have decided to or are considering being “faithless electors” by voting for someone other than who they are “supposed to” when the Electoral College votes in December.
Yes, they can do that. In Washington state there would be a $1000 fine if they did, but they can do it, and it would count.
There was also one other potential elector from Georgia who suggested they would be faithless back in August. That potential elector came under extreme pressure and resigned, to be replaced by someone who would presumably vote the “right” way.
That might well happen to these two as well. But faithless electors can and do happen every few election cycles. In the last 50 years there were faithless electors in 2004, 2000, 1988, 1976, 1972, and 1968. That is 6 out of 12 elections during that period. Half. It would not be surprising if there were one or more faithless electors in 2016, especially given the contentious nature of the race. They have never made a difference in the final outcome.
The Election Graphs estimates show what the results “should be” given who wins various states. They do not take into account statements by individual electors on their intentions. If a scenario arises where it is close enough for electors who have made statements like this to potentially make a difference in the outcome or throw the race to the House, we will of course make note of that. And once electors vote in December, we will show the final tallies, including any votes cast by faithless electors.
A note about McMullin
Right now the Real Clear Politics average in Utah has McMullin 12.4% behind the lead. The 538 average in Utah has him 10.3% behind the lead. Although McMullin was a lot closer than anyone expected, he never got closer than 5% to the lead in Utah in these averages and now appears to be fading. 538 still has him in second place, but it doesn’t seem likely at this point that he will win electoral votes.
If that changes, I will of course note it in these updates and on the Election Graphs site.
For more information…
This post is an update based on the data on ElectionGraphs.com. Election Graphs tracks a state poll based estimate of the Electoral College. All of the charts and graphs seen in this post are from that site. Additional graphs, charts and raw data can be found there. Follow @ElectionGraphs on Twitter or like Election Graphs on Facebook to see announcements of updates or to join the conversation. For those interested in individual general election poll updates, follow @ElecCollPolls on Twitter for all the polls as they are added. If you find the information in these posts interesting or useful, please consider visiting the tip jar.
Edit 13:56 UTC to add an additional paragraph break.
States with new poll data added since the last update: All 50 states, DC, the Maine congressional districts, and the 2nd congressional district in Nebraska.
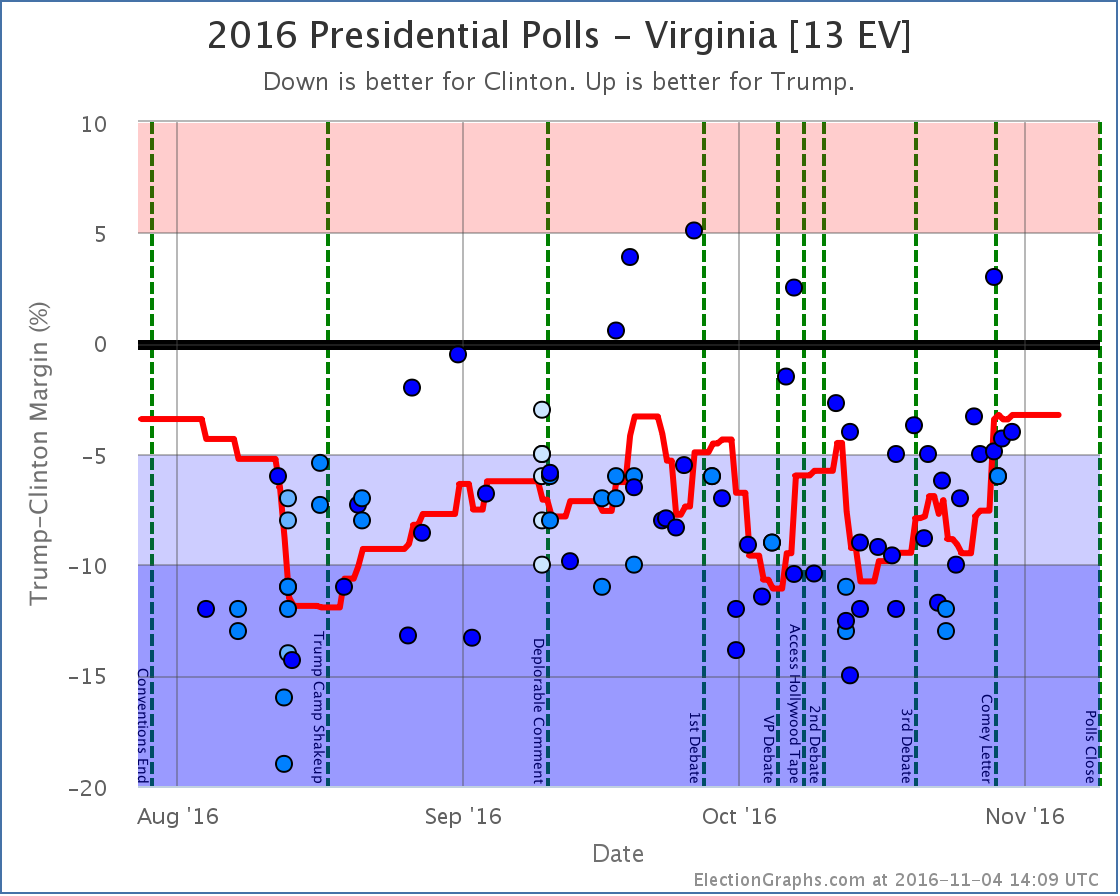
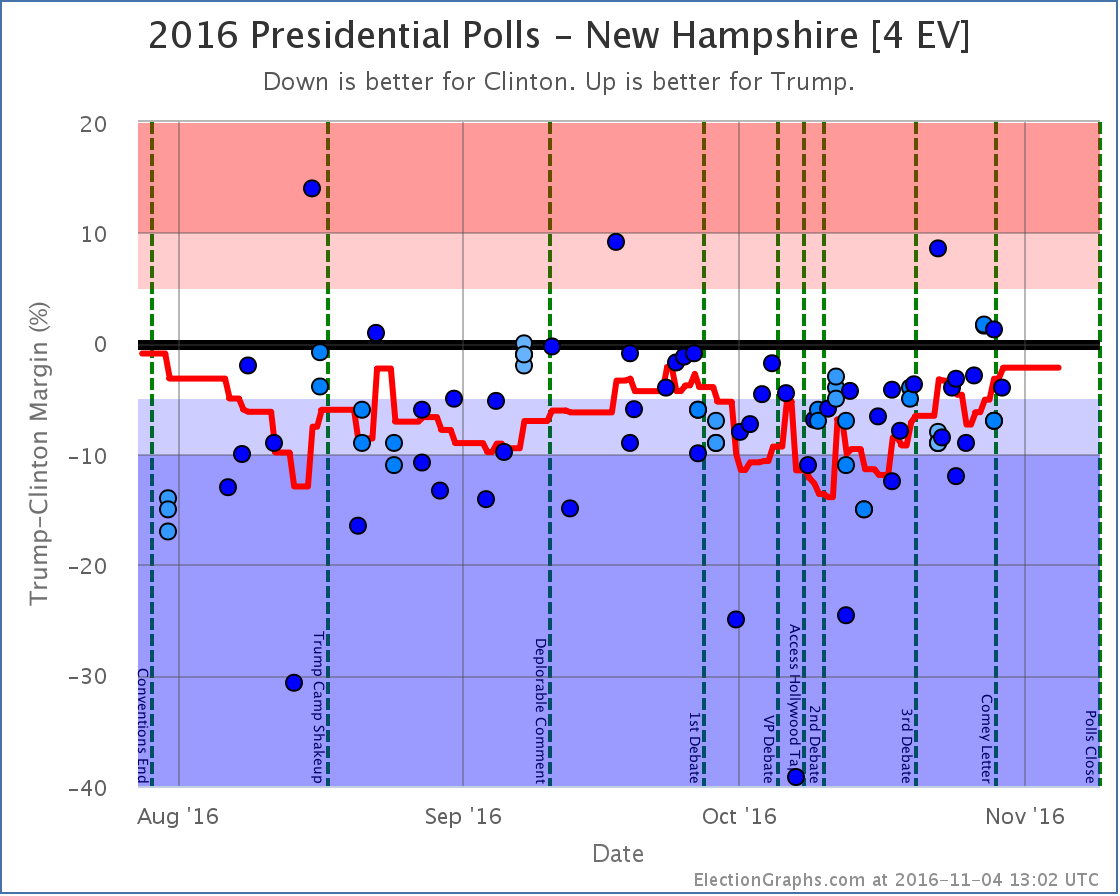
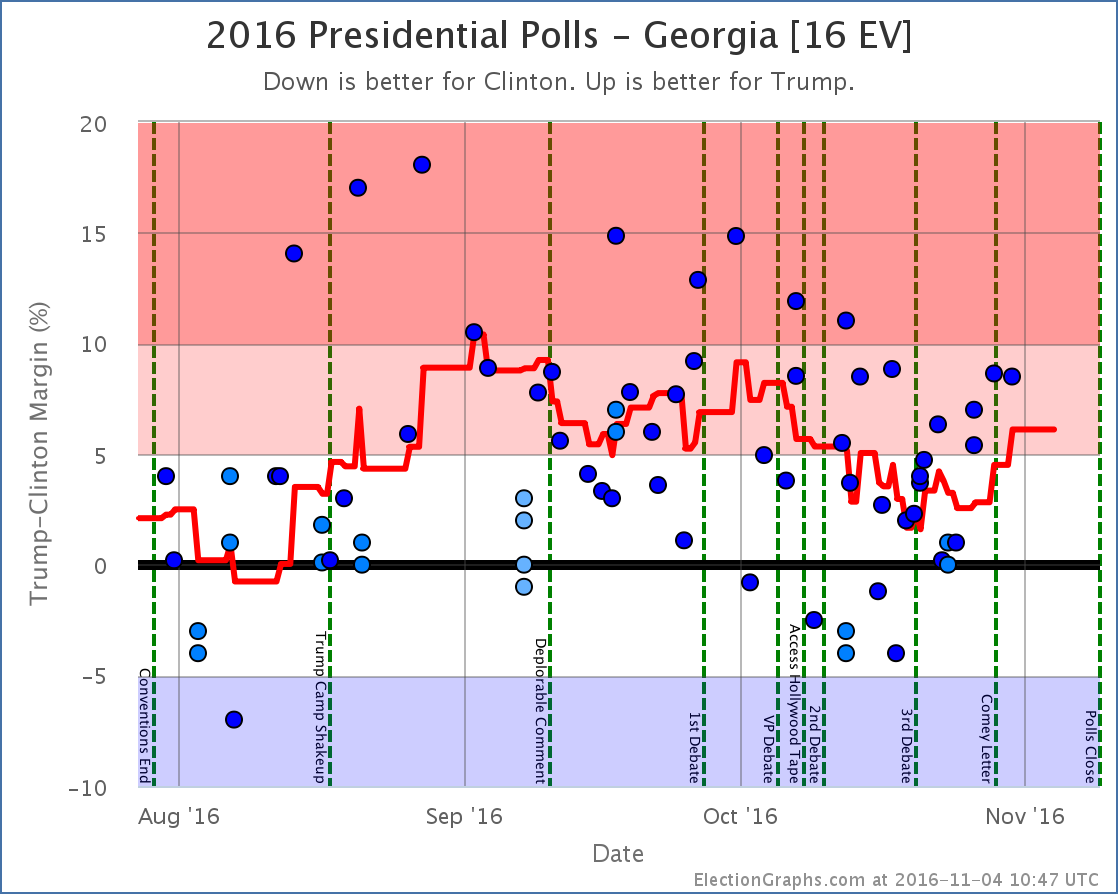
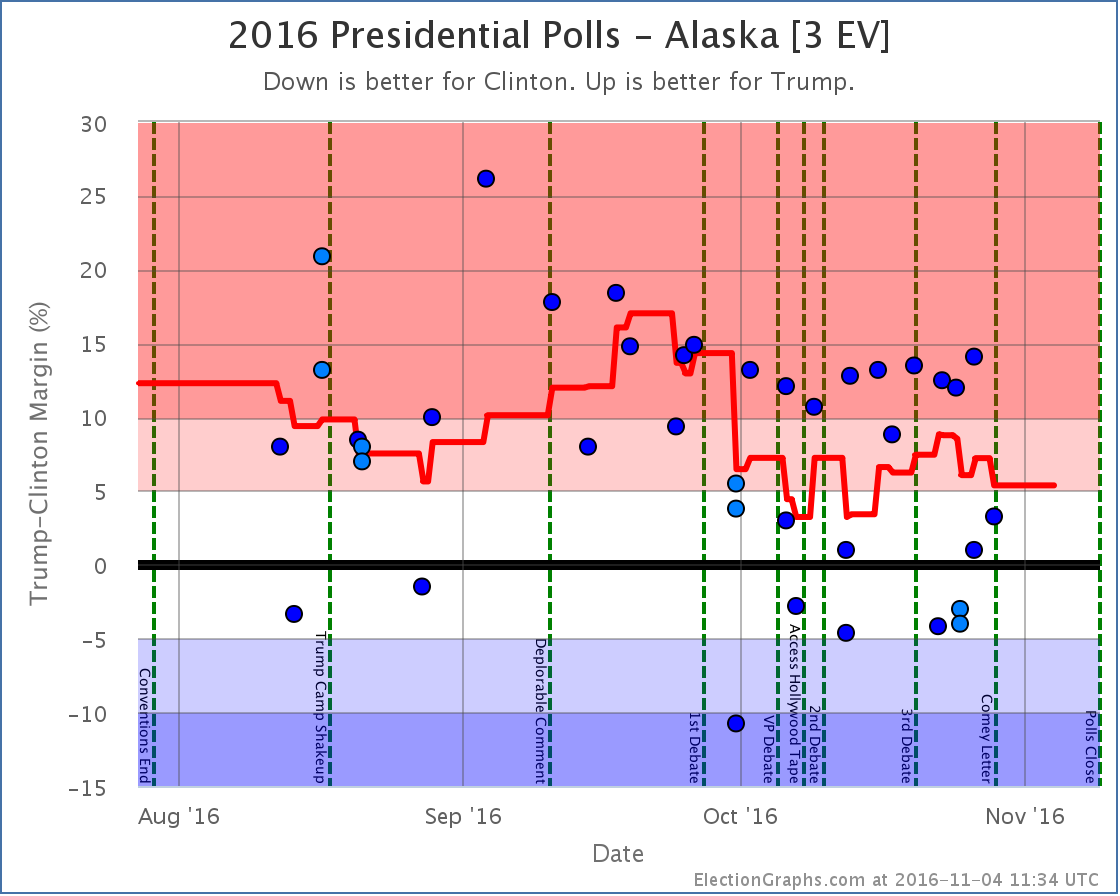
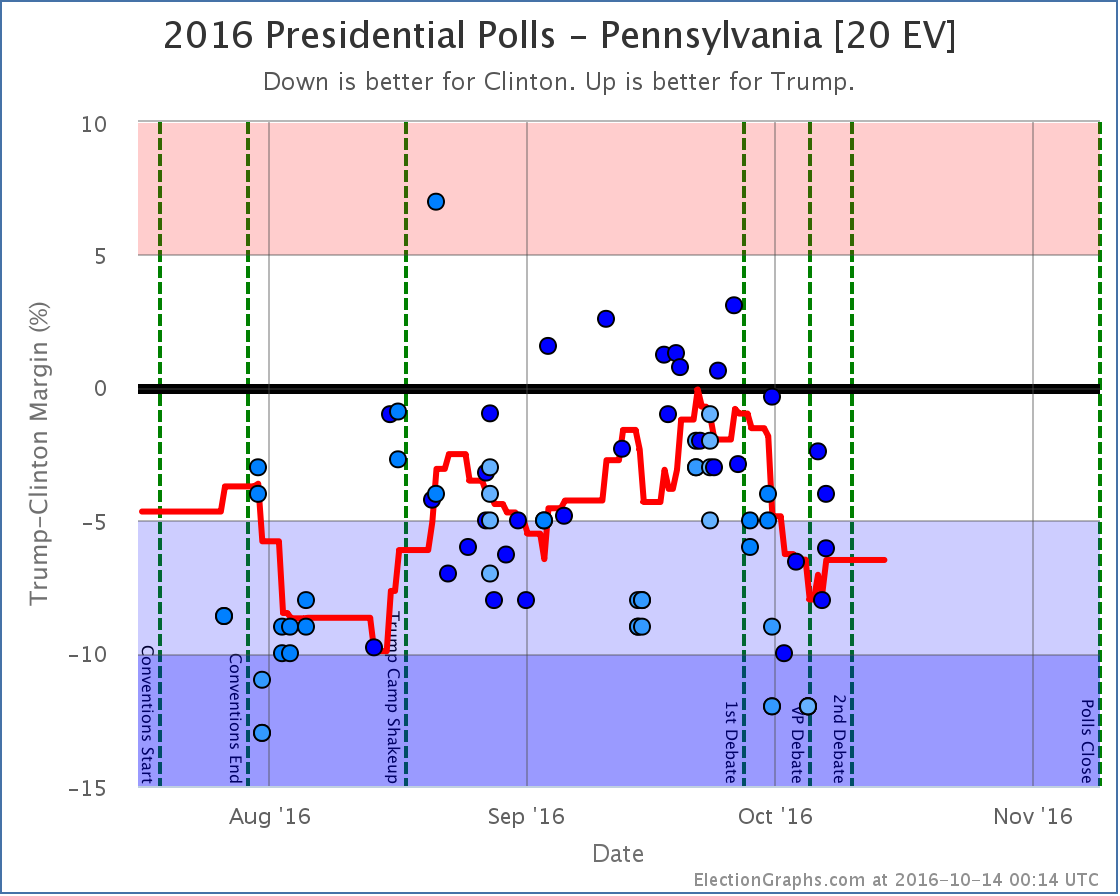
Notable changes in: Pennsylvania (20), Georgia (16), Michigan (16), North Carolina (15), Virginia (13), New Hampshire (4), Alaska (3), and the tipping point.
With the current pace of polling, there are already a number of new polls out since the line was cut for this update. They will of course be included in the next update.
National Summary
It has been about four days since the last update. Since then the movement has all been towards Trump. Some of this has been movement from polls taken primarily after the Comey letter, but a some of it also represents movement that was already happening when that news broke.
Good for Trump:
The expected result has moved from a 62 EV Clinton win to only a 32 EV Clinton win
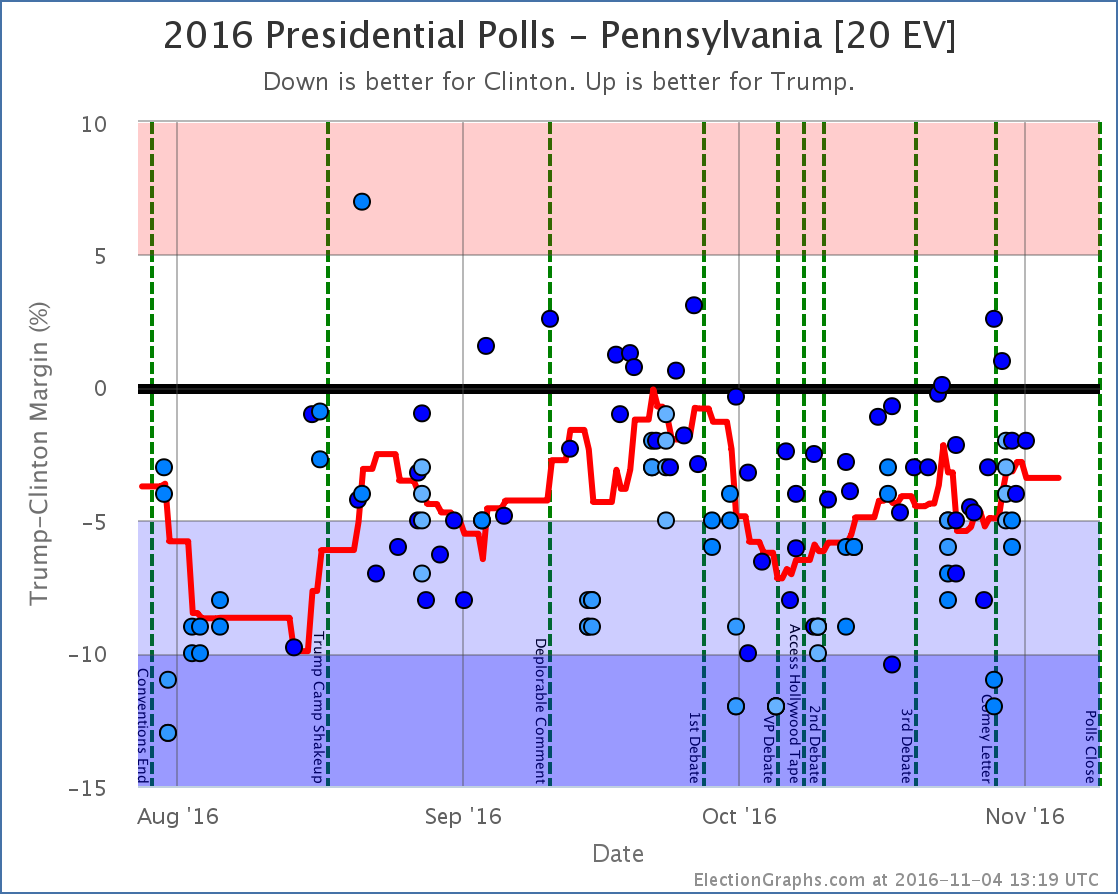
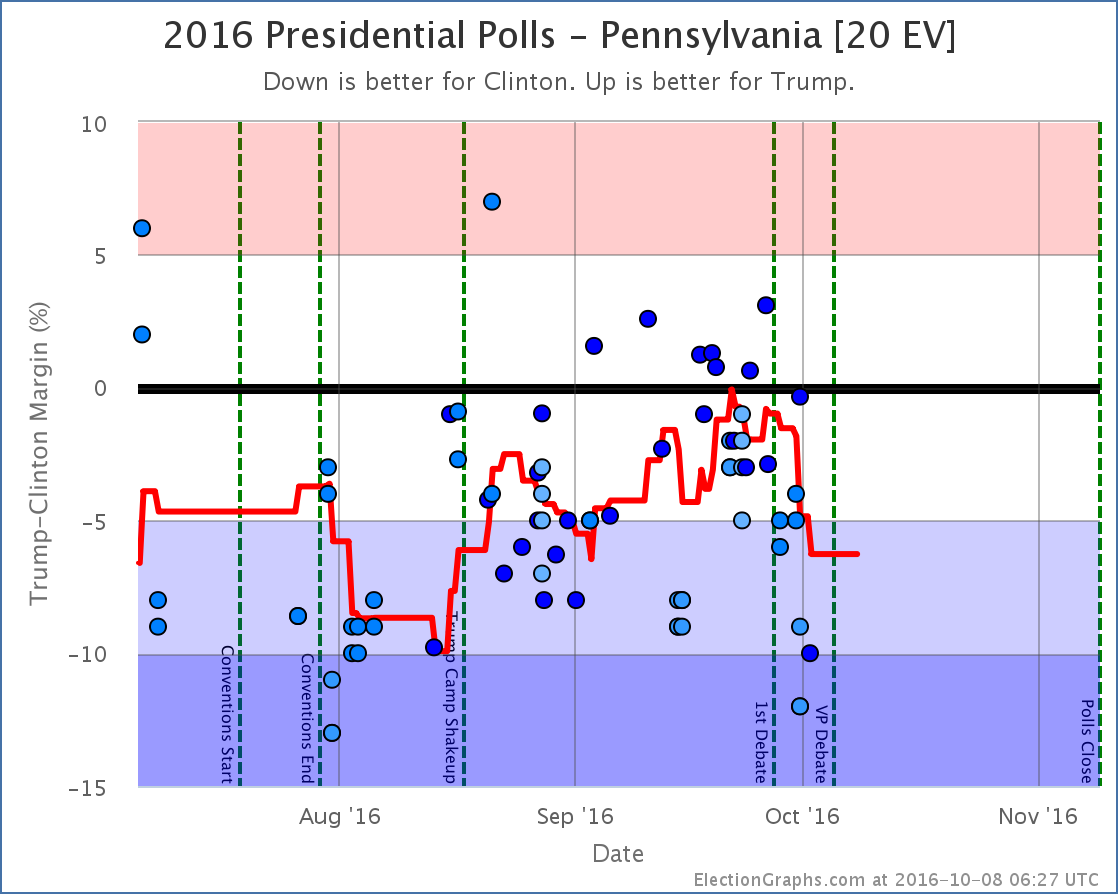
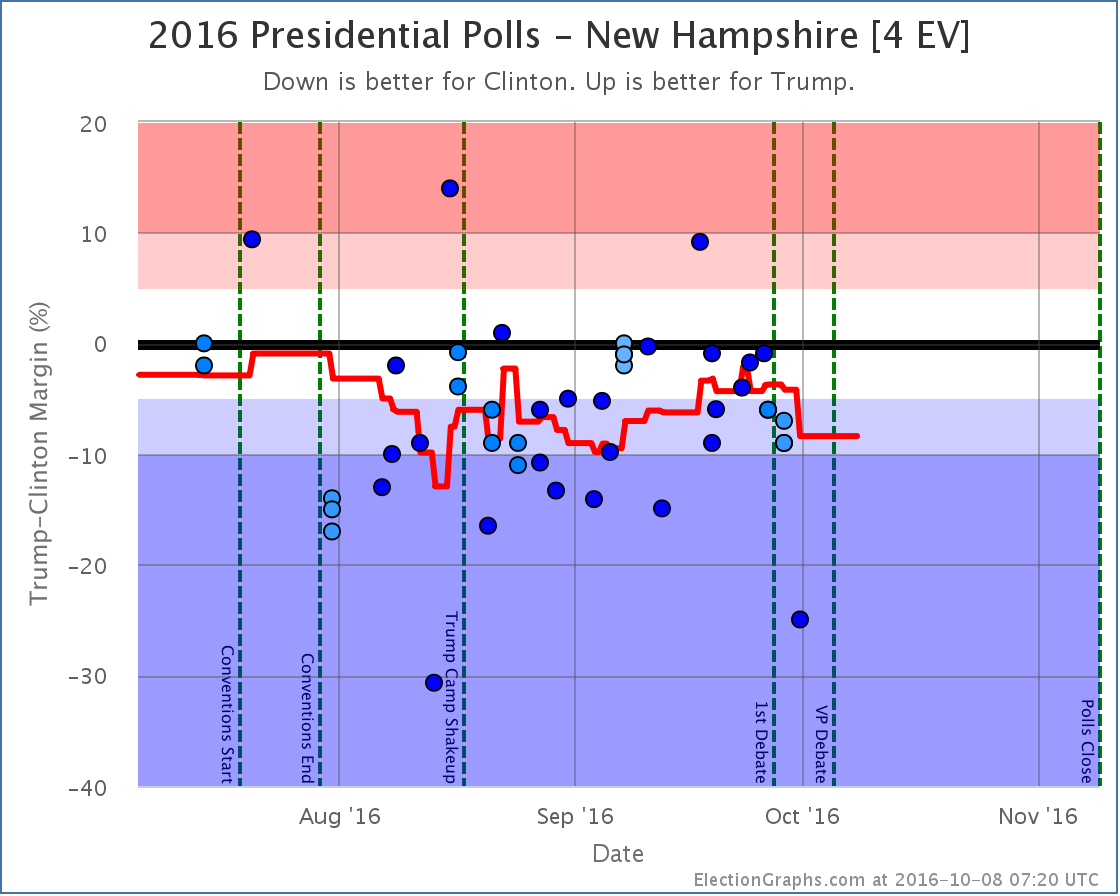
The tipping point has moved from Clinton by 5.3% in PA to Clinton by only 2.2% in NH
Clinton’s best case has declined from a 216 EV win to only a 178 EV win
Trump’s best case has shifted from a 6 EV loss to a 100 EV win
Charts
Discussion
Four days ago Trump had tightened the expected electoral college case, but critical states like Pennsylvania were moving against him, so the job of getting to 270 electoral votes was actually getting harder despite the electoral college gap narrowing.
Not so any more. In the last few days, which added lots of post-Comey polls (as well as some covering the pre-Comey period too) the movement has ALL been toward Trump. There is no mixed message this time. No bright side for Clinton. In the last few days almost all of the polling news has been good for Trump and bad for Clinton.
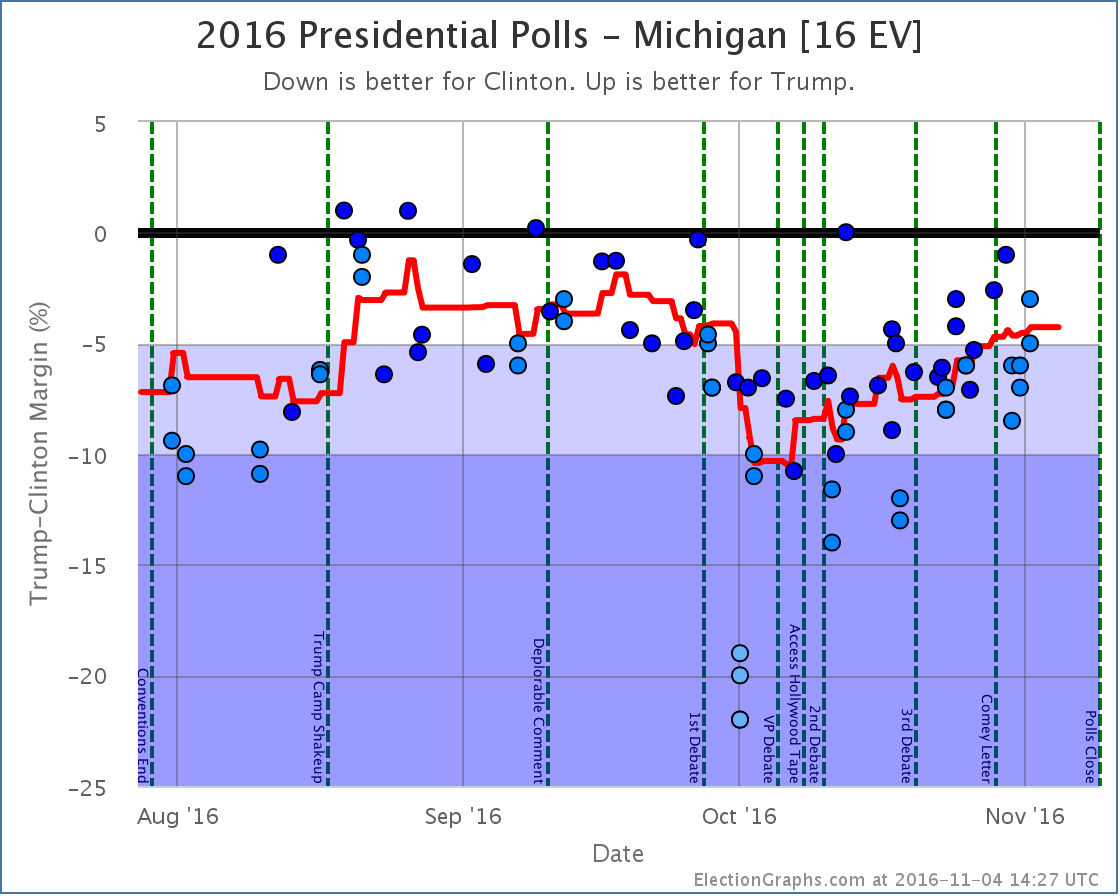
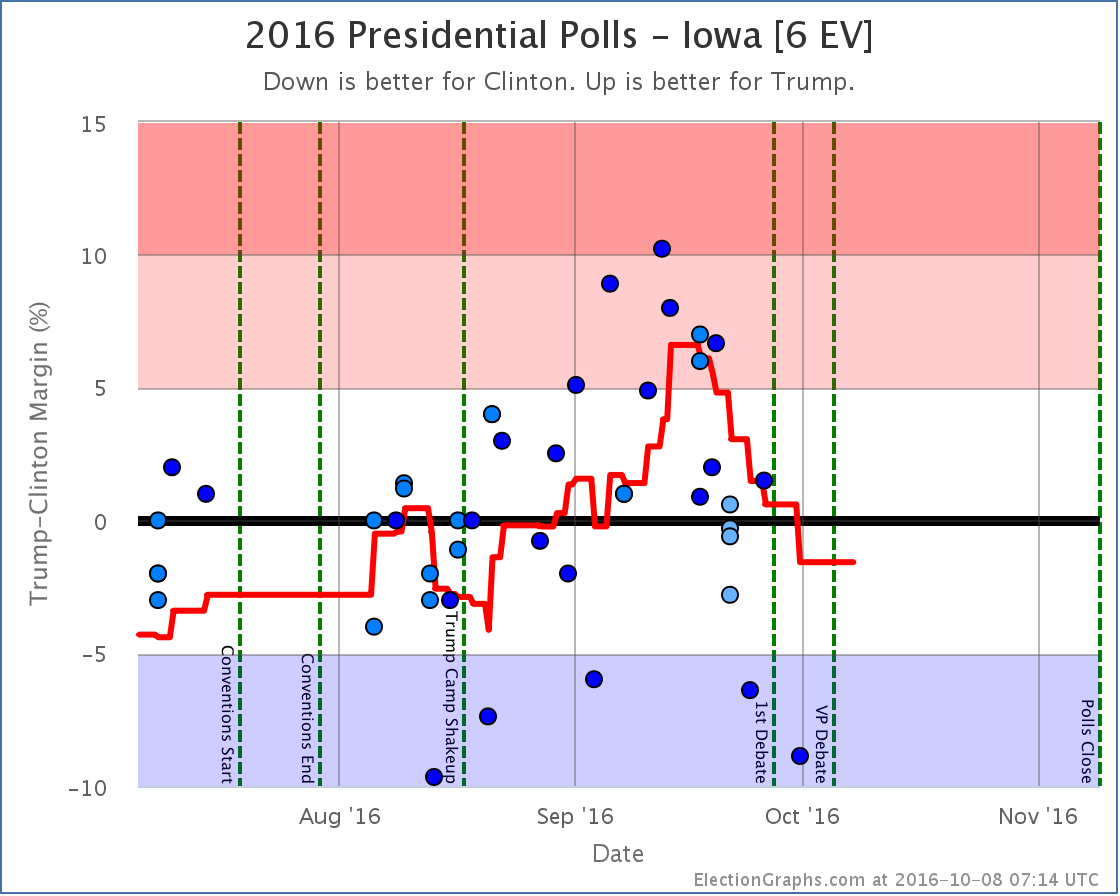
Now, she is still ahead. But Trump once again has a path. The “easiest” path at this point would be to win all the states he is currently leading, then pull in Nevada (0.6% Clinton lead), Iowa (0.9% Clinton lead) and New Hampshire (2.2% Clinton lead). Or he could get any one of those states, plus Virginia (3.2% Clinton lead). Or just Pennsylvania (3.4% Clinton lead). Or just Michigan (4.3% Clinton lead).
All of these states are ones where a few days ago Clinton’s lead was much stronger. Trump has been making gains all over the map.
How much of this is Comey? Some for sure, but as I’ve pointed out before, the expected electoral college been moving slowly toward Trump for weeks. But that did seem to have somewhat stalled out. The tipping point was moving back toward Clinton. With the Comey letter the move toward Trump came back with a vengeance.
We’re not quite at Trump’s highs from September, but we are getting near there. Now, even at his best point in September, Trump was still losing to Clinton. But it was close. And it is close again now. The Trump surge is real, and he has made this a race again.
The tipping point is at 2.2%. That is within the zone where a systematic polling error or a last minute news event that happens too late to be captured in polls could reverse the result. A Trump win COULD happen. This is not impossible.
Clinton is still heavily favored though.
This site does not produce “odds”, just the range of “you shouldn’t be completely shocked” outcomes, which is intentionally pretty wide. Right now, a Clinton win is expected, but a Trump win is not out of the question.
Lots of places do produce odds though. Here is the current rundown in terms of percentage chance of Trump winning:
I was asked on Twitter yesterday for my odds. Given that my model does not produce a number for this, I was reluctant to give an exact number. But I gave a range and said between 5% and 10%. With a few additional polls added since then, I’d go toward the higher end of that range. Maybe 7% to 10%.
Why that range?
Trump is getting very close to Clinton, but in all the prior polling movement in the campaign Trump has never been able to actually pull into the lead. It seems like he reaches a ceiling and gets to the point where to gain any further he has to not just convince the wishy-washy undecideds, but he has to start getting actual Clinton supporters to flip, which seems like a much harder job.
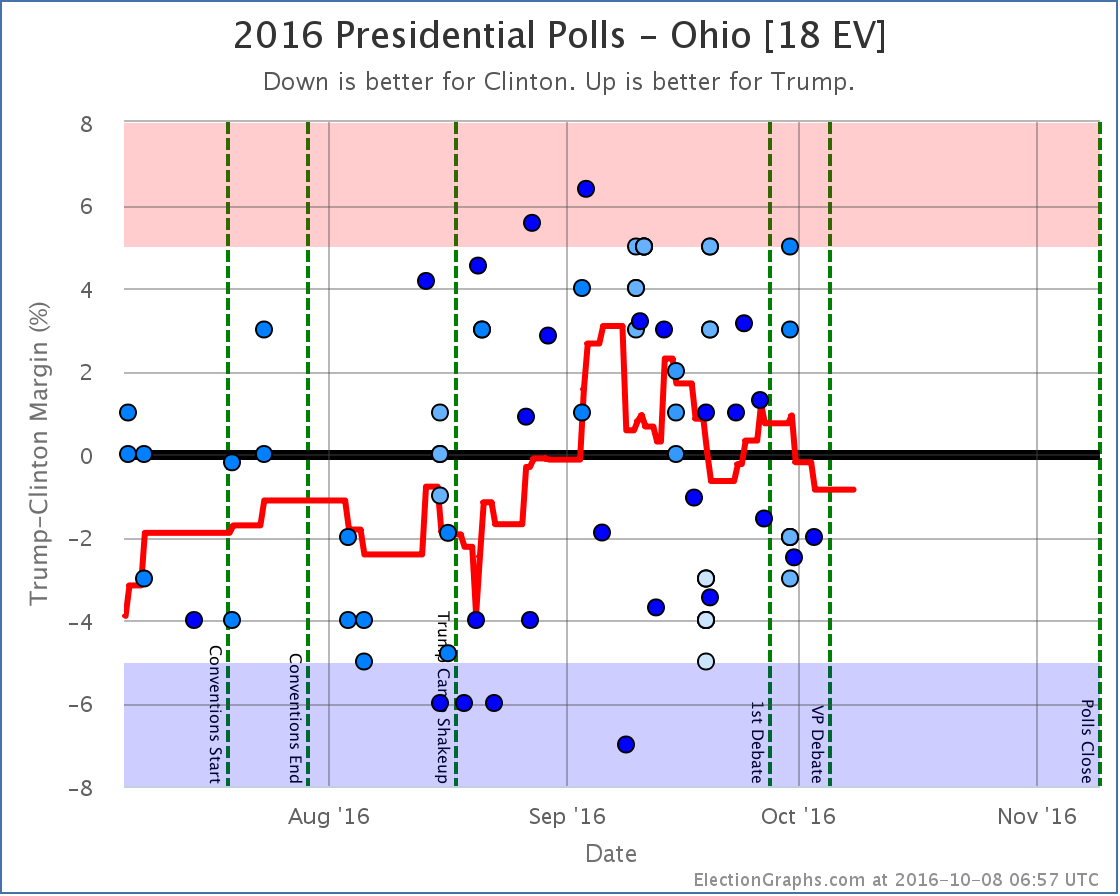
But until September I thought Trump’s ceiling was matching Romney’s performance in 2012. With current polling, Trump wins every state Romney won, then adds Florida and Ohio. So levels that look like ceilings can indeed be broken. Another bad news cycle for Clinton, or even some systematic error in the polling could easily put us there.
So 7% to 10% seems reasonable.
If a Trump win does happen, surprise is warranted, because he would have beaten the odds, but not shock, because he IS close.
If Trump was a hurricane that was four days out, we would be “within the cone”. Toward the edge of the cone to be sure. We are not directly on the projected path. We expect it to miss us. But we would be making preparations just in case the storm swerves and hits us.
4.3 days until we stop looking at polls and start looking at actual election results.
State Details
The following are the detailed charts for all the states that influenced the national changes outlined above.
Moving from Clinton to Trump
Moving into reach for Trump
Moving out of Clinton’s reach
Other states that helped move the tipping point
A note about McMullin
Election Graphs is designed around showing the Republican – Democrat margin, and there is not enough time before the election to revamp the site to properly account for 3rd parties that are strong enough to have a shot at winning electoral votes.
Right now the Real Clear Politics average in Utah has McMullin 12.0% behind the lead. The 538 average in Utah has him 10.3% behind the lead. Although McMullin was a lot closer than anyone expected, he never got closer than 5% to the lead in Utah in these averages and now appears to be fading. 538 still has him in second place, but it doesn’t seem likely at this point that he will win electoral votes.
If that changes, I will of course note it in these updates and on the Election Graphs site.
For more information…
This post is an update based on the data on ElectionGraphs.com. Election Graphs tracks a state poll based estimate of the Electoral College. All of the charts and graphs seen in this post are from that site. Additional graphs, charts and raw data can be found there. Follow @ElectionGraphs on Twitter or like Election Graphs on Facebook to see announcements of updates or to join the conversation. For those interested in individual general election poll updates, follow @ElecCollPolls on Twitter for all the polls as they are added. If you find the information in these posts interesting or useful, please consider visiting the tip jar.
Edit 17:45 UTC to fix some wording in the hurricane comparison paragraph.
States with new poll data added since the last update: Everywhere except Alaska, DC, Hawaii, Rhode Island, Vermont, Wyoming, and the Nebraska congressional districts.
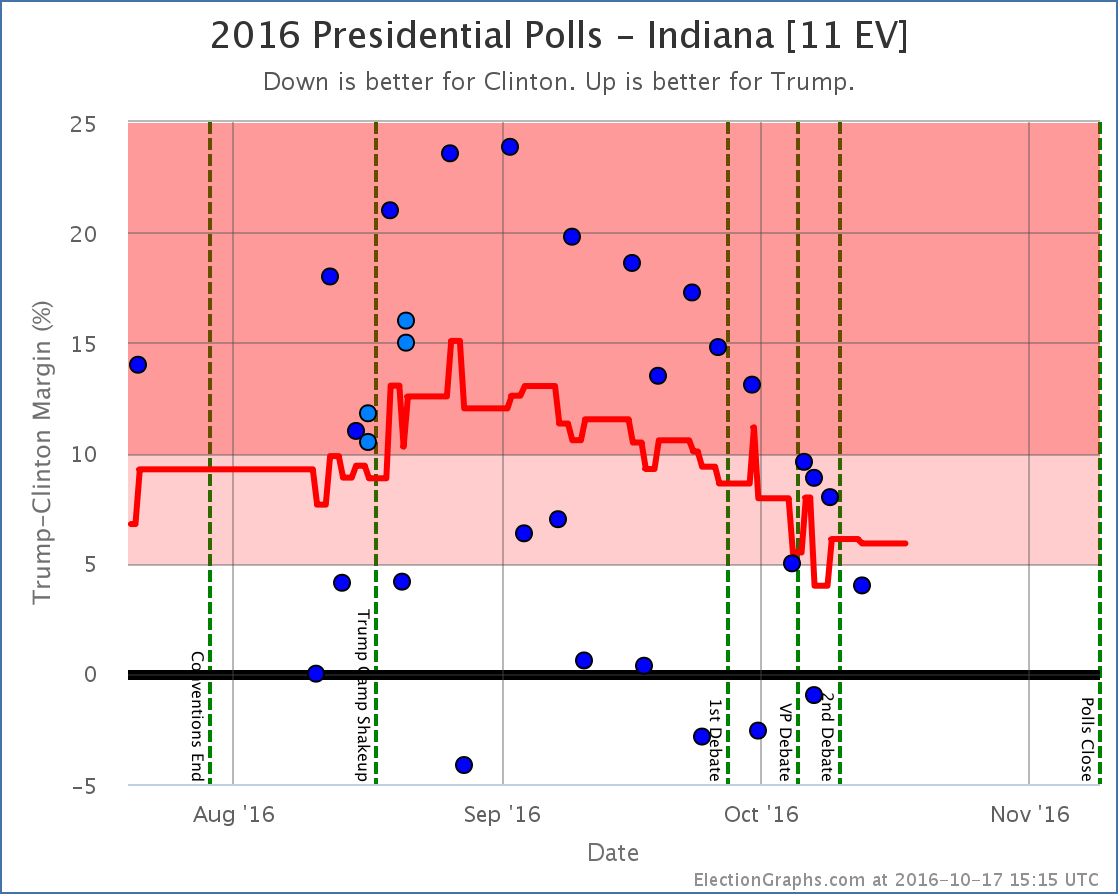
Notable changes in: Indiana and the tipping point
National Summary
We now have plenty of polls that are after the Access Hollywood tape and after the 2nd debate, and even a few from after the various sexual assault allegations leveled against Donald Trump. The averages go back further, often covering 2-3 weeks, even for the close states. But we are getting to the point where we should be seeing impact from those events.
After the first debate, we did see a big drop. It continued through to release of the tape and the second debate. We are still getting polls covering the period immediately after that, so things may yet change… but so far there has not been a further drop since those events.
In fact, we have seen an improvement for Trump since the last update:
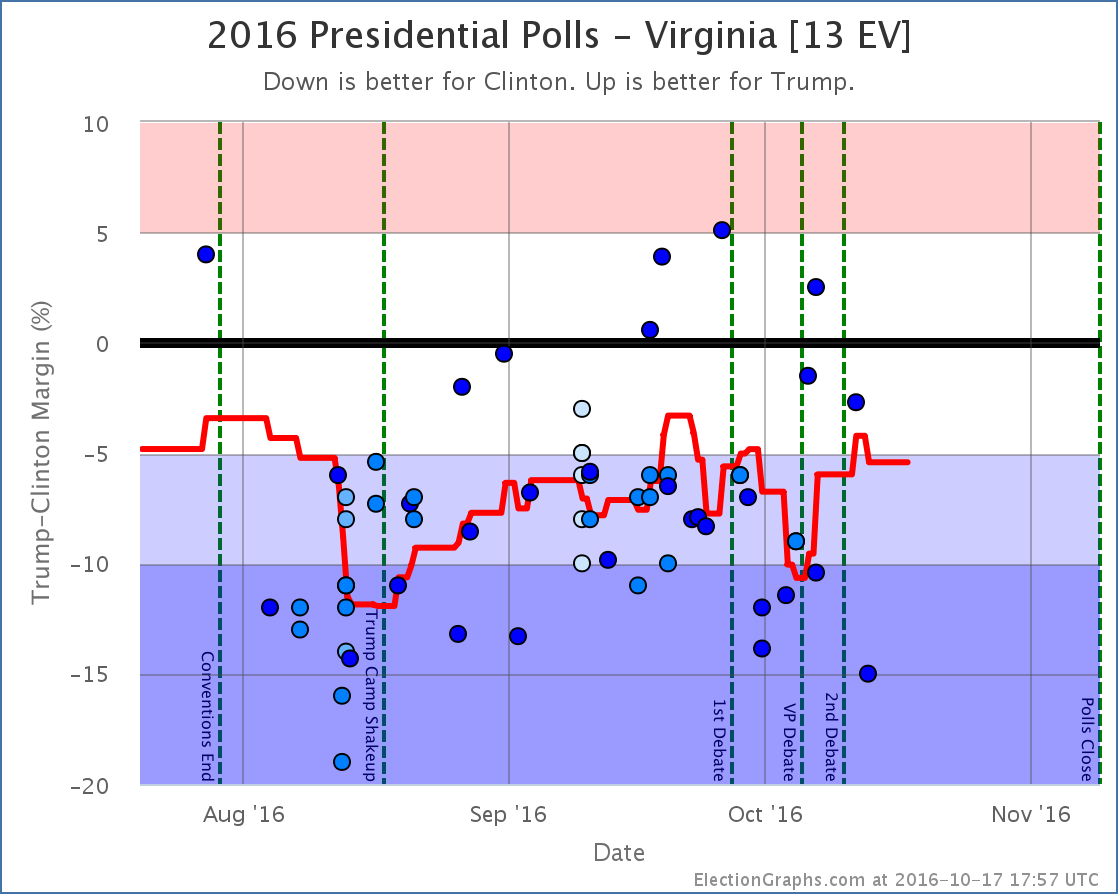
The tipping point moved from Clinton by 6.5% in PA to Clinton by 5.4% in VA.
Clinton’s best case declined from a 226 EV win to only a 204 EV win.
The expected case and Trump’s best case remained the same.
Here are the charts:
Both charts show a bit of improvement for Trump based on the last few days of polls.
Now, it might be wise to be cautious here. We are still going to get more polls covering this period. So these lines will move about some more. But it is also very possible that Trump hit his floor, and we’re now bouncing back a bit from that.
The public is very polarized. There is a percentage of Americans who will vote Democrat no matter what, and another percentage who will vote Republican no matter what. We may have seen both extremes of the how far things can change by those in the middle sloshing back and forth. If so, the extremes of this race go from a nearly tied race at Trump’s ceiling, to about a 188 electoral vote win for Clinton at her ceiling. Those are “expected case” numbers. In terms of the tipping point that translates into a Clinton lead of between approximately 0.5% and 6%.
Given recent news cycles and where things stand now, it currently seems as if a break through Trump’s floor is more likely than through his ceiling. As has been pointed out, a comeback from this far behind with this little time left would be unprecedented. But while it is possible that events may cause us to break out of that range, it seems very likely that when the votes come in on November 8th, we’ll find ourselves somewhere between those bounds.
But we shall see soon enough… 22.1 days left to go!
State Details
Moving out of Clinton’s reach
The general trend in Indiana has been a steadily weakening lead for Trump. But with the latest polls, the average pops up to a 5.9% Trump lead, so for now, Indiana is no longer in the “could go either way” category.
State that changed the tipping point
A note about McMullin
In the last week or two McMullin has spiked in Utah. Some individual polls show him within striking range of winning Utah. All of the current Election Graphs metrics and charts operate under the assumption that no third party has a realistic shot at winning electoral votes. I have had the outline of a contingency plan on how to modify the site to accommodate 3rd parties that might win electoral votes, but activating it would take quite a lot of work. If a 3rd candidate had gotten to that position a month or two ago, the site would definitely have been revamped to adjust for that possibility. As it is, there simply may not be time to do that before election day.
Right now the Real Clear Politics average in Utah, which includes McMullin, stands at Trump 31.8%, Clinton 25.5%, McMullin 22.8%, Johnson 8.8%, Stein 1.0%. (The Election Graphs Utah average currently stands at Trump 39.0%, Clinton 26.8%, but doesn’t yet include at least one poll that came out as this update was being finalized.) If and when the RCP average shows McMullin within 5% of the lead in the state, I will at the very least put notes at appropriate places on the site noting he has the possibility of winning 6 electoral votes. I will consider more substantial changes only if time allows.
For more information…
This post is an update based on the data on ElectionGraphs.com. Election Graphs tracks both a poll based estimate of the Electoral College and a numbers based look at the Delegate Races. All of the charts and graphs seen in this post are from that site. Additional graphs, charts and raw data can be found there. Follow @ElectionGraphs on Twitter or like Election Graphs on Facebook to see announcements of updates or to join the conversation. For those interested in individual general election poll updates, follow @ElecCollPolls on Twitter for all the polls as they are added. If you find the information in these posts interesting or useful, please consider visiting the tip jar.
States with new poll data added since the last update: All 50 states, DC, and the Maine congressional districts
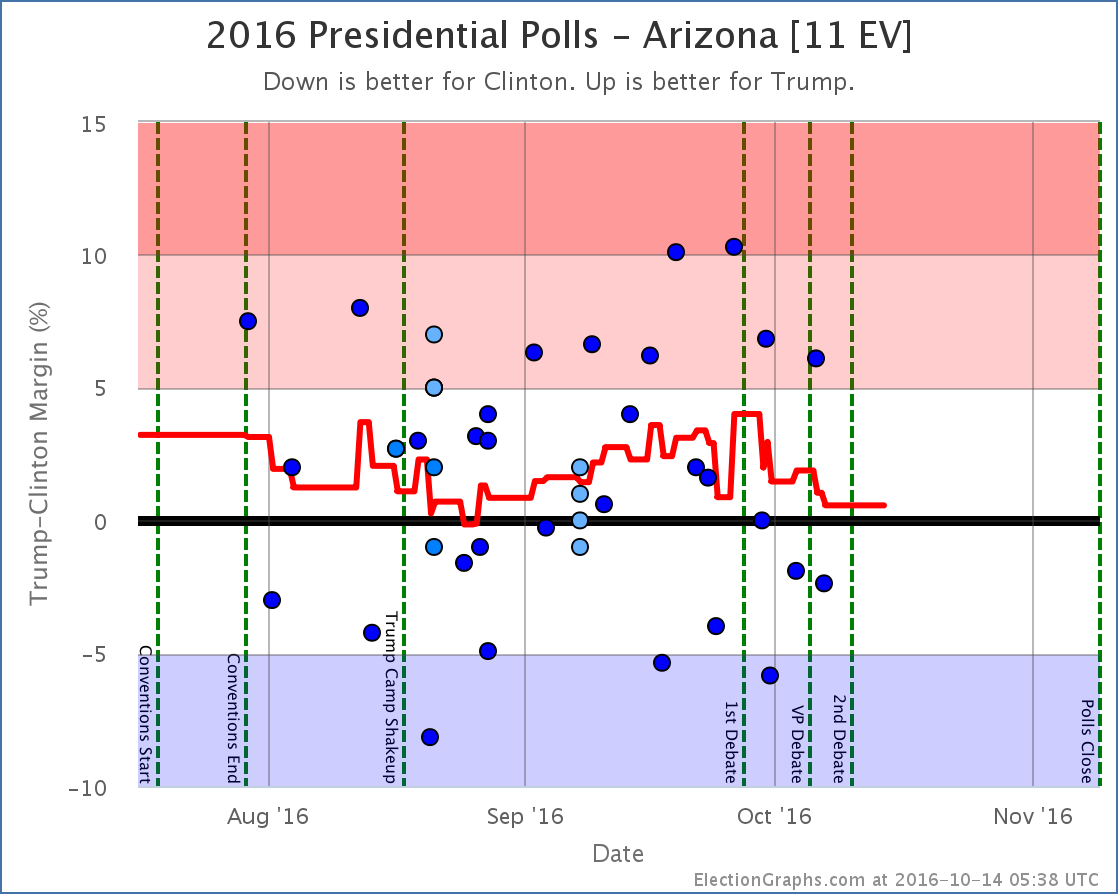
Notable changes in: Arizona, Indiana, Maine (CD2), and the tipping point
National Summary
At this point we have many polls that are fully or partially after the “Trump Tape” release on the 7th, but this batch of polls still included many where most of the time in the field was before that. And of course the state averages here are based on at least the last five polls in each state, so reach even further back in time. The close states tend to be based on polls with middates going back 1-3 weeks.
All that is to say that the changes we are seeing now are starting to include the fallout from that event, but haven’t yet fully factored it in.
With that out of the way, the changes for this round:
The expected result moves from Clinton by 176 EV to Clinton by 154 EV
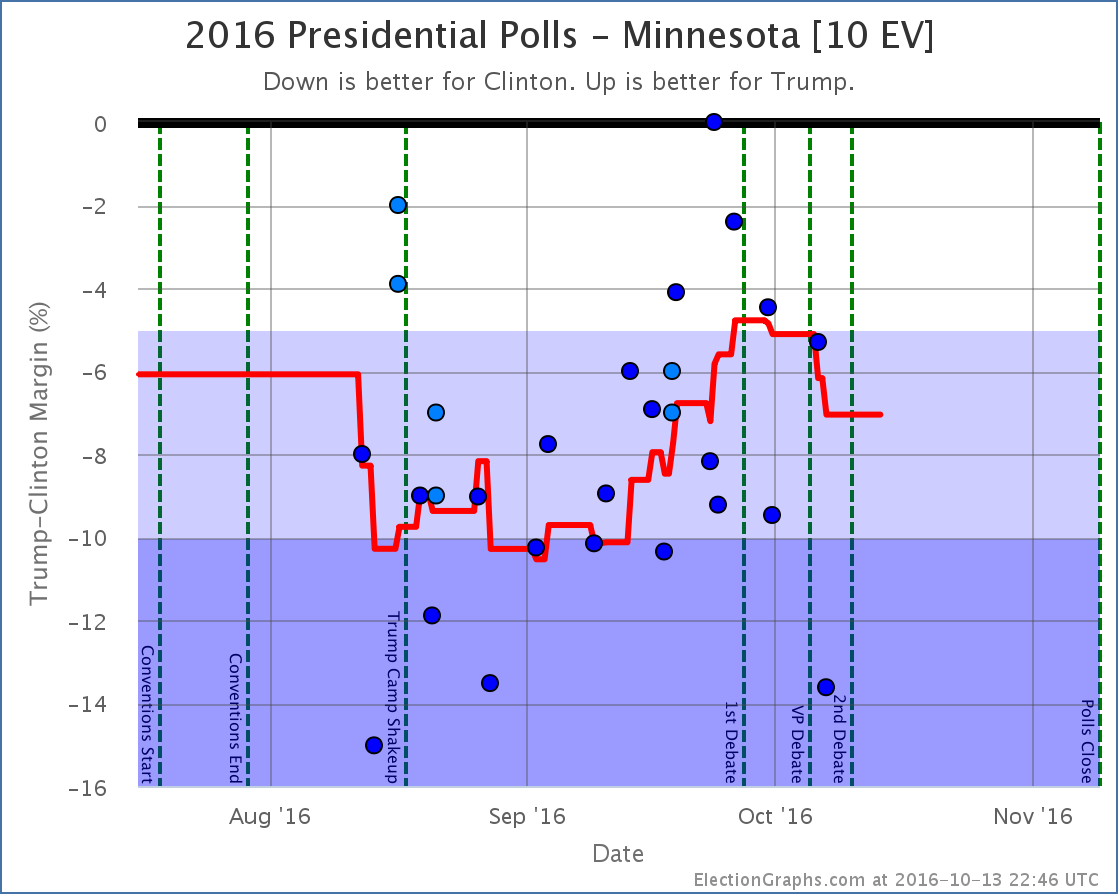
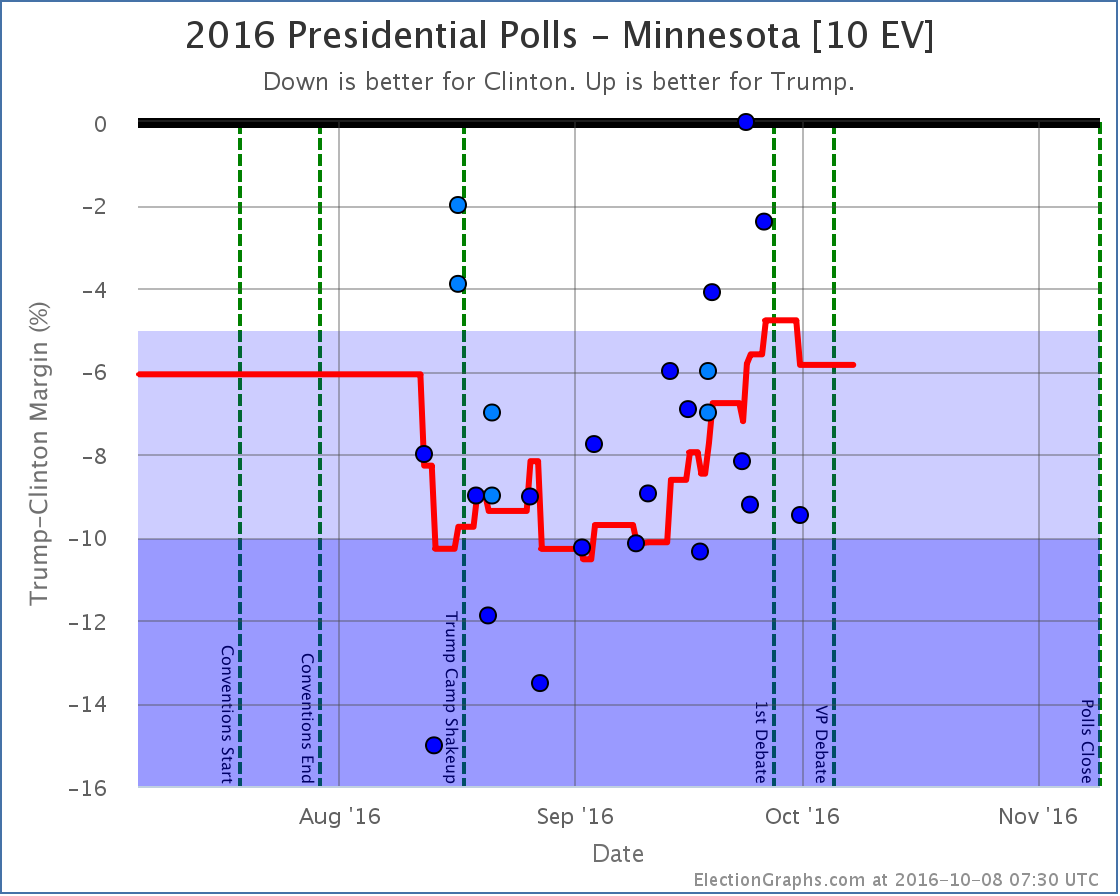
The tipping point moves from Clinton by 5.9% in MN to Clinton by 6.5% in PA
Clinton’s best case improves from winning by 202 EV to winning by 226 EV
So wait, the expected result moved toward Trump! Why is the title of this post about Trump’s drop continuing?
Well, basically because the improvement in the expected case is a result of Arizona moving from just barely Clinton, to just barely Trump. Either way it is really too close to call. It may flip back again with the next update. Or maybe it won’t.
But meanwhile, polling changes in Minnesota, Virginia, and Pennsylvania moved the tipping point further toward Clinton, meaning that overall Trump has to move polls even further in order to actually flip the results of the election.
And Clinton expanded her best case a bit as well.
Here are the charts:
The trend in both charts is clear. After peaking right before the 1st debate Trump has been falling. This is more dramatic in the tipping point chart, but it is clear no matter which way you look at the race.
There is no time left for a Trump comeback from behind win from these levels. It would take something massive that would completely reverse everything we know about this race so far. It would be an unprecedented reversal. Impossible? No. Incredibly unlikely? Yes.
A few weeks ago Trump had managed to make this race close. But it was short-lived. Starting with the debate he has been dropping steadily. We don’t yet have signs that we have hit bottom either. There have been new negative stories about Trump almost every day. Further drops would not be surprising.
We’re no longer really talking about who will win this election. Clinton will win this election. The only question is by how much.
25.8 days left until we have the first actual election results.
State Details
Weak Clinton to Weak Trump
The latest polls not only move Arizona from Weak Clinton to Weak Trump, but since older polls were added, they actually moved the past curve Trumpward, such that we no longer have a recent period with Clinton in the lead at all. The trend has still been away from Trump toward Clinton since the 1st debate, but Clinton hasn’t pulled Arizona over to her side quite yet.
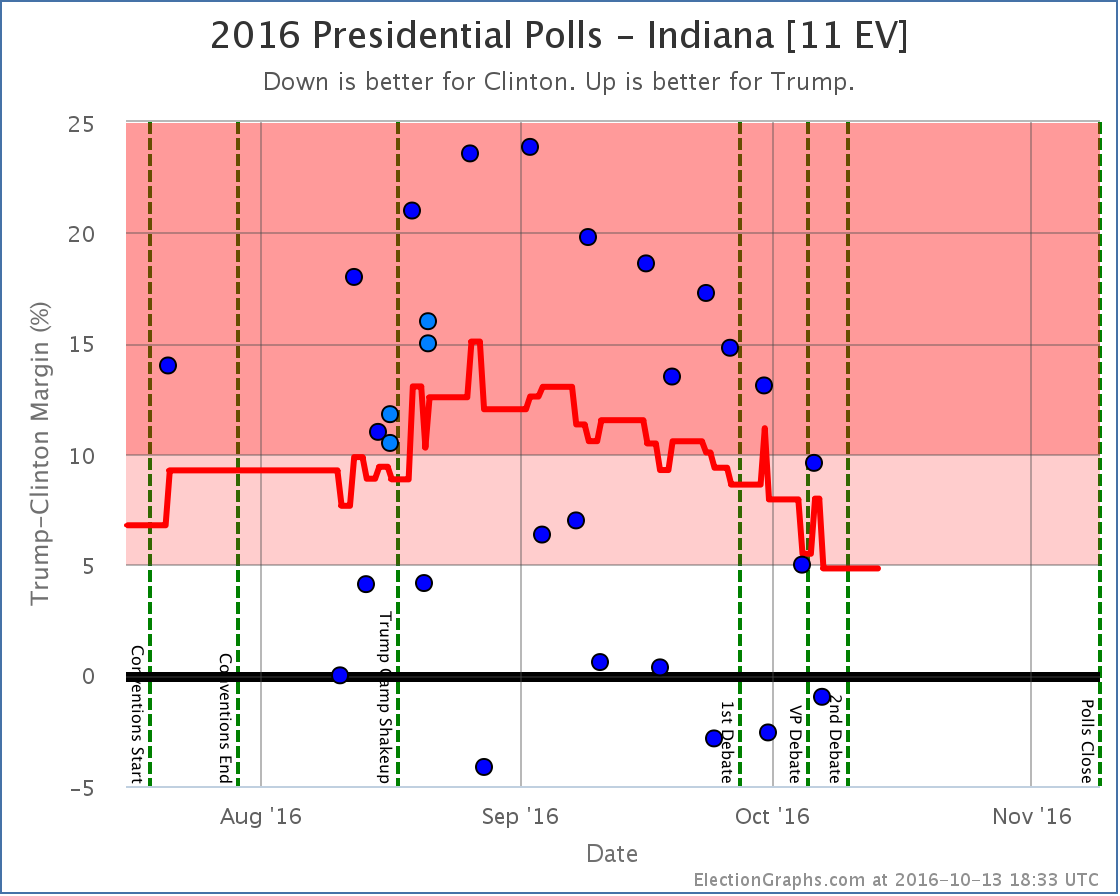
Moving into Clinton’s reach
Trump’s lead in Indiana has been diminishing since late August. With the latest updates Trump is up 4.8%. Trump still leads, but it is now close enough that a Clinton win does not seem impossible. Still a stretch to be sure, but no longer unimaginable.
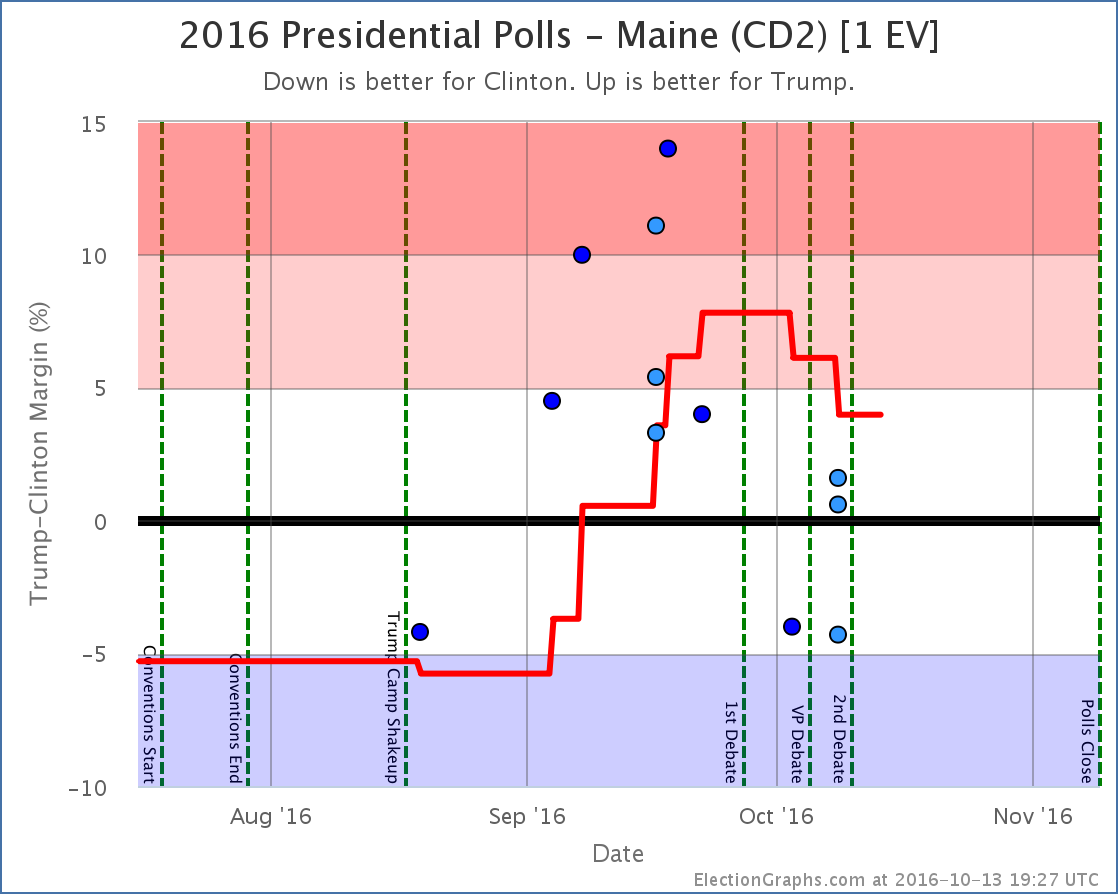
Maine’s 2nd congressional district had looked like it would definitely split from the state this cycle giving Trump a somewhat unusual pickup. With the post-debate polls, Trump still leads, but his lead is slipping, and so it now seems that this single electoral vote is now up for grabs. Clinton could steal it back.
States that moved the tipping point
For more information…
This post is an update based on the data on ElectionGraphs.com. Election Graphs tracks both a poll based estimate of the Electoral College and a numbers based look at the Delegate Races. All of the charts and graphs seen in this post are from that site. Additional graphs, charts and raw data can be found there. Follow @ElectionGraphs on Twitter or like Election Graphs on Facebook to see announcements of updates or to join the conversation. For those interested in individual general election poll updates, follow @ElecCollPolls on Twitter for all the polls as they are added. If you find the information in these posts interesting or useful, please consider visiting the tip jar.
States with new poll data added since the last update: All of them. Multiple times. There are additional new polls since I had to cut things off for this update as well. Those will be in the next update.
National Summary
The last week of polls has been devastating to Trump’s position. In the last update we were just starting to see the reaction from the first debate. With this batch the post-debate polling continued to roll in, and while there were a couple of minor moves toward Trump, the net change in this update was a dramatic move toward Clinton:
The expected result moved from Clinton by 6 electoral votes to Clinton by 154 electoral votes
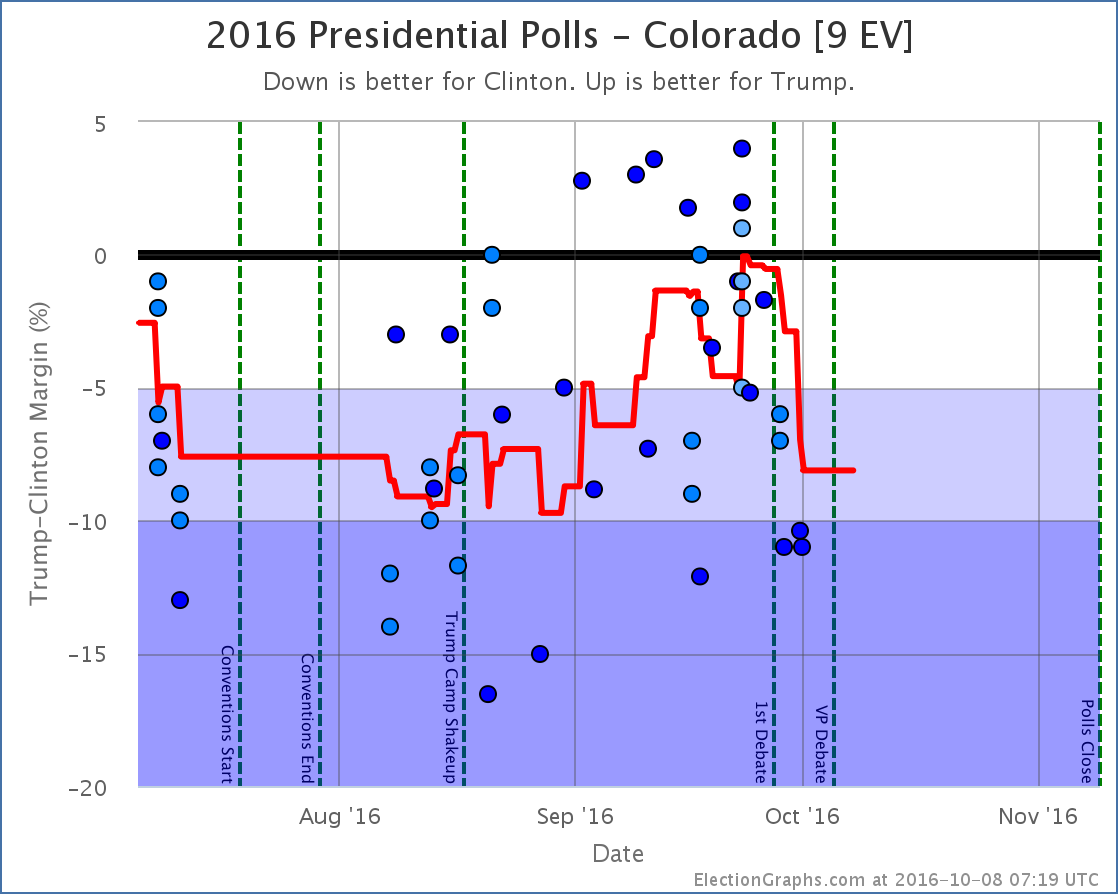
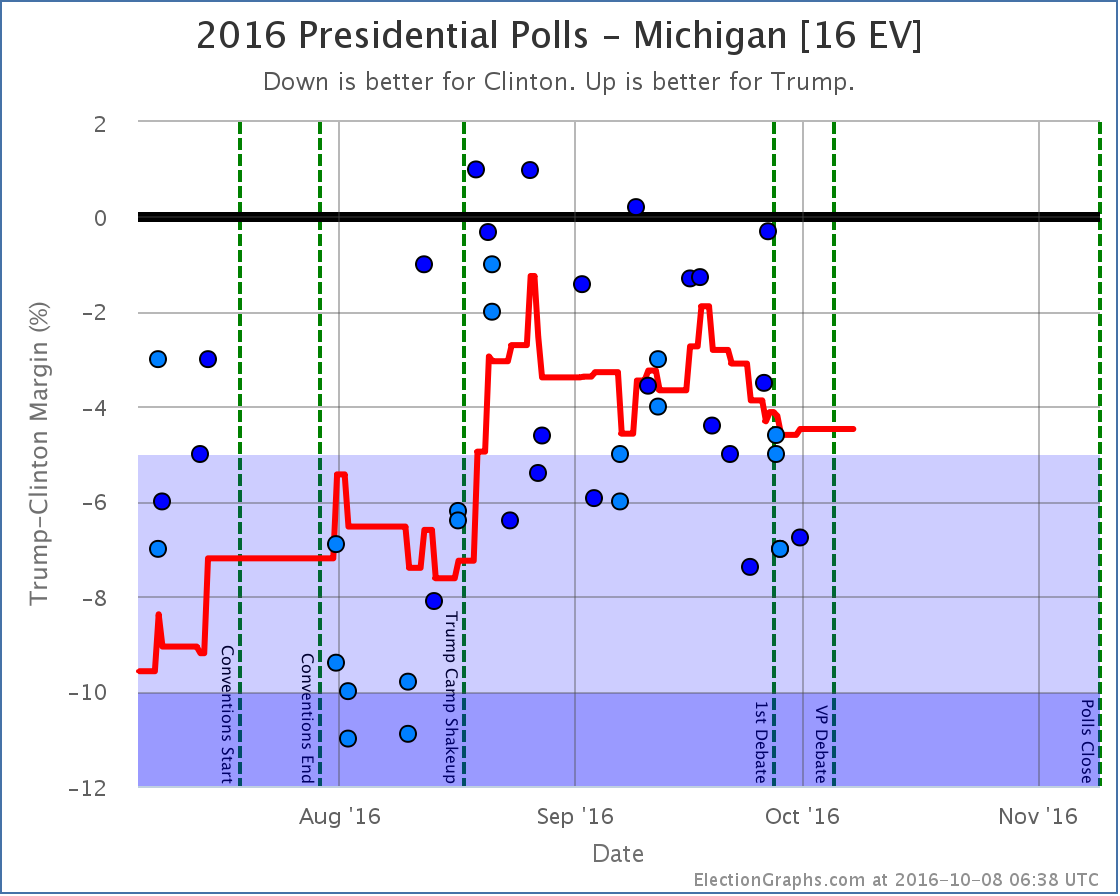
The tipping point moved from Clinton by 2.1% in CO to Clinton by 4.5% in MI
Trump’s best case moved from a 60 EV win to a 26 EV win
Clinton’s best case moved from a 208 EV win to a 196 EV win
Looking at the charts:
The previous update mentioned some Trump losses starting a week or two before the debate. With a lot more polls filling in the time period right before the debate as well as right after, it now looks like those losses were reversed before the debate.
In the time after the debate though, all three indicators on the chart have moved in Clinton’s direction. The race is now essentially back to where it was at the beginning of September. We’re not yet back at Clinton’s high point from August, but it is getting close.
The tipping point chart is even more stark. As with the electoral college view, it looks like Trump’s mid-September declines were reversed by debate time, but after the debate everything falls off a cliff. Most of Trump’s gains from August and September are gone. Right before the debate he topped out with Clinton only ahead in the tipping point metric by 0.4%.
Clinton now leads by 4.5%. The tipping point state is Michigan. Clinton only has to increase her lead slightly there to not just take Michigan out of reach for Trump, but the Presidency.
What we are seeing in the polling results right now at this point probably fully factors in the debate itself. But we are just starting to see the impact from Trump’s “worst week in presidential campaign history ” that started with the debate, continued with his attacks on Alicia Machado, and ended with the leak of some of his tax information. The events of that week are not yet fully baked in.
And of course, the polls do not yet reflect the VP debate, or more importantly, the 2005 Trump video that was leaked on Friday. It is hard to imagine the events of the last few days NOT having an impact on the polls.
And the next debate is coming up. It should be interesting. If you were not planning on tuning in before, change your plans.
31.7 days left until the first actual election results start coming in.
State Details
A lot of states moved in order to produce the summary results above. For those interested in looking at the state by state details, they are below:
Weak Trump to Weak Clinton
Moving out of reach for Trump
Moving out of reach for Clinton
Moving into reach for Trump
States that changed categories but then moved right back again
For more information…
This post is an update based on the data on ElectionGraphs.com. Election Graphs tracks both a poll based estimate of the Electoral College and a numbers based look at the Delegate Races. All of the charts and graphs seen in this post are from that site. Additional graphs, charts and raw data can be found there. Follow @ElectionGraphs on Twitter or like Election Graphs on Facebook to see announcements of updates or to join the conversation. For those interested in individual general election poll updates, follow @ElecCollPolls on Twitter for all the polls as they are added. If you find the information in these posts interesting or useful, please consider visiting the tip jar.
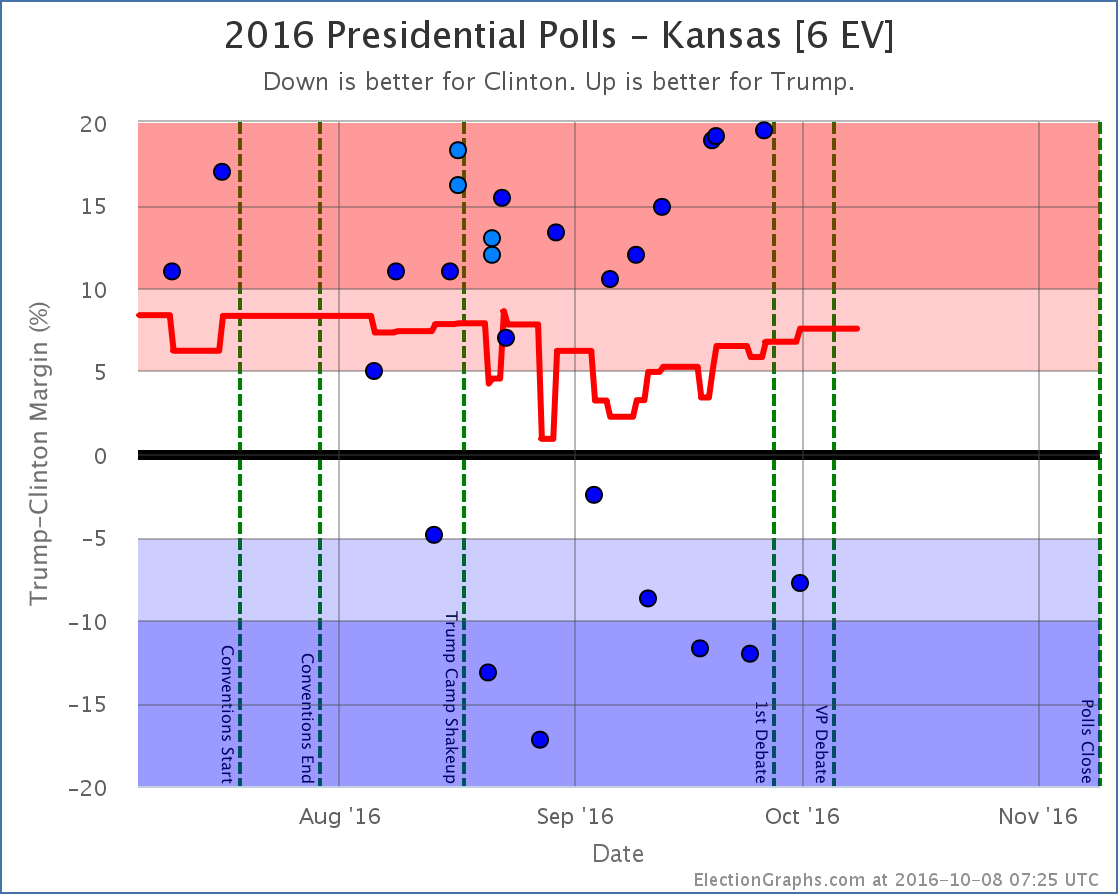
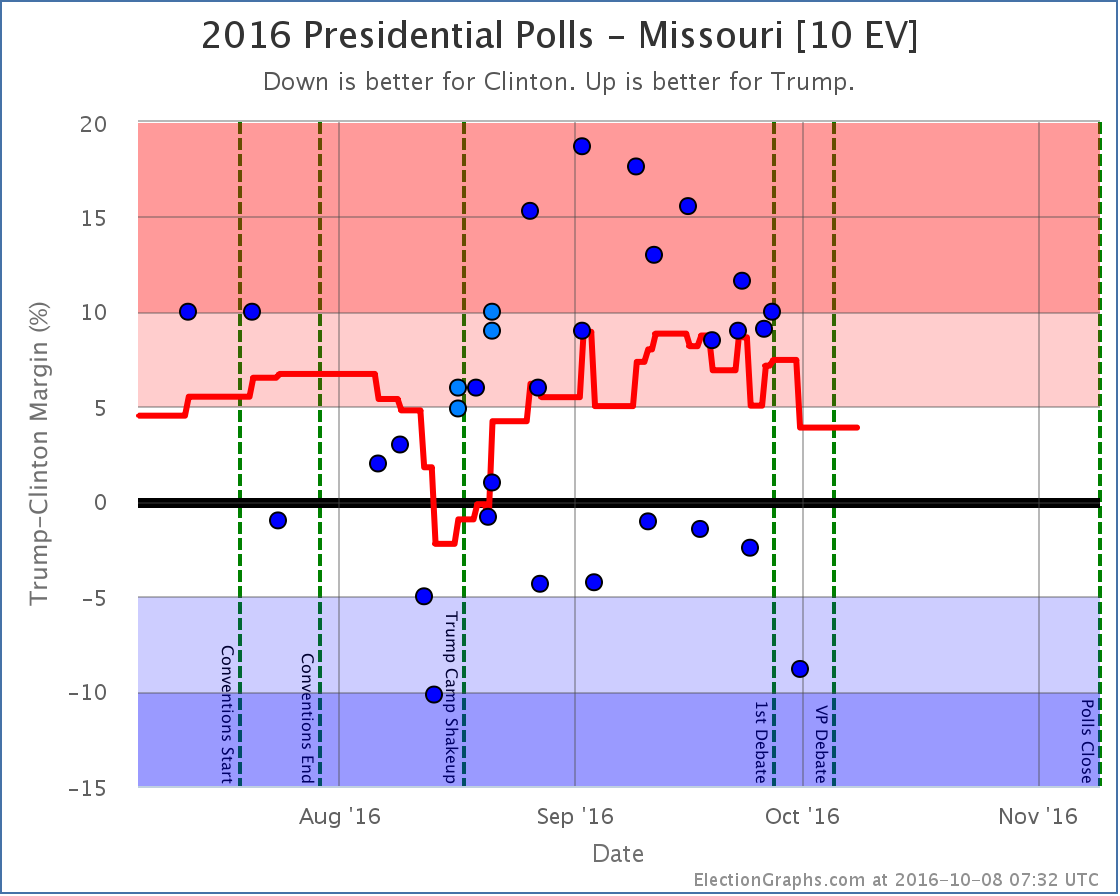
States with new poll data since the last update: Utah, Georgia, Missouri, Kentucky, Illinois, Pennsylvania, North Carolina, Ohio, Iowa, Florida, Kansas, Wisconsin, New Hampshire, Texas, South Carolina, Maine (All), New York, North Carolina, Virginia, Colorado
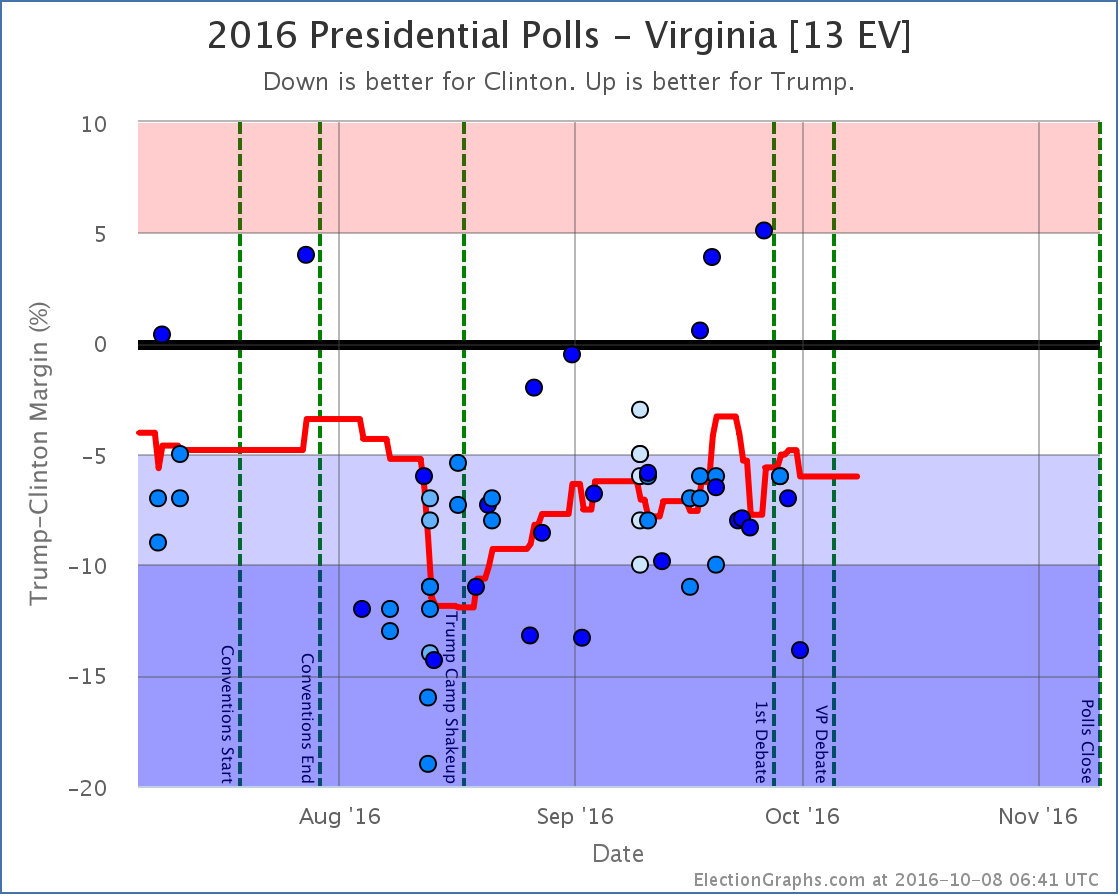
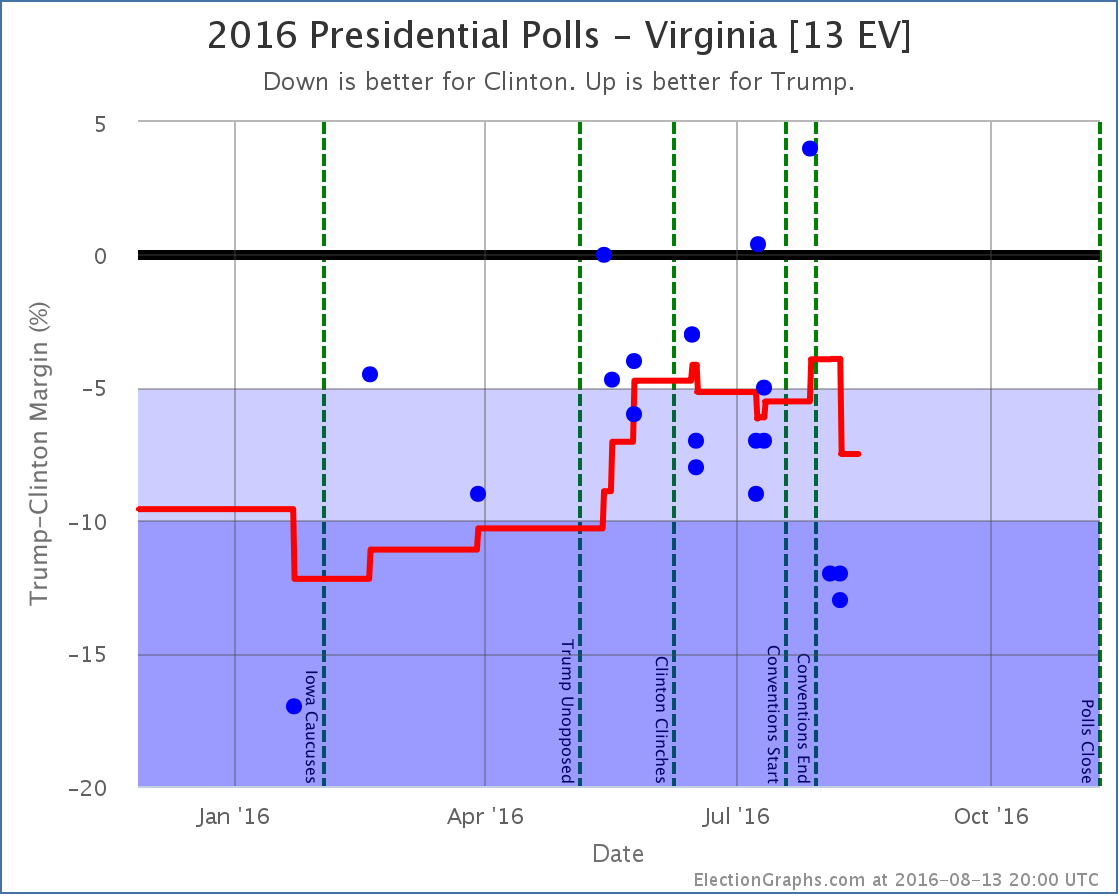
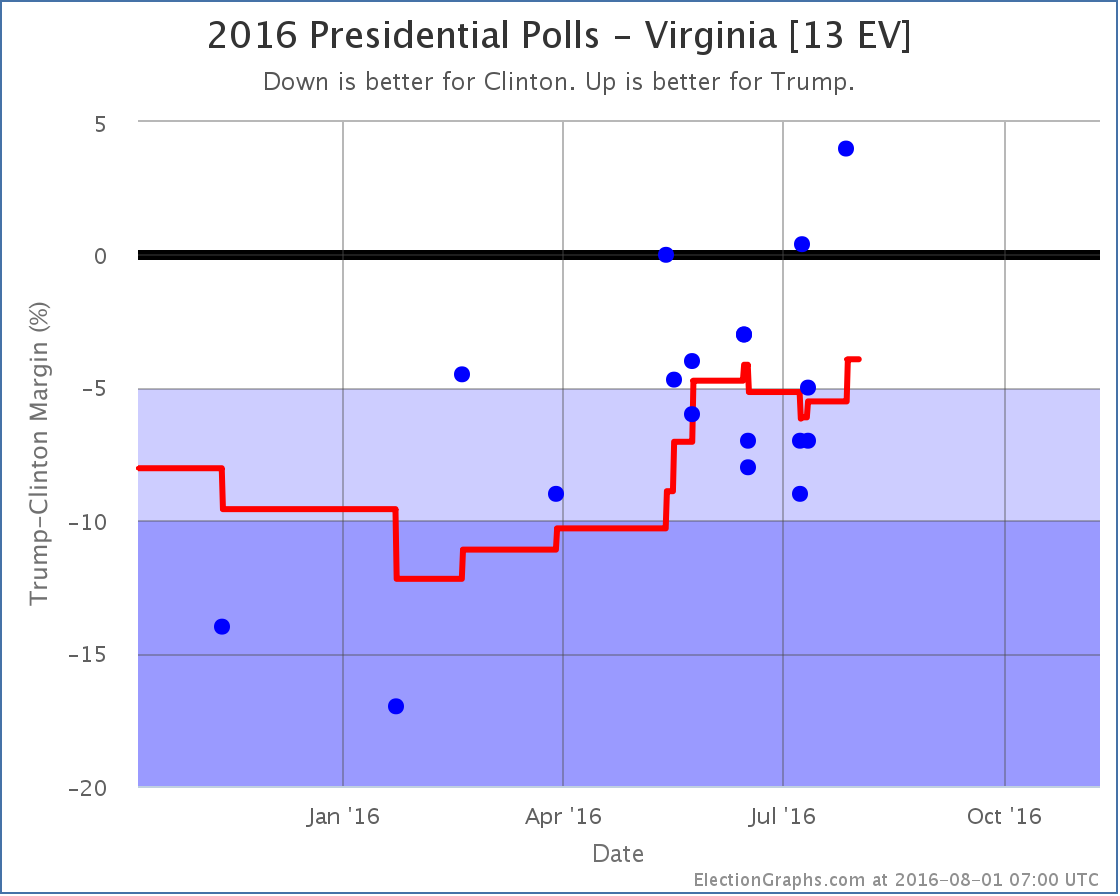
There have been tons of polls lately, but most of them didn’t cause any change to the analysis here. The exception this time was Virginia:
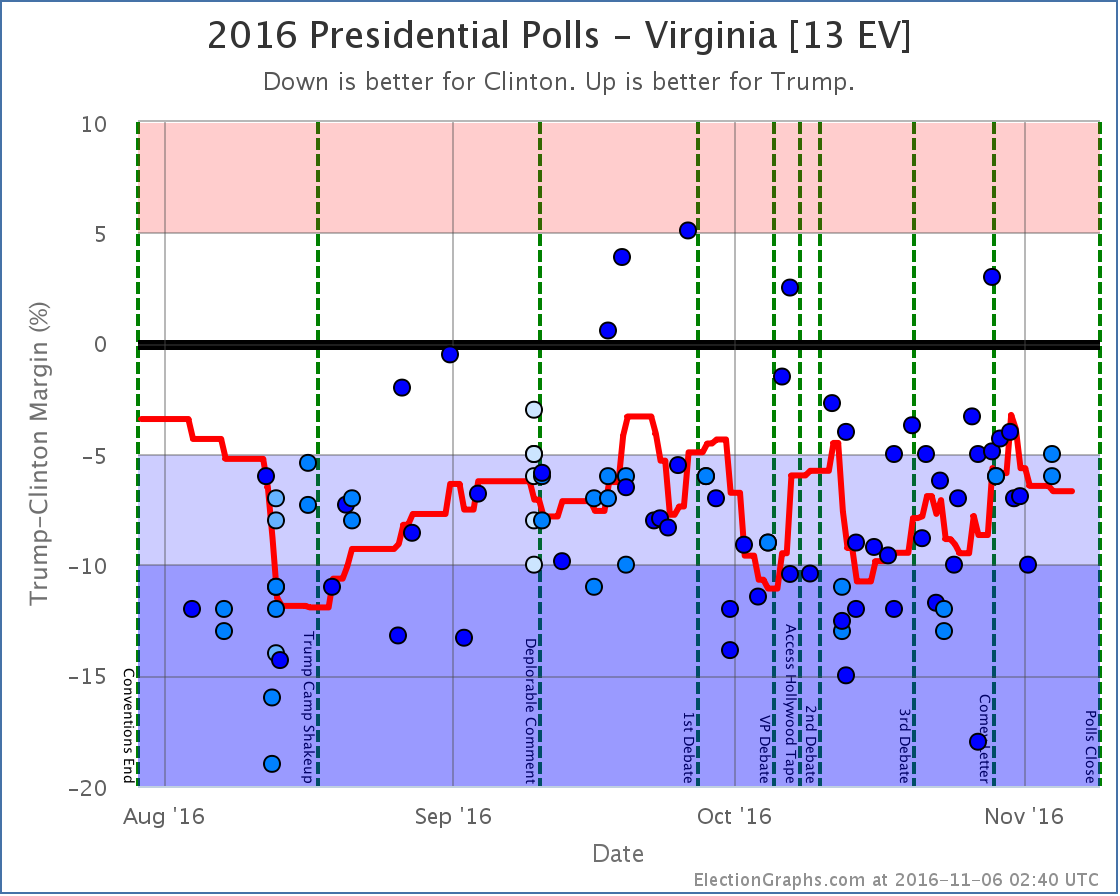
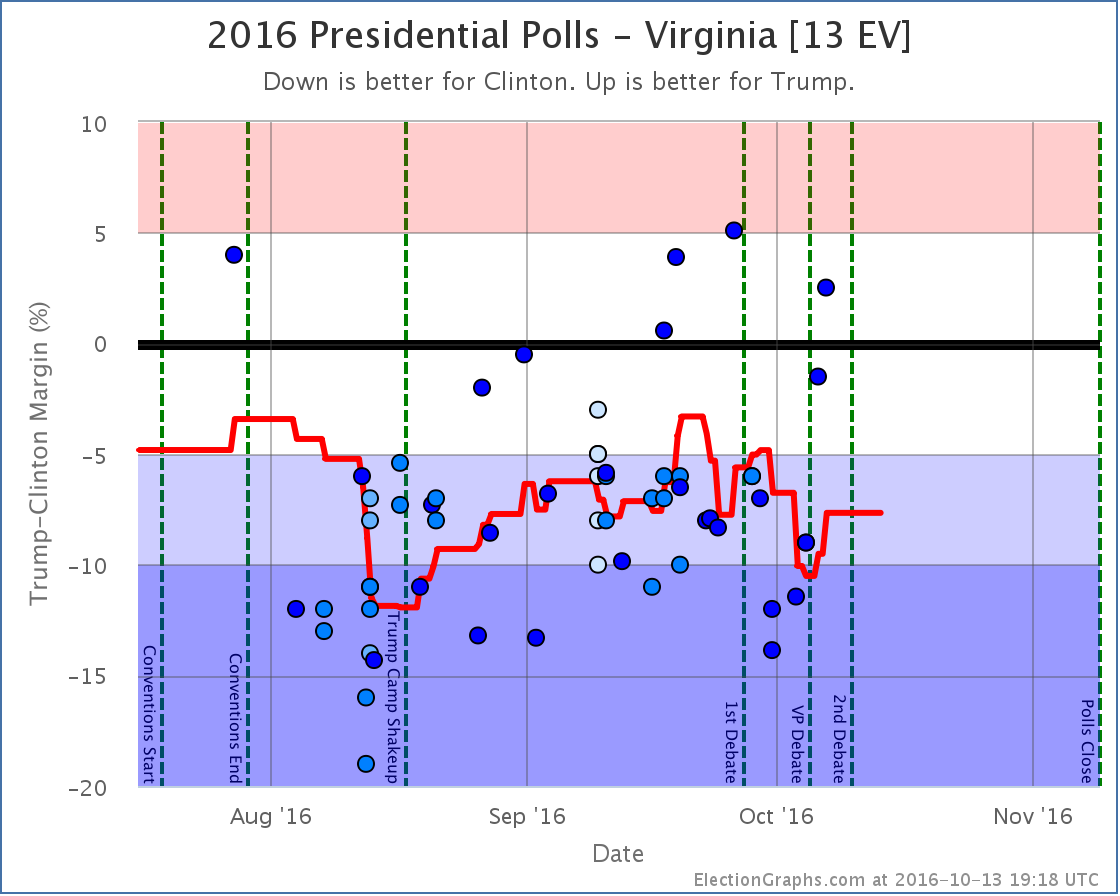
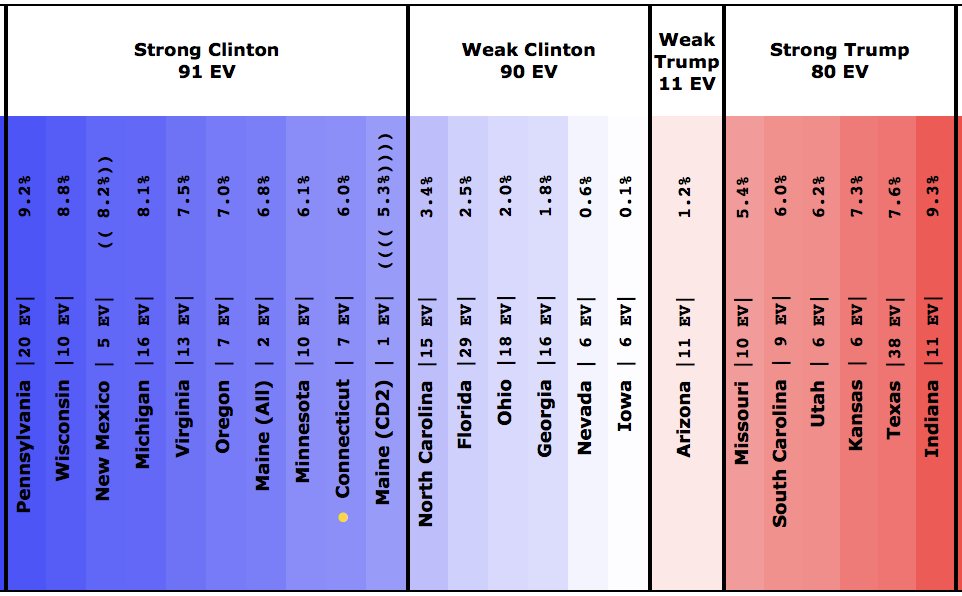
Virginia had been hovering at just about the 5% Clinton lead line since May. A poll taken during the convention weeks gave Trump his biggest lead ever in Virginia. This put Virginia on the close state list. Post convention though, both Marist and YouGov polls have shown Clinton with double digit leads. This moves the average from a 3.9% Clinton lead to a 7.5% Clinton lead.
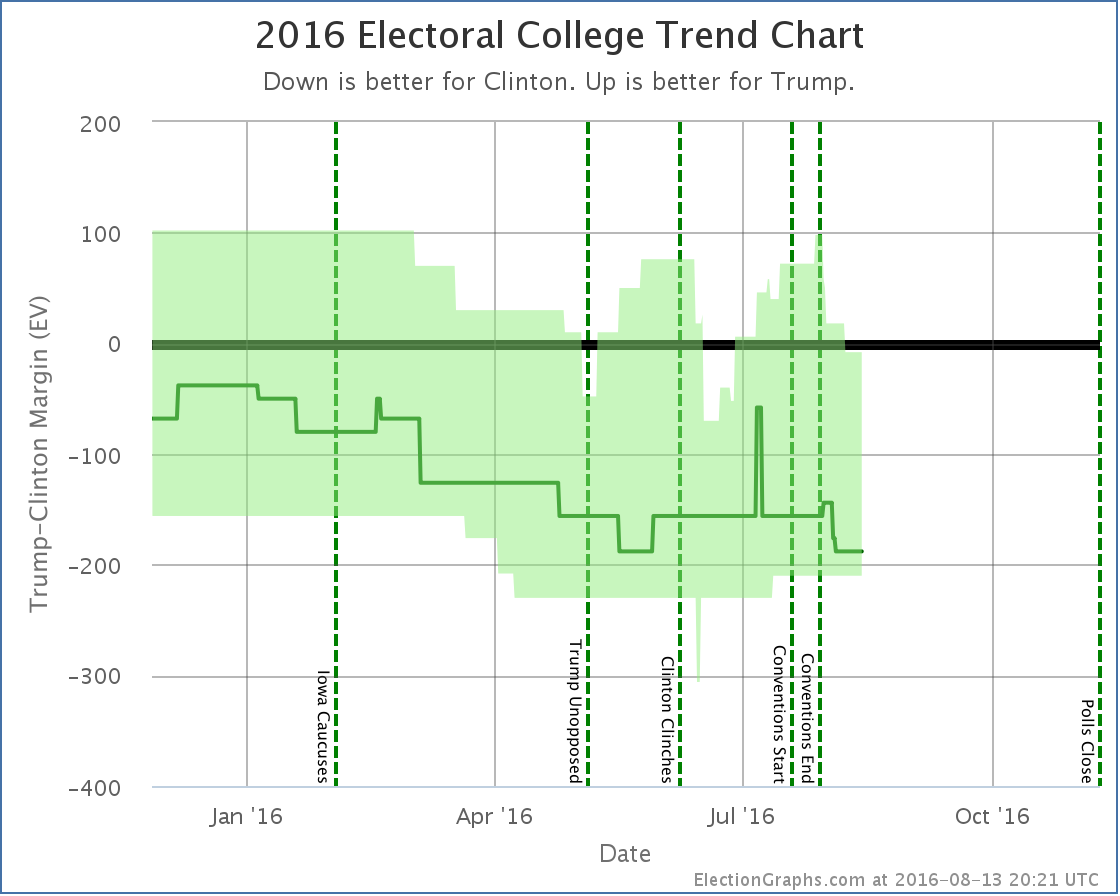
And so Virginia disappears from Trump’s “best case” where we assume he wins not only the states he leads, but also steals all the states where Clinton’s lead is under 5%.
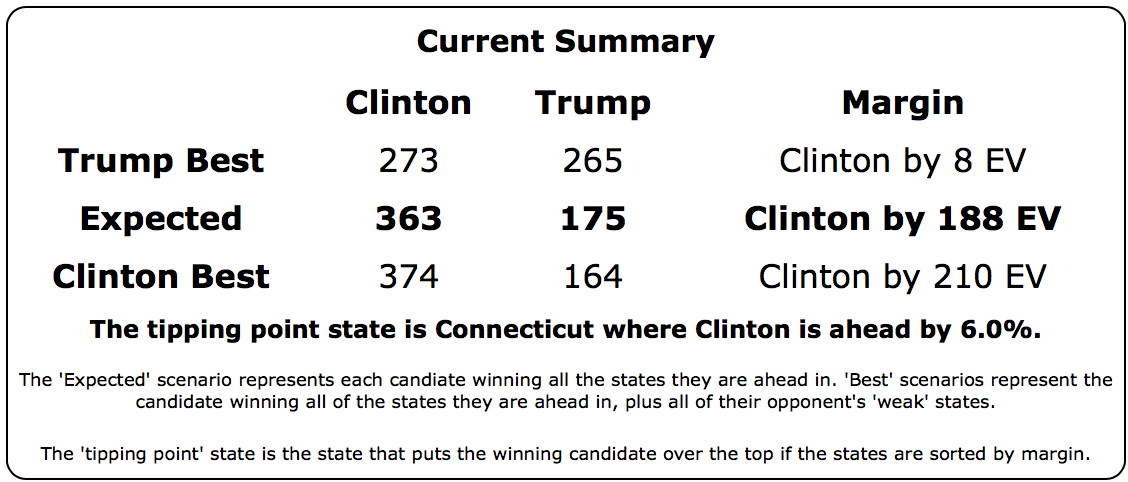
Trump’s “best case” is now to lose to Clinton by 8 electoral votes. A narrow loss, but a loss none the less. To win, Trump not only has to pull all the close states to his side, he has to start winning in some states where Clinton has a substantial lead at the moment.
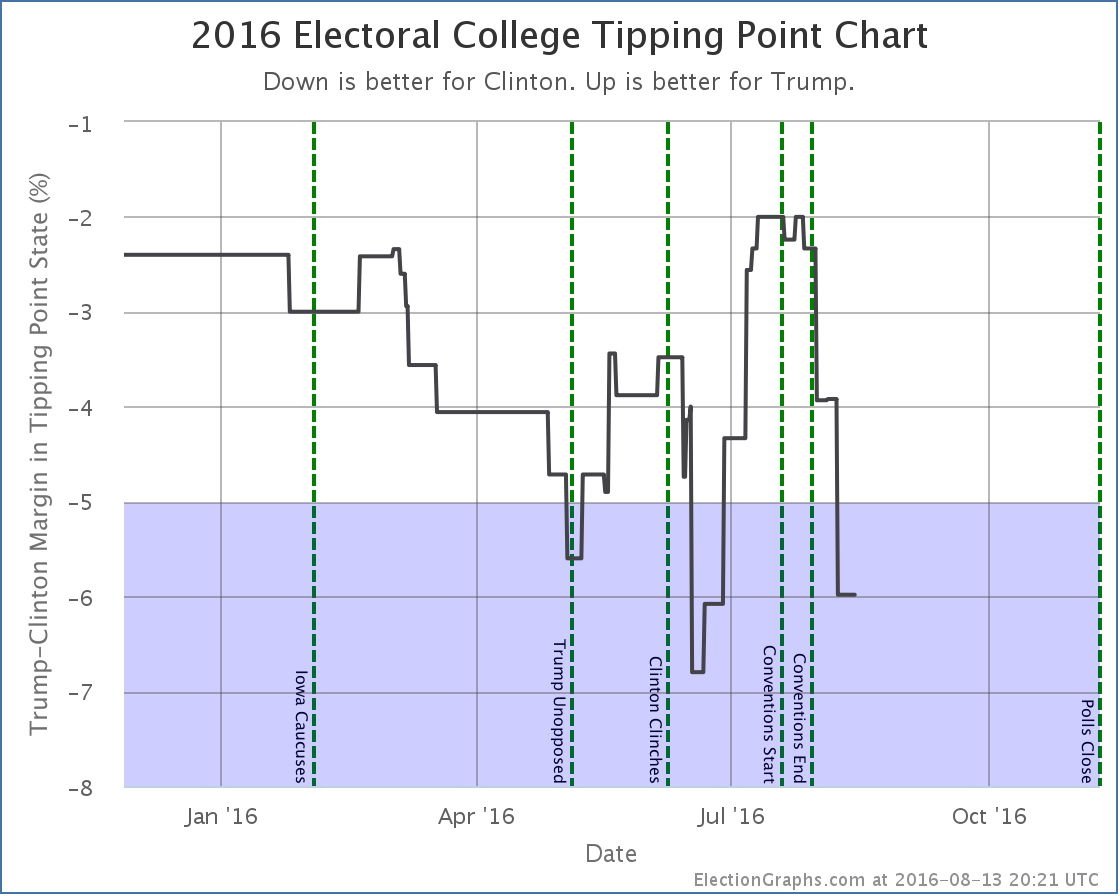
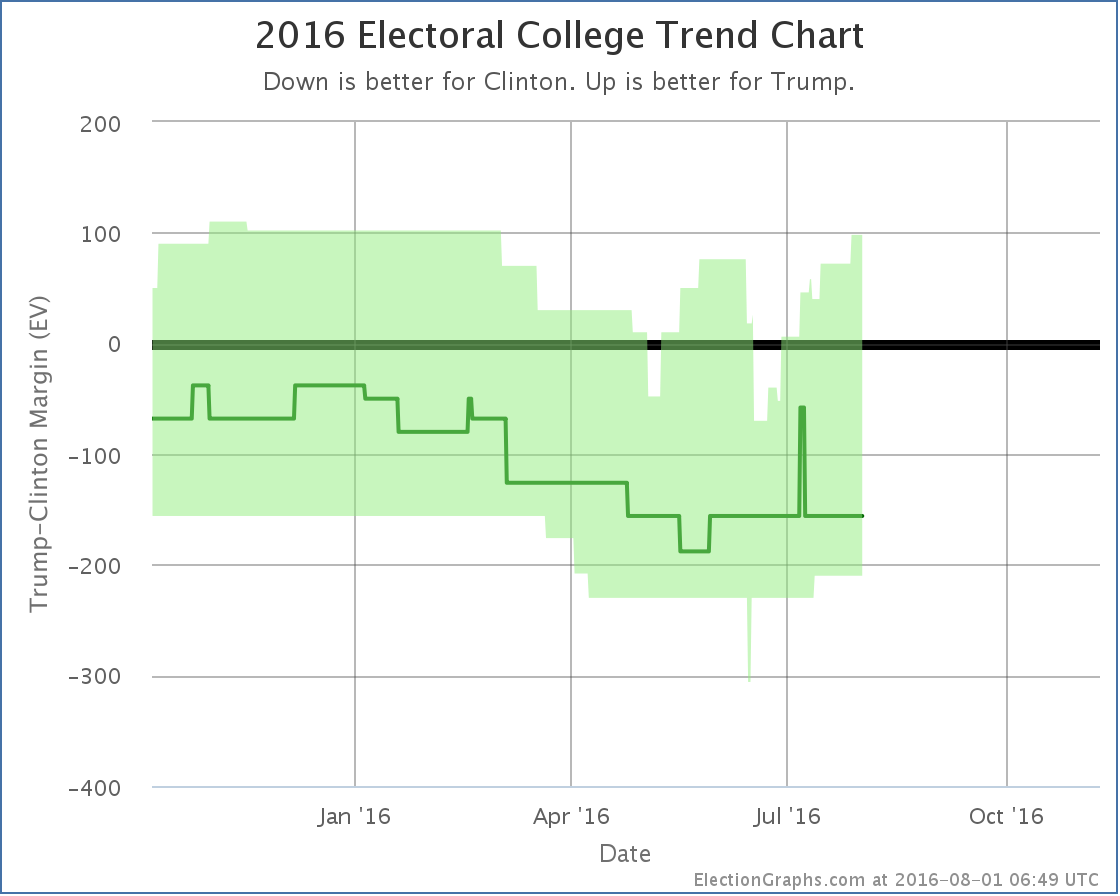
This is even more striking on the chart of the tipping point. Virginia was the tipping point, and when Clinton’s lead there moved, the tipping point also moved dramatically.
The tipping point moves from Clinton +3.9% in Virginia to Clinton +6.0% in Connecticut. Connecticut! We have a situation where it might be CONNECTICUT that puts Clinton over the edge. Not Ohio, not Florida, not any other traditional swing state… but Connecticut. Clinton’s tipping point lead still isn’t as good as it was back in mid-June, but it is getting close.
The center of the spectrum of states now looks like this:
And the national summary like this:
This isn’t a Clinton landslide, but it is looking like a very solid Clinton win. Trump needs to reverse his slide to get back in the game. Let alone to win. So far Election Graphs has NEVER shown a Trump win as the expected result, and right now isn’t even showing Trump in serious contention.
But the graphs above do show that things can swing quickly based on what is happening in the campaign and in the world. So we of course all have to keep watching. 87.1 days until polls start to close.
Opinions Wanted! For the data geeks out there, I’ve been having discussions with a few readers about how I handle it when a single pollster releases multiple results. For instance, in the case above, Marist took one poll, but asked about both Clinton vs Trump (Clinton leads by 13%), and Clinton vs Trump vs Johnson vs Stein (Clinton leads by 12%). Currently, in the interest of keeping things as simple as possible, and also of including everything, I just include both of these data points as if they were completely separate. Of course they are not. The same people were asked both questions. They are not independent results, and are usually closely grouped. So I’m in effect double weighting Marist compared to YouGov, who only released one result (Clinton vs Trump vs Johnson in this case). This also makes my normal “five poll average” often include less than five separate pollsters and cover a smaller time period than it would otherwise. Most other sites in these cases pick ONE of the reported results and ignore the others completely. There are other possible ways to handle this as well. I’m considering if I should make changes to how polls are counted on Election Graphs to address this concern, and if so which changes. If you have an opinion, please let me know in the comments or email me directly at abulsme@abulsme.com. Thanks!
Note: This post is an update based on the data on ElectionGraphs.com. Election Graphs tracks both a poll based estimate of the Electoral College and a numbers based look at the Delegate Races. All of the charts and graphs seen in this post are from that site. Additional graphs, charts and raw data can be found there. Follow @ElectionGraphs on Twitter or like Election Graphs on Facebook to see announcements of updates or to join the conversation. For those interested in individual general election poll updates, follow @ElecCollPolls on Twitter for all the polls as they are added. If you find the information in these posts interesting or useful, please consider visiting the tip jar.
States with new poll data since the last update: Missouri, Arizona, Virginia, Oklahoma
We’ve only had a couple of polls that were taken completely after both conventions, but one of them, a RABA poll in Virginia, actually makes a notable difference:
The RABA poll actually shows Trump ahead in Virginia by 4%. This is the best single result Trump has ever gotten against Clinton in Virginia, and is noticeably out of line with other recent results. This could be a real result of movement caused by the two conventions… or it could just be an outlier. In any case, we just throw it into the average with everything else for now, and Virginia moves from Clinton +5.5% to Clinton +3.9%.
This is of course under 5%, so our categorization for Virginia changes from “Strong Clinton” to “Weak Clinton” and Virginia is now considered a possible Trump pick up in his “best case”:
If Trump holds all the states he is ahead in, and then steals all the states where Clinton’s lead is less than 5%, we end up with Trump 318 to Clinton 220, a 98 electoral vote win for Trump. This is the best best case Trump has seen since early March.
Trump is succeeding in making a lot of states close, but so far has not had much success in actually dragging them over the line to his side. The “expected case” remains stubbornly stuck at Clinton 347, Trump 191, a 156 electoral vote win for Clinton.
We have now broken the 100 day barrier. 99.4 days left until the polls start to close on Election Day.
Note: This post is an update based on the data on ElectionGraphs.com. Election Graphs tracks both a poll based estimate of the Electoral College and a numbers based look at the Delegate Races. All of the charts and graphs seen in this post are from that site. Additional graphs, charts and raw data can be found there. Follow @ElectionGraphs on Twitter or like Election Graphs on Facebook to see announcements of updates or to join the conversation. For those interested in individual general election poll updates, follow @ElecCollPolls on Twitter for all the polls as they are added. If you find the information in these posts interesting or useful, please consider visiting the tip jar.