On Saturday we got results from the Northern Mariana Islands. A whopping 6 delegates were at stake, so this almost wasn’t worth its own post, but here goes. Then we’ll follow it up with a quick comparison with 2008 and 2012.
Clinton won 4 delegates. Sanders won 2.
Since the post on the Michigan results between Michigan finalizing results and superdelegate preferences we have an additional net change of Clinton +2, Sanders -1.
So since the Michigan post, a total of Clinton +6, Sanders +1. So 85.71% of delegates to Clinton, way more than the 38.96% she needed to be on the glide path to the nomination.
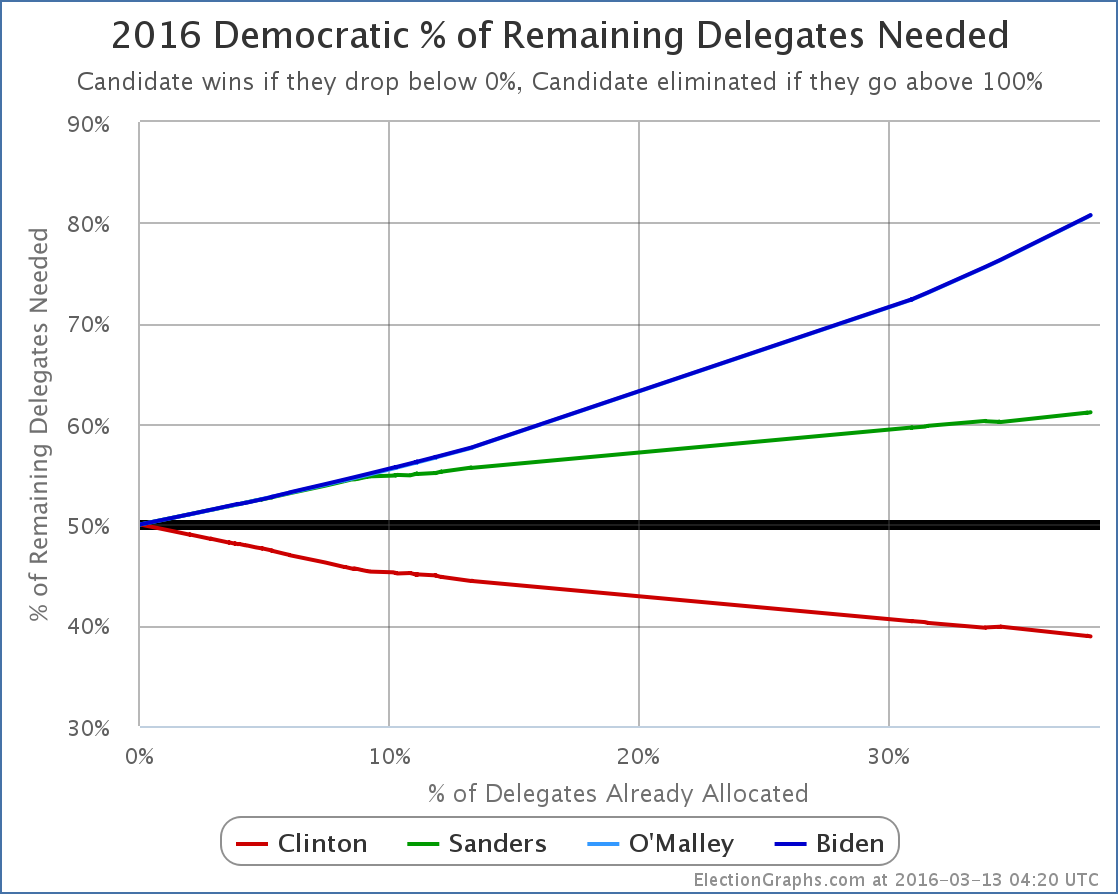
Clinton now needs 38.90% of the remaining delegates to win. Or more if a large number of superdelegates start to defect. But that hasn’t happened yet.
Yawn.
OK, since not much happening there, just a quick comparison of where Clinton and Sanders’ “% of remaining needed to win” is compared to Obama’s at similar points in 2008 and 2012. (For clarity, I’ve eliminated some oddness in the chart at the very end of the 2008 line when delegates were restored to states that had been stripped of them for rules violations and such.)
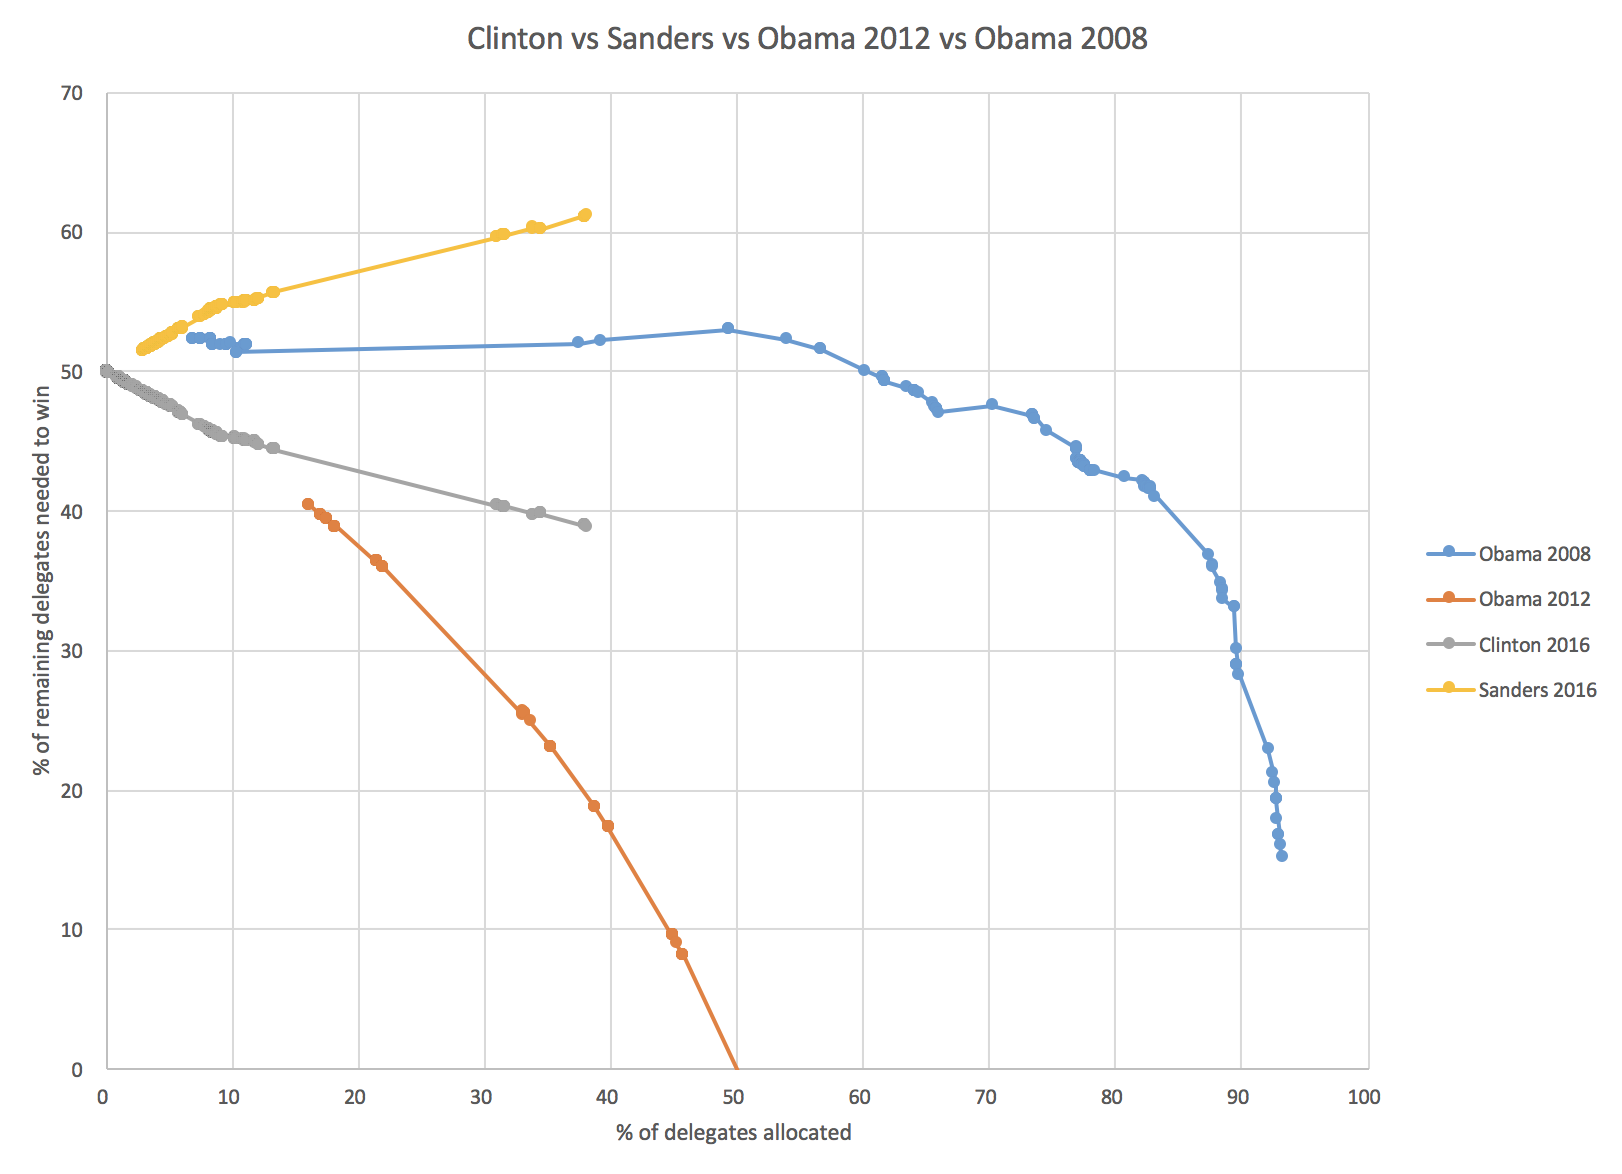
The blue line is Obama in 2008. At this point he was still behind! He needed about 52% of the remaining delegates to win. He managed that of course, and ended up winning. Because of the competition from Clinton, Obama did not clinch the nomination until about 96% of the delegates had been determined.
The orange line was Obama in 2012 when he was unopposed. Aside from a few random protest delegates here and there he essentially collected 100% of delegates as soon as they became available, and clinched at the 50% mark.
Clinton 2016 so far is neatly splitting the difference. She is far far ahead of where Obama was in 2008, but of course not doing as well as she would if she was unopposed.
And then Sanders 2016. Notice that while Obama was behind at this stage, he was basically holding steady. He was not getting further and further behind with each new primary or caucus. Then right around when he hit the 50% mark, he started winning decisively, and caught up and won. Sanders is not holding the line. He is not keeping up. He keeps falling further and further behind the pace he would need to catch up and win. This is not what a come from behind victory looks like. This is what a stay behind loss looks like.
Of course if Sanders started winning every contest from here on out by large margins, then Clinton superdelegates might start abandoning her in droves and this graph COULD still change rapidly. If and when that happens, we’ll see it. But it hasn’t happened yet, and the longer this goes on, the less likely that becomes. It would require a DRAMATIC change in the the race. As I’ve said before, we’re talking something on the order of a new Clinton scandal that even Clinton die-hards think is disqualifying, or a major Clinton health issue, not just Sanders doing well and winning a few states.
[Update 2016-03-15 05:07 UTC – Revision to Kansas delegate results, plus superdelegate changes. Net: Clinton +4, Sanders +1]
[Update 2016-03-16 00:31 UTC – Superdelegate changes. Net: Clinton -1]
Note: This post is an update based on the data on ElectionGraphs.com. Election Graphs tracks both a poll based estimate of the Electoral College and a numbers based look at the Delegate Races. All of the charts and graphs seen in this post are from that site. Additional graphs, charts and raw data can be found there. All charts above are clickable to go to the current version of the detail page the chart is from, which may contain more up to date information than the snapshots on this page, which were current as of the time of this post. Follow @ElectionGraphs on Twitter or like Election Graphs on Facebook to see announcements of updates or to join the conversation. For those interested in individual general election poll updates, follow @ElecCollPolls on Twitter for all the polls as they are added.