This is the website of Abulsme Noibatno Itramne (also known as Sam Minter).
Posts here are rare these days. For current stuff, follow me on Mastodon
|
Clinton clinched the nomination last week, but DC still hadn’t voted. Now they have.
Clinton got 16 delegates, Sanders got 4.
Since last week when I posted the CA/NJ/NM/MT/SD/ND results, we had updates from CA/NJ/SD as well as many to superdelegate preferences. The net result of all of these was Clinton +7, Sanders +5.
So net change since last week: Clinton +23, Sanders +9.
All the caucuses and primaries are now over. There are still 116 superdelegates who have not expressed a preference publicly, but what they do at this point no longer matters to the nomination. Similarly, while it is possible that the superdelegates who have already supported someone could change their minds, it is unlikely to happen in significant numbers absent an earthshaking surprise.
So we are done.
Lets look at the updated graphs:
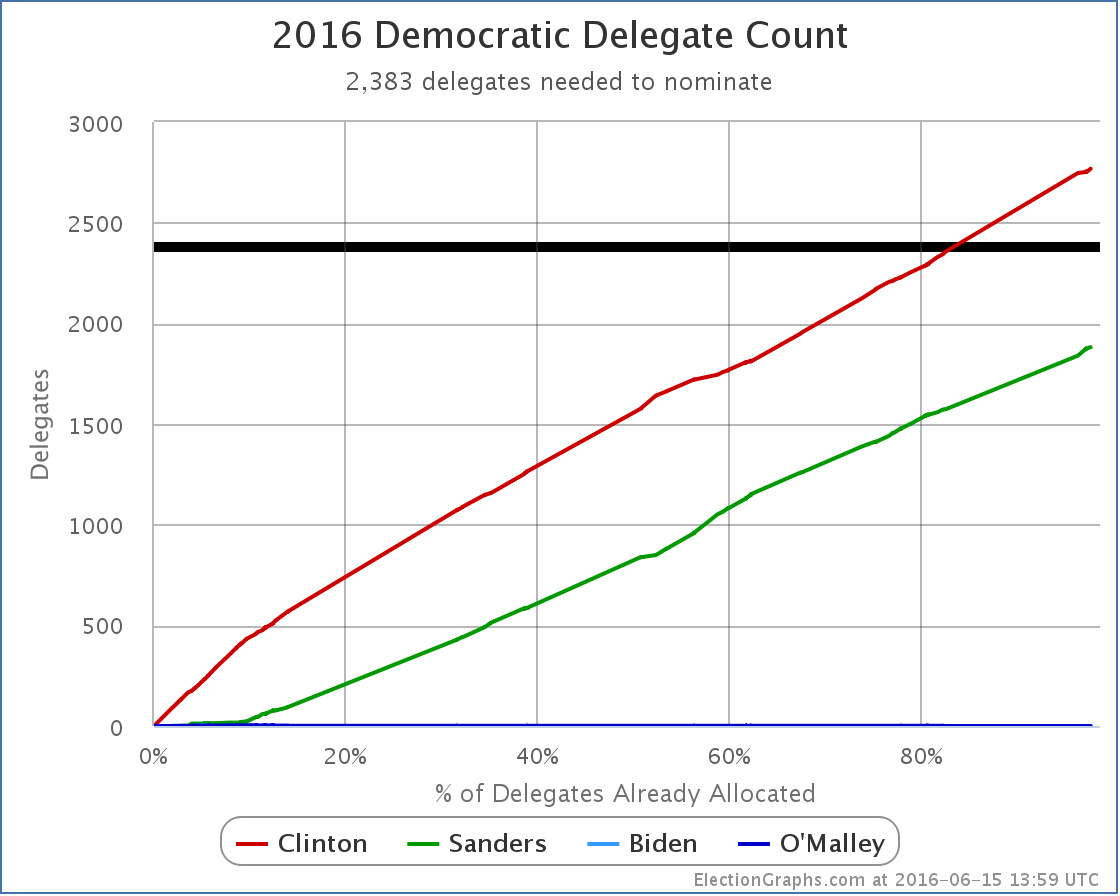
The delegate count is now: Clinton 2768, Sanders 1881, with 116 TBD.

Clinton now has 59.54% of the delegates, Sanders has 40.46%.
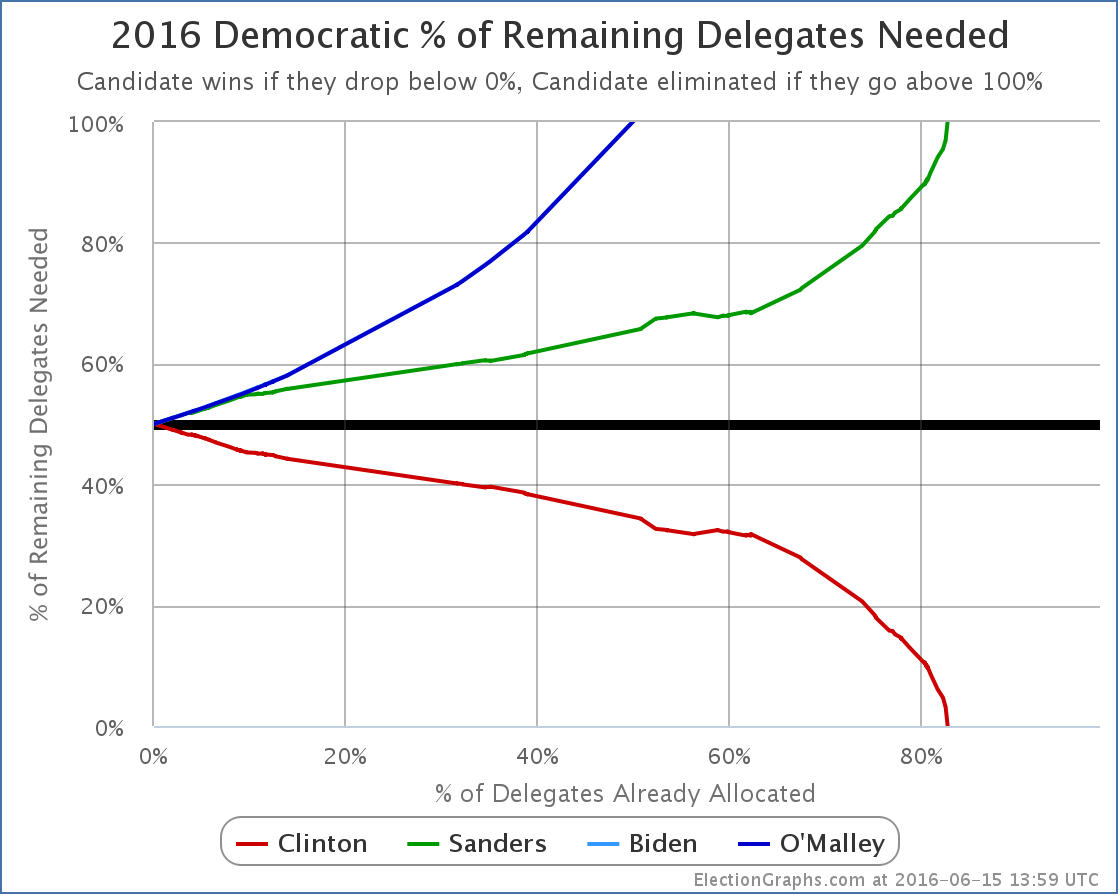
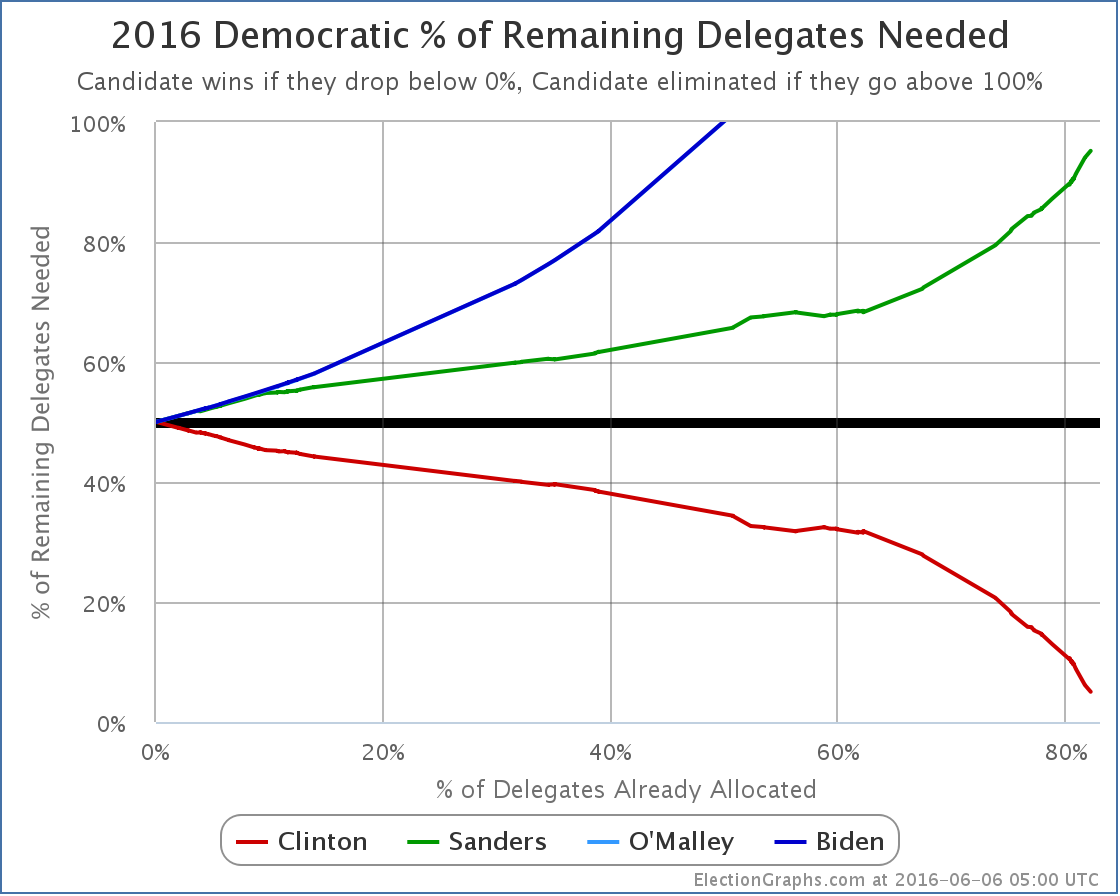
It didn’t change with the DC results since the race was already won, but here again is the “% remaining needed to win” chart.
There isn’t much else to see here absent unexpected craziness. I gave my thoughts wrapping up the Democratic race last week. If there are any additional developments you will see them here. But aside from straggler superdelegates revealing their preferences, nothing of significance is expected.
The Republicans are done too of course.
We have Clinton vs Trump. It is time to settle down and get comfortable for the general election coverage.
146.4 days until the polls start to close on Election Day 2016. Buckle up!
Update 2016-06-18 16:19 UTC – Superdelegate update: Clinton +12, Sanders -1.
Update 2016-06-22 15:47 UTC – Superdelegate update: Clinton +3.
Update 2016-06-22 15:48 UTC – Update from California: Clinton -8, Sanders +8.
Update 2016-06-24 17:06 UTC – Superdelegate update: Clinton +2.
Update 2016-06-28 06:39 UTC – Superdelegate update: Some shuffles, but zero net change.
Update 2016-06-30 06:00 UTC – Update from California. Net change: Clinton -1, Sanders +1
Update 2016-07-01 05:00 UTC – Update from California. Net change: Clinton -1, Sanders +1
Update 2016-07-10 16:00 UTC – Update from California and the Virgin Islands. Net Change: Clinton -1, Sanders +2
Update 2016-07-12 03:33 UTC – Superdelegate update: Clinton +2
Update 2016-07-13 03:56 UTC – Superdelegate update: Net change Clinton +1, Sanders -1. This is Sanders endorsing Clinton.
Update 2016-07-17 15:30 UTC – Superdelegate update: Clinton +3. Update from Puerto Rico: Clinton +1, Sanders -1
Update 2016-07-18 14:25 UTC – Superdelegate update: Clinton +1.5, Sanders -1.5
Update 2016-07-20 07:27 UTC – Superdelegate update: Clinton +2, Sanders -1
Update 2016-07-21 15:56 UTC – Superdelegate update: Clinton -1. This was due to Rep Takai (HI) dying, so total number of delegates also -1.
Update 2016-07-26 07:27 UTC – Final superdelegate update: Net change Clinton +1. This makes the final totals Clinton 2782.5, Sanders 1889.5. Next update will be the convention roll call.
Update 2016-07-28 15:34 UTC – Actual convention roll call results were Clinton 2842, Sanders 1865, DNV 56. So Clinton gained 59.5 delegates while Sanders lost 24.5 delegates compared to the last estimates here.
Note: This post is an update based on the data on ElectionGraphs.com. Election Graphs tracks both a poll based estimate of the Electoral College and a numbers based look at the Delegate Races. All of the charts and graphs seen in this post are from that site. Additional graphs, charts and raw data can be found there. Follow @ElectionGraphs on Twitter or like Election Graphs on Facebook to see announcements of updates or to join the conversation. For those interested in individual general election poll updates, follow @ElecCollPolls on Twitter for all the polls as they are added. If you find the information in these posts interesting or useful, please consider visiting the tip jar.
Trump clinched the nomination a week and a half ago but there were a few more contests left. CA/NJ/SD/MT/NM have now weighed in with their 303 delegates. Trump got all 303. As an unopposed candidate at this point, this is not unexpected.
And while the Democrats still have DC left, this is the end of the primary process on the Republican side. There are still 18 uncommitted delegates whose preferences are unknown, but their decisions at this point won’t change much.
Lets look quickly at the updated graphs:
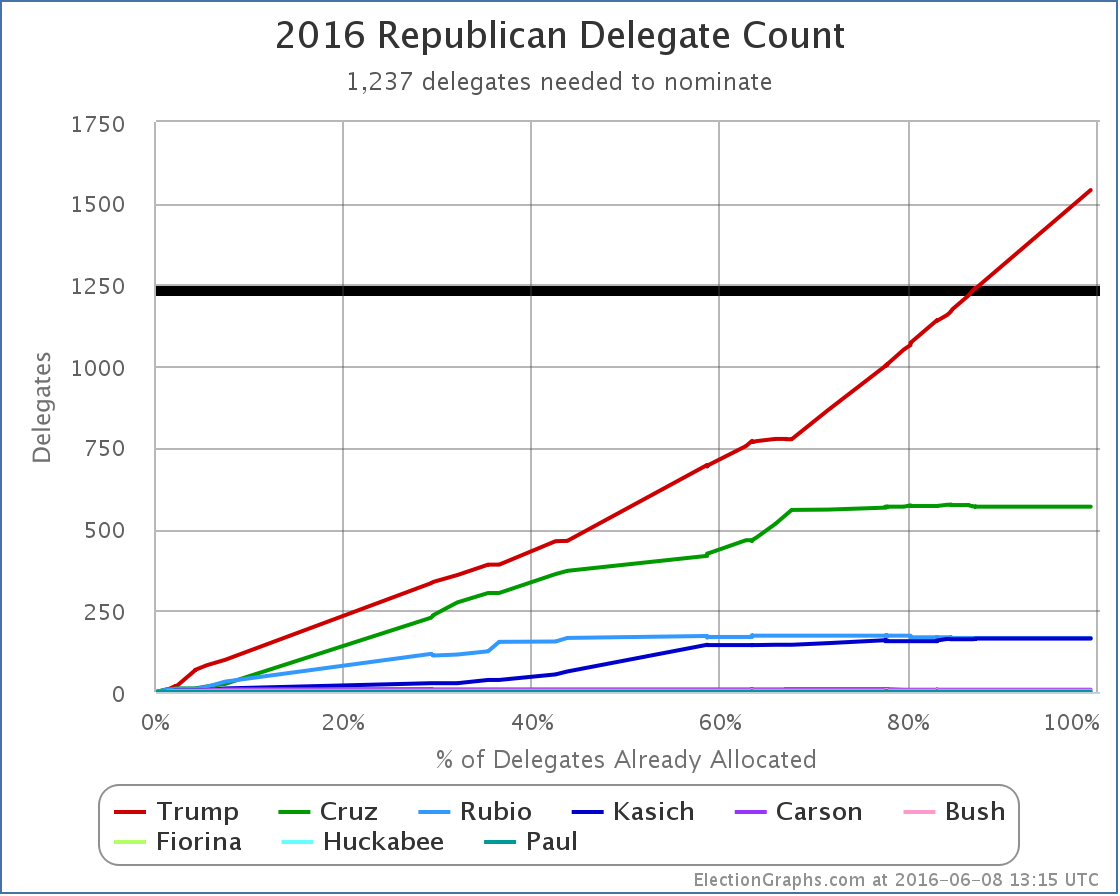
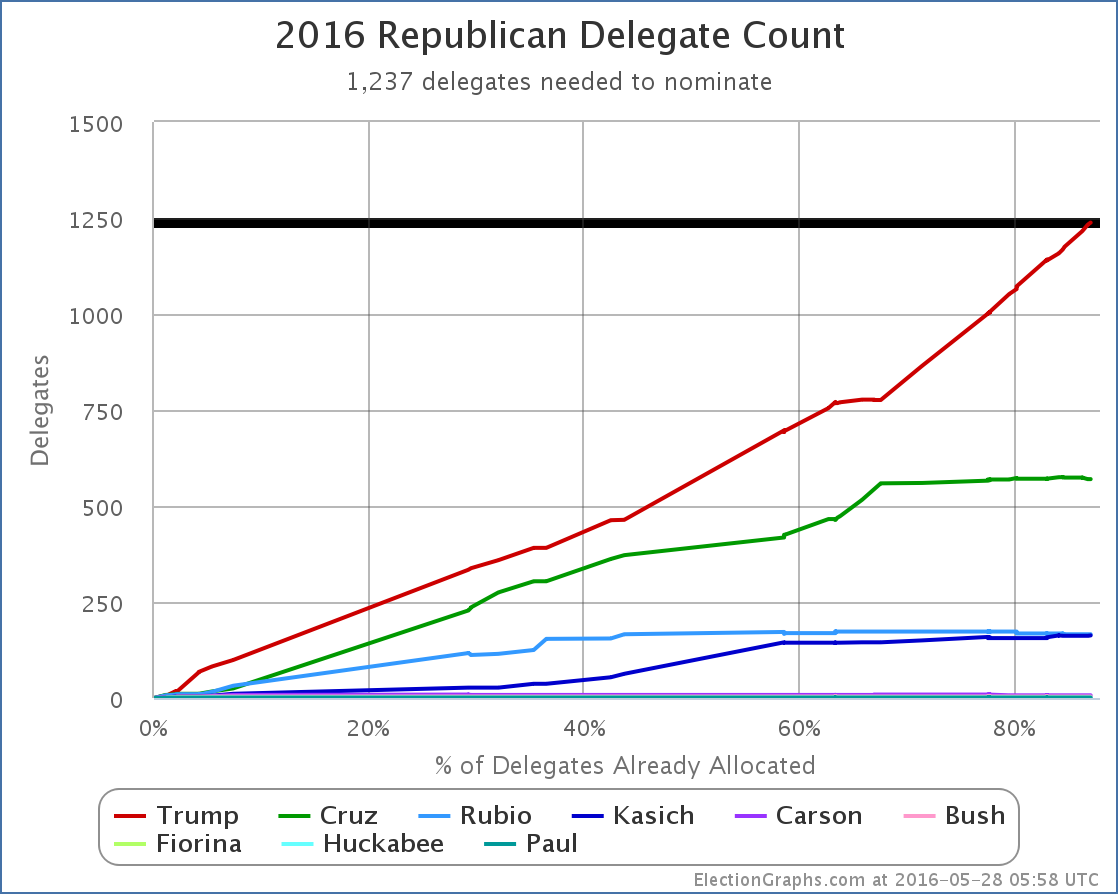
With this update Trump moves from just barely over the “magic number” to well over it with plenty of room to spare. The delegate count is now: Trump 1541, Cruz 569, Rubio 166, Kasich 164, Carson 7, Bush 4, Fiorina 1, Huckabee 1, Paul 1.
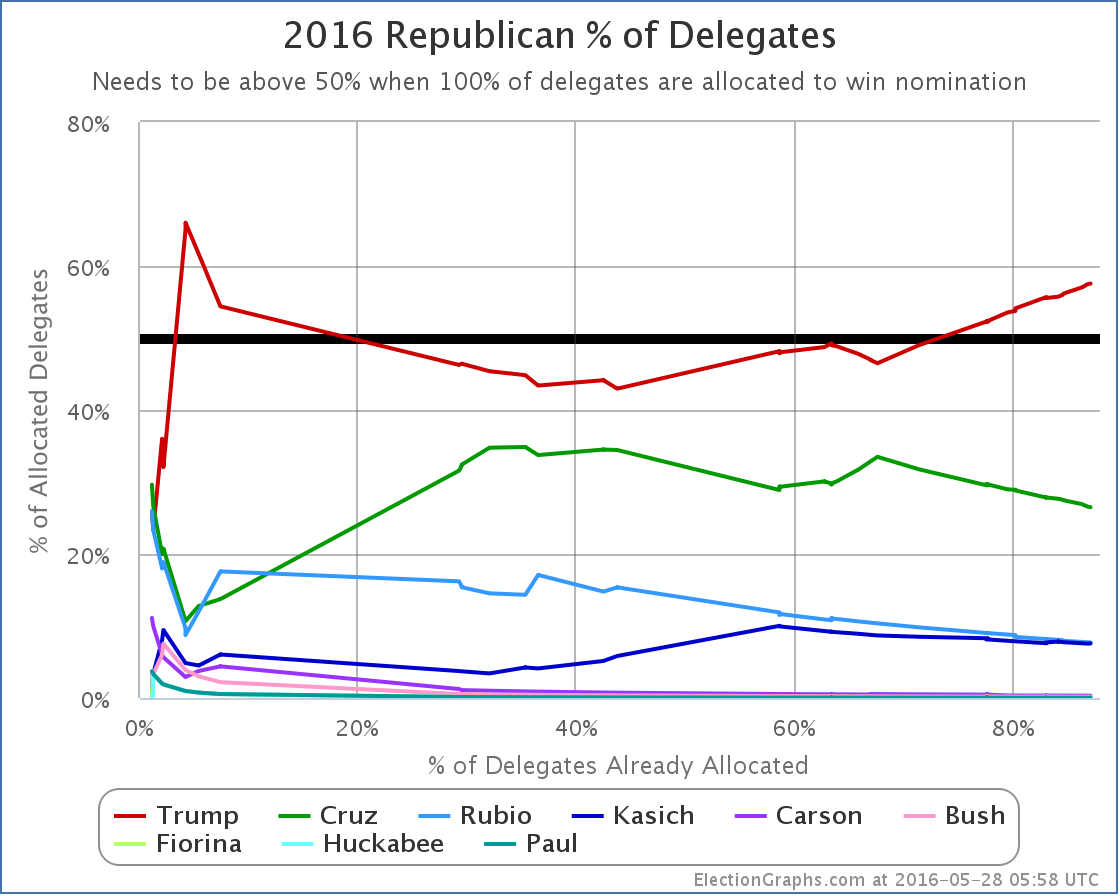
Trump now has 62.80% of the delegates allocated so far.
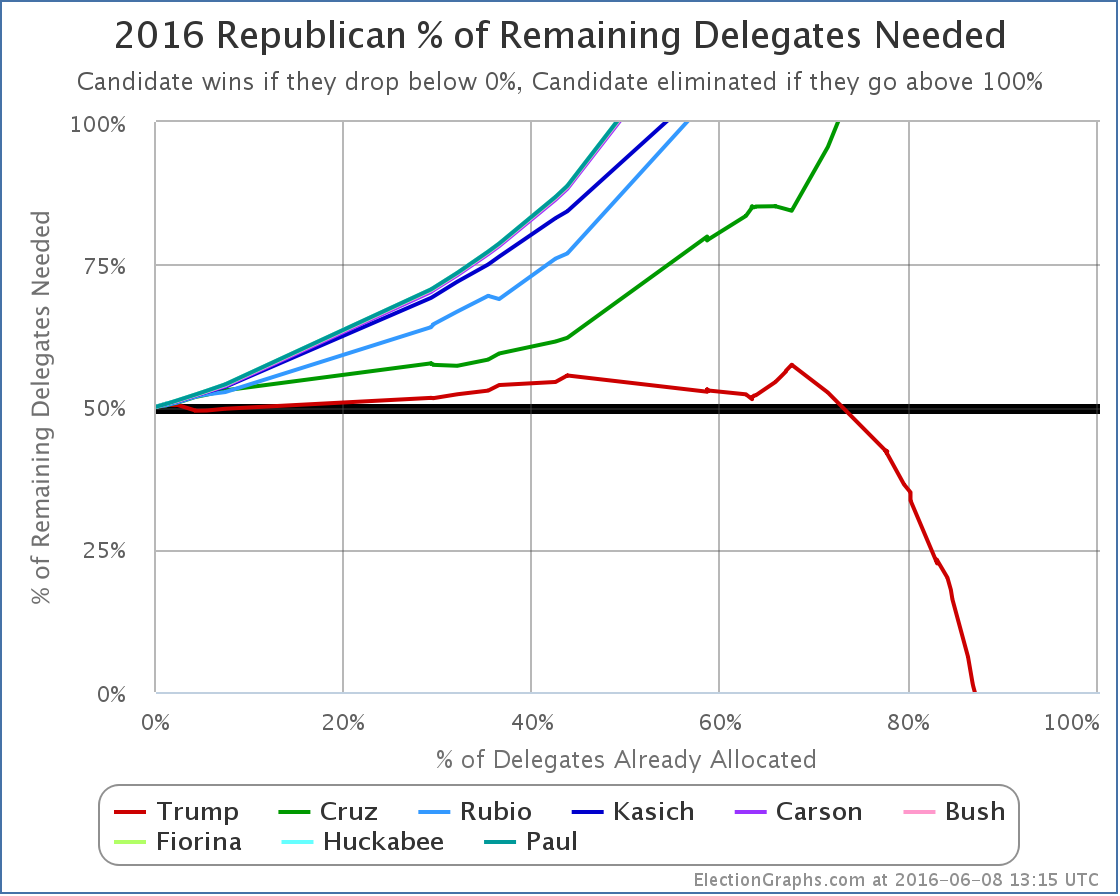
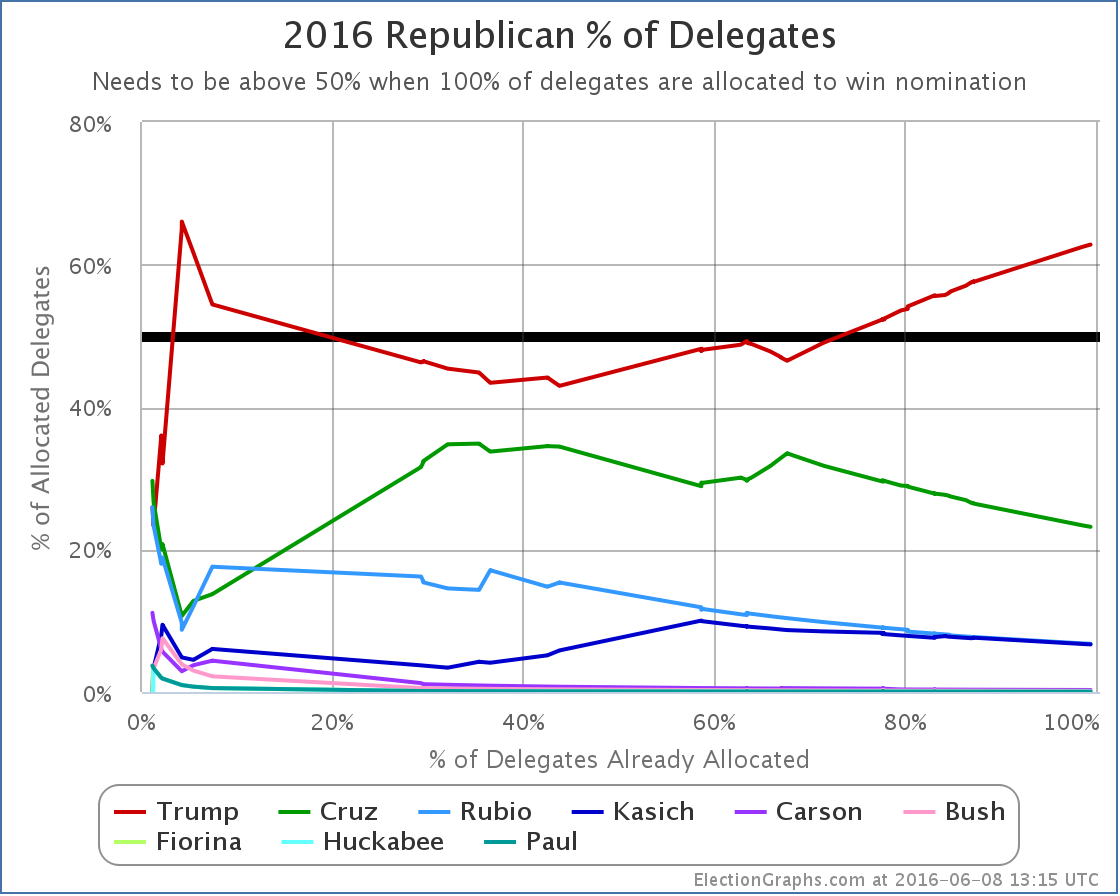
And just for reference, the “% needed to win” in final form.
There isn’t much more to say since this race is over minus any unexpected craziness. If there are any additional developments of note, we’ll update accordingly, but none is expected at the moment.
Time to concentrate on the general election.
Update 2016-06-30 06:00 UTC – Update from Vermont. Net change Kasich -1, Paul +1. (A Kasich delegate who considered themselves free after Kasich dropped out pledged his support to Paul.)
Update 2016-07-20 07:19 UTC: Final Election Graphs estimate was Trump 1541, Cruz 569, Rubio 166, Kasich 163, Carson 7, Bush 4, Paul 2, Fiorina 1, Huckabee 1, TBD 18. We now have the official roll call from the Republican National Convention: Trump 1725, Cruz 484, Kasich 125, Rubio 123, Carson 7, Bush 3, Paul 2, DNV 3. Differences were due to the application of rules in some states requiring all votes to go to candidates that were actually nominated (only Trump was officially nominated at the convention) and movement of additional uncommitted delegates to Trump.
Note: This post is an update based on the data on ElectionGraphs.com. Election Graphs tracks both a poll based estimate of the Electoral College and a numbers based look at the Delegate Races. All of the charts and graphs seen in this post are from that site. Additional graphs, charts and raw data can be found there. Follow @ElectionGraphs on Twitter or like Election Graphs on Facebook to see announcements of updates or to join the conversation. For those interested in individual general election poll updates, follow @ElecCollPolls on Twitter for all the polls as they are added. If you find the information in these posts interesting or useful, please consider visiting the tip jar.
By the Election Graphs count, Clinton now has 2745 delegates, which puts her well over the 2383 require to clinch the nomination.
As they did with the Republicans, AP went out and called many still publicly uncommitted superdelegates and was able to get the winning candidate to the magic number in their count a little earlier than those of us only using public commitments. In this case AP made their announcement Monday. The count here went over the magic number within minutes of the polls closing in New Jersey Tuesday night.
As of the writing of this post, all but 4 straggling delegates from New Jersey out of the 694 delegates up for grabs last night seem to be reasonably determined, so lets run down then numbers.
After Puerto Rico, Clinton only needed 5.05% of the remaining delegates to win. Sanders needed 95.19% of the remaining delegates. Clinton needed 43 delegates, Sanders needed 811.
In CA/NJ/NM/MT/SD/ND Clinton got 391 delegates while Sanders got 299. (As mentioned, there are still 4 TBD from NJ as of this writing.)
In the days between Puerto Rico and the June 7th results coming in, superdelegate changes yielded a net change of: Clinton +14, Sanders +1, O’Malley -1. Yes, that lone O’Malley superdelegate finally flipped… to Clinton.
Total change since Puerto Rico: Clinton +405, Sanders +300, O’Malley -1
That is Clinton 57.53%, Sanders 42.61%. (Adds to more than 100% because Clinton took the one delegate from O’Malley.)
So Clinton met her target, Sanders did not.
405 delegates is significantly more than the 43 delegates Clinton needed to go over the top.
She clinches. She is the presumptive nominee.
Lets check out the updated graphs:

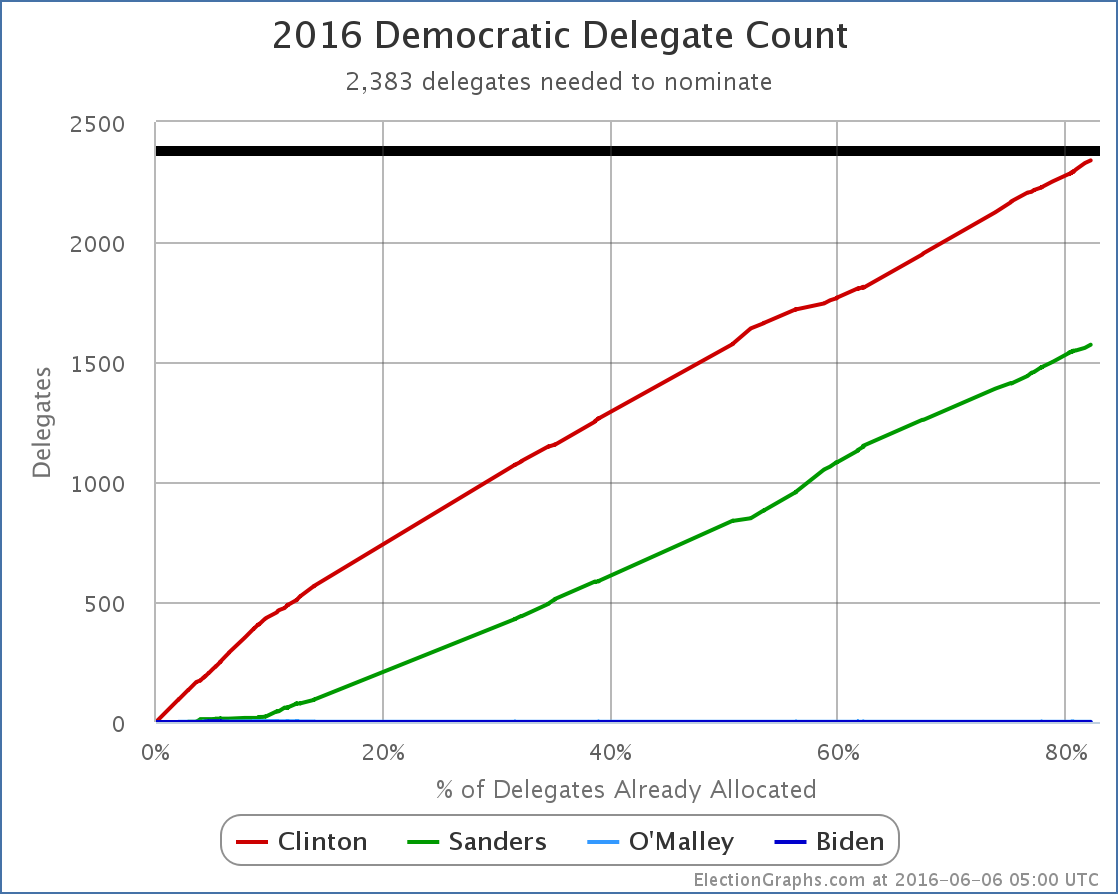
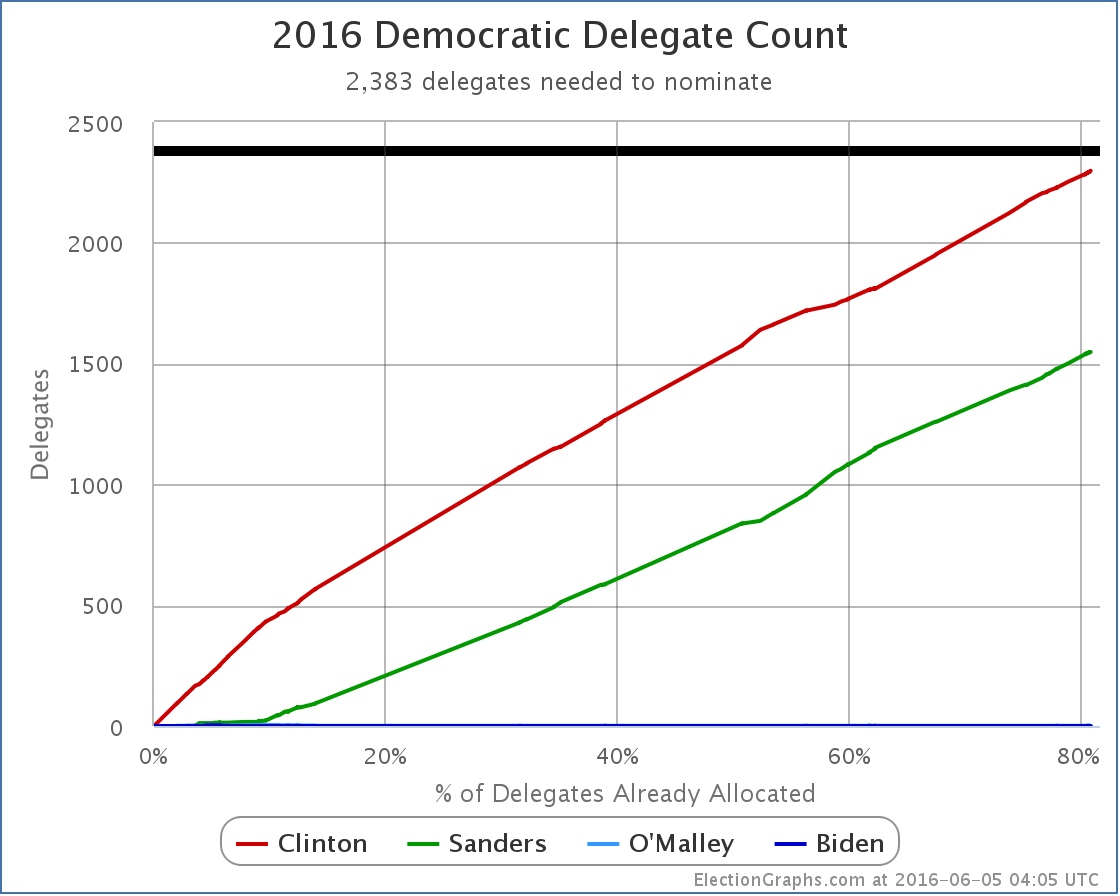
New delegate totals: Clinton 2745, Sanders 1872. Clinton blows past 2383 and is now well beyond where she needed to get.
There are 148 delegates left. Washington DC has 20 up for grabs next week. There are those 4 from New Jersey too. The other 124 are superdelegates who have not yet stated a preference. Clinton needs none of these delegates. Sanders could get every single one of these delegates, and would still lose decisively.
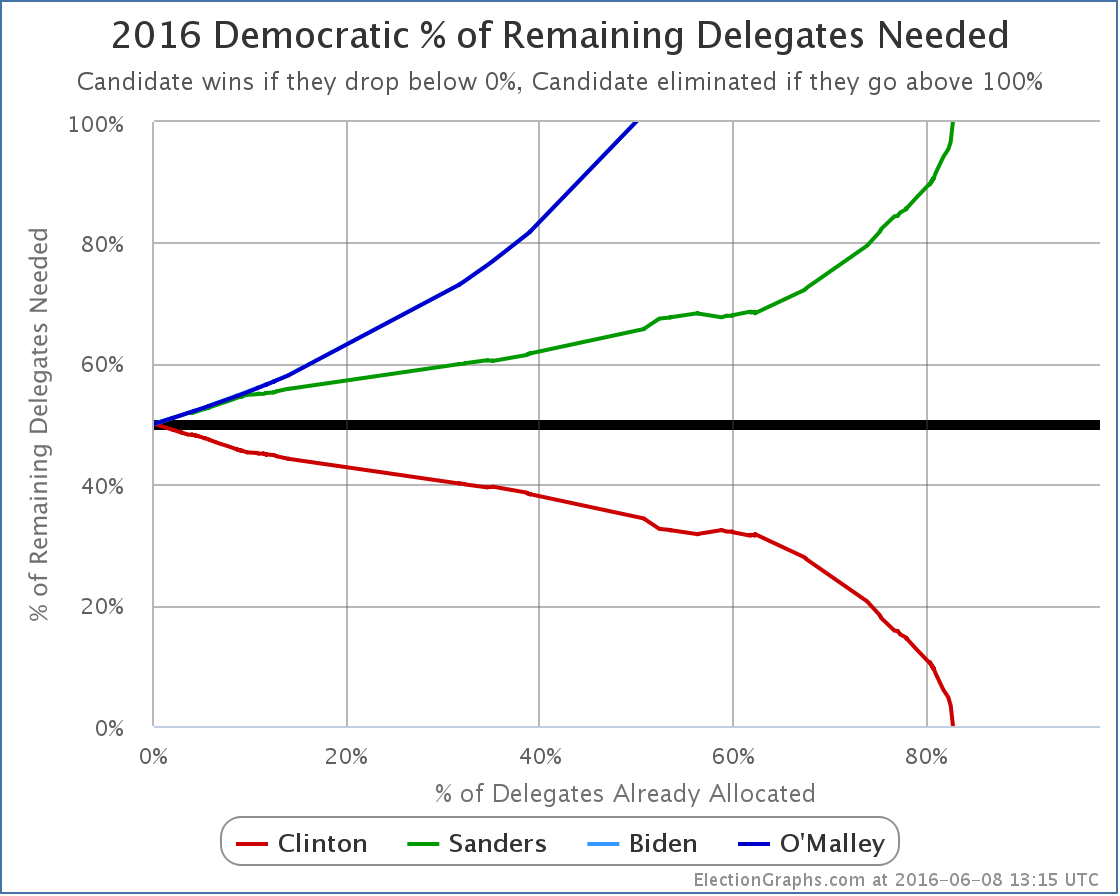
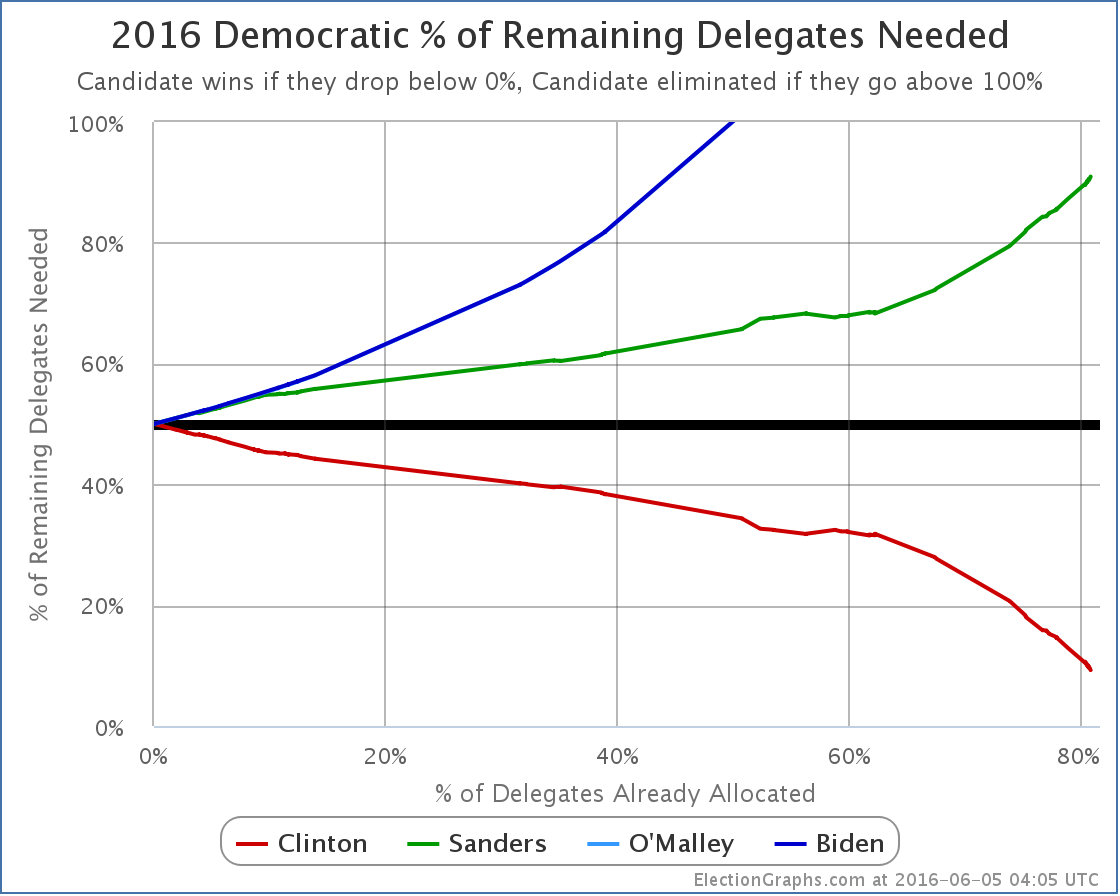
The “% of delegates needed to win” chart is complete. Clinton dropped below 0%, Sanders went above 100%.
One more graph:
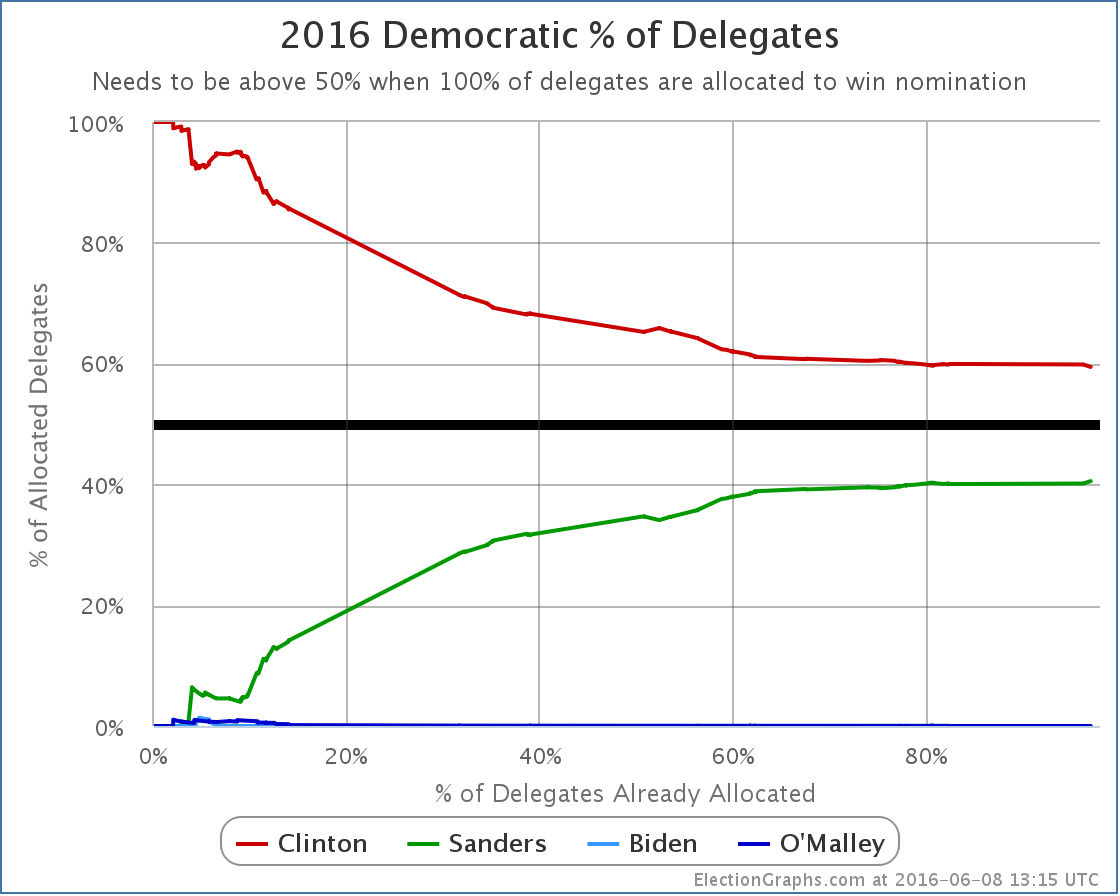
Since she started at 100% of the delegates by getting superdelegates before the first primaries or caucuses even happened, Clinton’s “% of delegates” number of course trended downward through most of the cycle. But for quite some time now the delegate race has stuck pretty close to being a 60% to 40% split in Clinton’s favor. As of now, it sits at Clinton 59.45%, Sanders 40.55%.
OK, now to step back a little…
Clinton dominated this race from the beginning. There were only a handful of moments where Sanders even managed to close the gap a little bit. Sanders was never even close. It was clear since the beginning of March… at the latest… that is being generous… it was fairly clear even before that… that Sanders catching up would take a miracle. The one thing that has been amazing throughout the primary process is the ability of many Sanders supporters to be in complete denial about this in the face of overwhelming evidence. It is one thing to be enthusiastic about your candidate and even to hope for that miracle, but it is another thing to not even recognize that you are losing and that it would indeed take that miracle to win.
And yes, some of those Sanders folks are still in denial even now. Because superdelegates. So a quick look. Right now we have Clinton 2745, Sanders 1872. There are 124 remaining superdelegates. Lets give them all to Sanders. For fun give Sanders all 20 DC delegates and the 4 from New Jersey too. Now we have Clinton 2745, Sanders 2020. All delegates are now allocated. Sanders is still short. To get to 2382 he would need at least 182 delegates who have committed to Clinton to change their minds and vote for Sanders instead. Clinton has 532 superdelegates by the latest count. So that means 34.2% of the superdelegates currently committed to Clinton would have to flip.
They would have to do that flip in the face of Clinton having won the popular vote (even if you include estimated popular vote for caucus states), Clinton having won the pledged delegate count, and Clinton having won the most states. Not to mention significant numbers of the superdelegates not simply being lukewarm Clinton supporters, but being people who she has actively cultivated for many years, a good number of which have actually been active in her campaign.
Is it mathematically possible? Yes. Of course it is. Is it going to happen absent something catastrophic happening to Clinton? No.
Some Sanders folks are still holding out the “What if Clinton is indicted?” scenario. My guess is most superdelegates would consider it an unfair and unjust indictment and stick by their candidate. It probably wouldn’t be enough. Perhaps I suppose. It is a stretch though. More realistically it would take a debilitating health issue or some brand new scandal so serious it dwarfs everything that has come up so far. Can you imagine these sorts of things? Of course. But they are all unforeseen unpredictable types of event, not things you decide to continue a campaign based on. After all, there are ways Martin O’Malley can still win the nomination too!
You can conjure similar scenarios on the other side too of course, but absent that kind of craziness, we now have our nominees in both parties.
So we have Clinton vs Trump. Time to start focusing on the general election analysis!
153.4 days until polls start to close on election day!
Update 2016-06-12 17:16 UTC – Superdelegate update. Net Change: Clinton +11
Update 2016-06-12 17:43 UTC – Missed one change in the superdelegate update above. Additional Change: Clinton -1. (So Clinton +10 for this day’s scan.)
Update 2016-06-12 18:02 UTC – Updates from California, New Jersey, and South Dakota (including the remaining 4 TBD delegates from New Jersey). Net change: Sanders +4.
Update 2016-06-15 01:40 UTC – Superdelegate update. Net Change: Clinton -3, Sanders +1.
Note: This post is an update based on the data on ElectionGraphs.com. Election Graphs tracks both a poll based estimate of the Electoral College and a numbers based look at the Delegate Races. All of the charts and graphs seen in this post are from that site. Additional graphs, charts and raw data can be found there. Follow @ElectionGraphs on Twitter or like Election Graphs on Facebook to see announcements of updates or to join the conversation. For those interested in individual general election poll updates, follow @ElecCollPolls on Twitter for all the polls as they are added. If you find the information in these posts interesting or useful, please consider visiting the tip jar.
Edit 15:19 UTC to mention the 4 delegates from New Jersey in the list of remaining delegates and the calculations for superdelegates flipping.
After the Virgin Islands, Clinton only needed 9.26% of the remaining delegates to win. Sanders needed 90.96% of the remaining delegates.
In Puerto Rico, Clinton got 36 delegates, Sanders got 24.
Since the Virgin Islands, 6 more superdelegates were added to Clinton’s count as well.
So total change since the Virgin Islands: Clinton +42, Sanders +24.
That is Clinton 63.64%, Sanders 36.26%.
So Clinton met her target, Sanders did not.
Updated graphs:
New delegate totals: Clinton 2340, Sanders 1572, O’Malley 1.
There are 852 delegates left. Clinton needs 43 of them. Sanders needs 811 of them.
Clinton now needs 5.05% of the remaining delegates to win. Sanders needs 95.19%.
This of course includes superdelegates. Please see any number of previous posts here on Election Graphs as to why it is appropriate to include them, even though they can change their minds until they vote at the convention. If any superdelegates change their minds publicly before then, it will be tracked here.
Right now Clinton only needs 43 more delegates to clinch the nomination. There are still about 139 who have not stated a preference. There have been media reports that Clinton has 40+ superdelegates who have privately committed to her that they are waiting to roll out after the New Jersey results almost certainly push her over 2383 anyway. NBC, AP and some others also have a higher current delegate count than I do for Clinton by about 20 delegates due to information they have collected privately from superdelegates.
Put all of that together, and it is actually very possible, indeed probably very likely, that Clinton ALREADY has more than 2383 delegates that she is sure of. In terms of public confirmation, she is just a few handfuls of delegates away, the number of handfuls depending on whose delegate count you go by.
Superdelegates could give Clinton the nomination at any moment now. But since Clinton would prefer to win after the votes of regular citizens are counted, her campaign is almost certainly asking any currently uncommitted superdelegates leaning toward her to wait. So with as much certainty as you can ever get in these sorts of things, expect Clinton to be declared the presumptive nominee by everybody who does such things shortly after the polls start closing on June 7th.
For this site, the blog post about the June 7th results probably won’t go out until the next morning, but watch @ElectionGraphs on Twitter for hourly updates of the delegate totals, including of course noting when she wins the nomination by our own count.
Update 2016-06-07 00:52 UTC: I almost put “…at the latest.” on the end of the paragraph about the networks calling the result soon after polls start closing on the 7th. But alas, I didn’t. A few minutes ago AP reported that by their count Clinton is over 2383 and is therefore the presumptive nominee. They are including superdelegates who have not yet publicly expressed a preference, but have done so when asked privately. The count here will take a little bit to catch up, since it is dependent on public statements by superdelegates and/or actual election results. But the result will be the same…
Update 2016-06-07 22:31 UTC: My source trying to catch up with superdelegate info resulting from AP’s updated counts. Net Change: Clinton +15, Sanders +1, O’Malley -1. Yes, that one O’Malley superdelegate finally flipped… to Clinton.
Update 2016-06-07 23:55 UTC: Updated the number of superdelegates in a bunch of states as per Green Papers. Most changes were uncommitted slots anyway, but there was a net change of Clinton -1. There was no net change to the total number of delegates.
Note: This post is an update based on the data on ElectionGraphs.com. Election Graphs tracks both a poll based estimate of the Electoral College and a numbers based look at the Delegate Races. All of the charts and graphs seen in this post are from that site. Additional graphs, charts and raw data can be found there. Follow @ElectionGraphs on Twitter or like Election Graphs on Facebook to see announcements of updates or to join the conversation. For those interested in individual general election poll updates, follow @ElecCollPolls on Twitter for all the polls as they are added. If you find the information in these posts interesting or useful, please consider visiting the tip jar.
Edit 17:40 to fix a typo where I said Clinton needed 42 delegates instead of 43 in one of the places it is mentioned.
With the final results all but inevitable, these updates will be somewhat mechanical absent something unexpected happening.
After Oregon and Kentucky, Clinton only needed 11.37% of the remaining delegates to win. Sanders needed 88.84% of the remaining delegates.
In the Virgin Islands, Clinton got 6 delegates, Sanders got 1.
In other changes since Oregon and Kentucky due to superdelegate updates and adjustments in Maryland, Oregon and Michigan there was a net change of Clinton +17, Sanders +8.
So total change since Oregon and Kentucky: Clinton +23, Sanders +9.
That is Clinton 71.88%, Sanders 28.13%.
So Clinton met her target, Sanders did not.
Updated graphs:
New delegate totals: Clinton 2298, Sanders 1548, O’Malley 1.
There are 918 delegates left. Clinton needs 85 of them. Sanders needs 835 of them.
Clinton now needs 9.26% of the remaining delegates to win. Sanders needs 90.96%.
This of course includes superdelegates. The Sanders camp continues to insist that you shouldn’t count superdelegates until the convention because until then they can change their minds. It is true they can change their minds, but we have been logging whenever that happens, and it has been rare. The best we can tell about how superdelegates will vote is to take their public preferences at face value. If they change their minds and they say so, we will know and the counts will change. In the mean time, to ignore their preferences in the count would be to intentionally ignore data about the current situation.
Right now Clinton only needs 85 more delegates to clinch the nomination. There are still 145 superdelegates who have not stated a preference. They could put Clinton over the top at any time. The Clinton folks undoubtedly do not want superdelegates to put them over the top though, so they may actually be asking the remaining superdelegates NOT to make any endorsements in the next few days.
Some media agencies actually have Clinton’s delegate count a bit higher than our count, which matches The Green Papers exactly at this point. This is because those media organizations have been able to privately confirm the preferences of some superdelegates who have not made public commitments. Both this site and the Green papers use the Wikipedia superdelegate tally as our source, and this only includes publicly confirmed preferences.
In any case, we are very close. Between the Puerto Rican primary and superdelegates, it is possible Clinton will hit the magic number before the big contests on June 7th. Most likely though, she’ll get there as soon as the polls close in New Jersey on the 7th. The rest of the June 7th states will just be icing on the cake.
Update 21:45 – Superdelegate scan +6.
Note: This post is an update based on the data on ElectionGraphs.com. Election Graphs tracks both a poll based estimate of the Electoral College and a numbers based look at the Delegate Races. All of the charts and graphs seen in this post are from that site. Additional graphs, charts and raw data can be found there. All charts above are clickable to go to the current version of the detail page the chart is from, which may contain more up to date information than the snapshots on this page, which were current as of the time of this post. Follow @ElectionGraphs on Twitter or like Election Graphs on Facebook to see announcements of updates or to join the conversation. For those interested in individual general election poll updates, follow @ElecCollPolls on Twitter for all the polls as they are added.
Edit 2016-06-06 16:55 UTC to add yesterday’s superdelegate scan, which I had neglected to add at the time.
The Election Graphs delegate estimate now has Trump at 1238, one more than he needed to clinch the nomination.
AP announced that Trump had exceeded 1237 by their count on Thursday. They had canvassed the remaining uncommitted delegates who had not expressed a public preference, and found enough of them to put Trump over the top. When AP does this sort of thing, they don’t generally release their full list of delegates though, so it was hard to confirm this independently. But Election Graphs was able to spend a few hours Friday night digging through various sources to look for more specific information on specific uncommitted delegates, and we were also able to get Trump over the top.*
He will of course get even more delegates on June 7th, but he doesn’t need them. Absent a catastrophic unexpected event, Trump will be the Republican nominee for President in 2016.
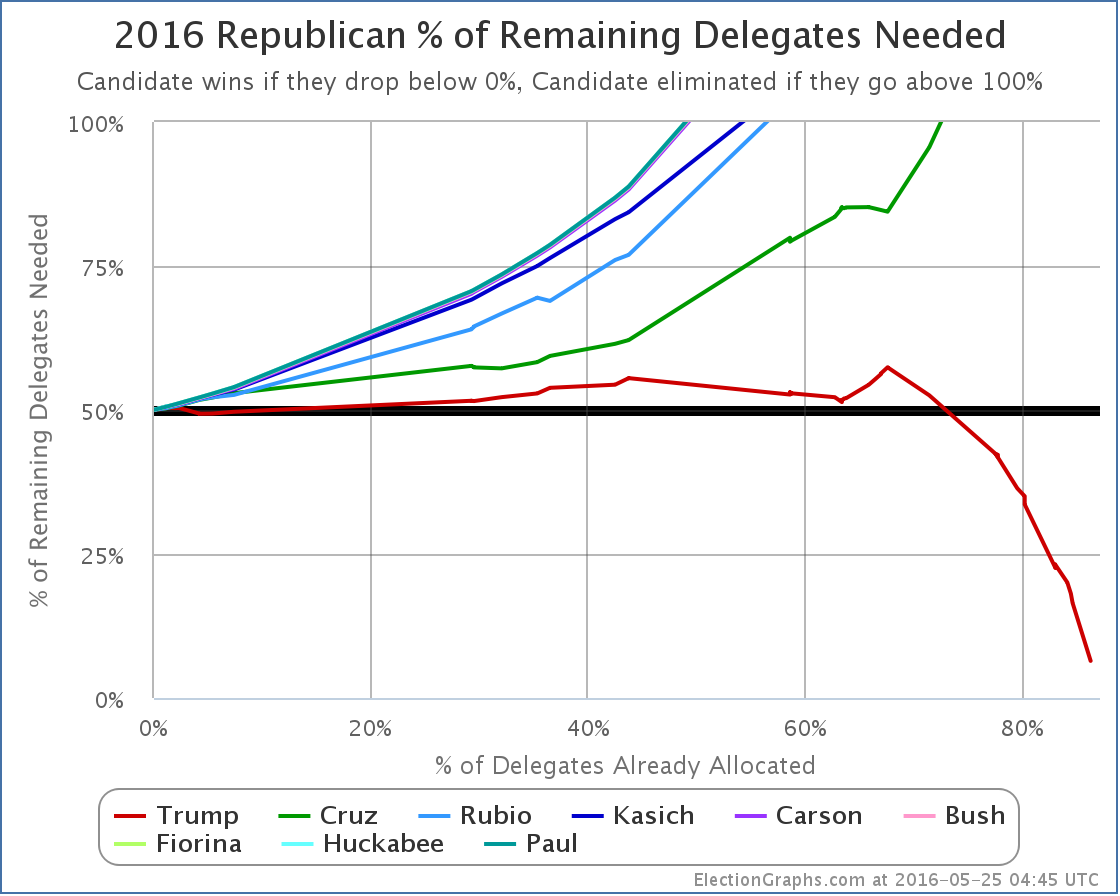
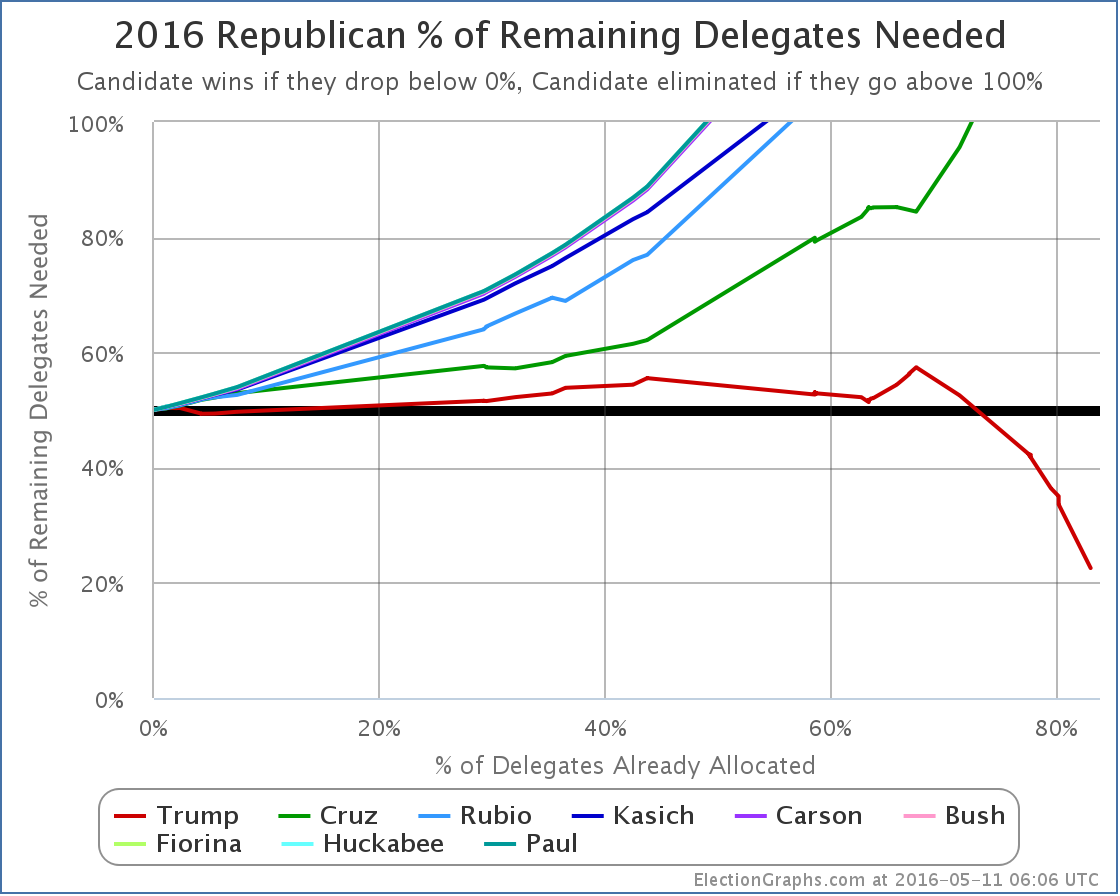
The final “% of remaining delegates needed to win” chart looks like this:
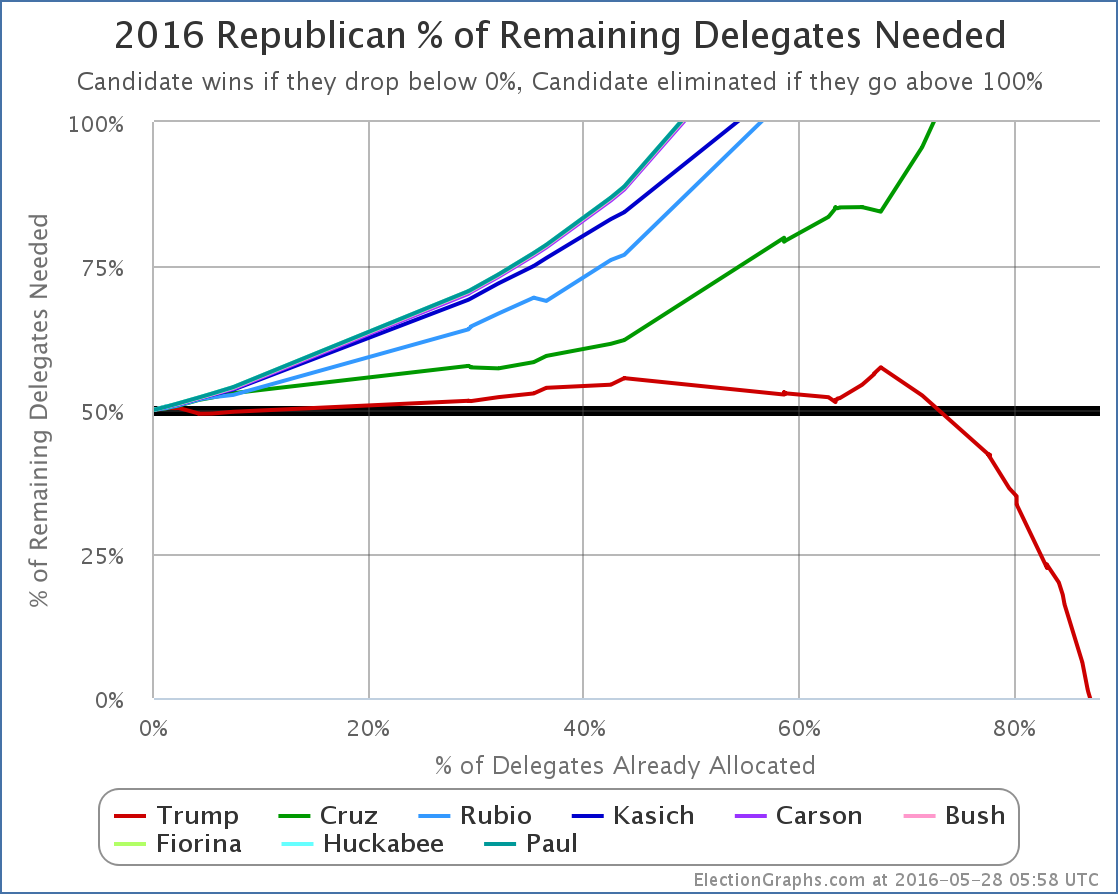
Trump hovered just over 50% for most of the race, but essentially as soon as Cruz was mathematically eliminated, Trump dropped below 50% needed, and rapidly raced to the conclusion. This was of course aided by Cruz and Kasich dropping out, but even if they hadn’t, the writing was on the wall. It would have taken a huge effort with a groundswell of popular support for his opponents to prevent Trump from getting to 1237 at that point, and it was obvious that neither the political will, or the voters for Cruz or Kasich were there. And so it ended.
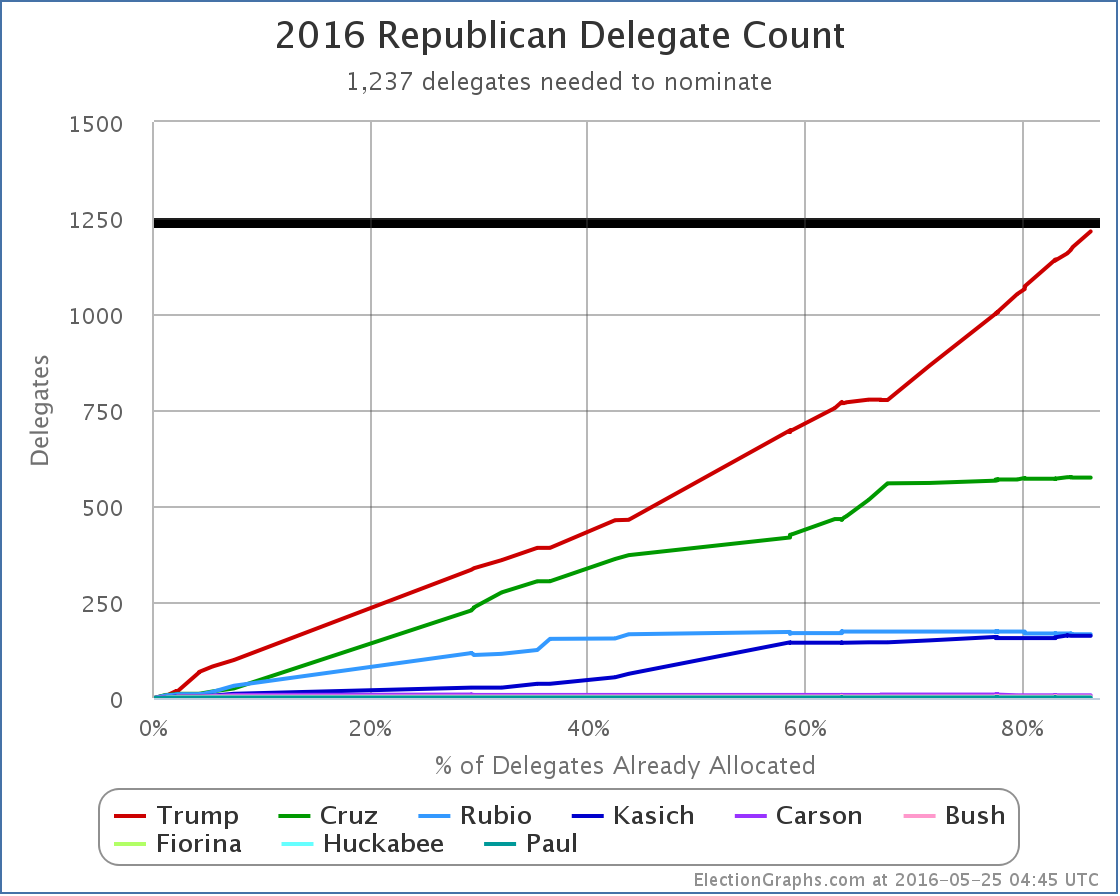
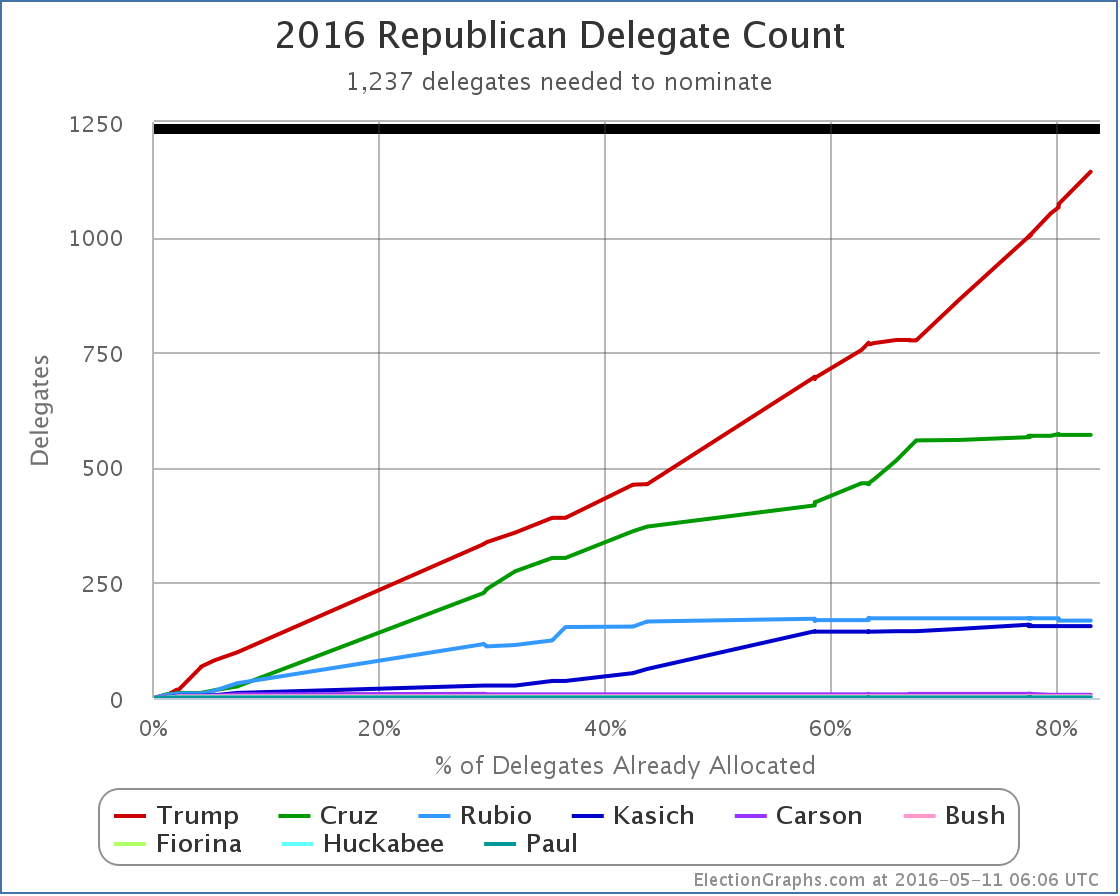
At this point the delegate count is Trump 1238, Cruz 570, Rubio 166, Kasich 163, Carson 7, Bush 4, Fiorina 1, Huckabee 1, Paul 1.
Trump will of course collect more before things are done. There is a chance others may pick up a handful too, but if they do it will be insignificant, and it is quite possible Trump will sweep the remaining delegates.
At this point Trump has 57.55% of the delegates. Cruz was next at 26.50%. Trump’s percentage will increase before we are done with all the delegate allocation.
Election Graphs will continue to monitor the delegate totals from the last few races for completeness, but for all intents and purposes the Republican race is now done. This has been the craziest oddball primary race in many decades. It has been fascinating to watch it play out.
Trump led from New Hampshire onward. From that point forward nobody ever came close. Until we got to the Northeast states though, the others were getting a high enough percentage to keep the possibility of blocking him alive, with the odds of Trump not getting to 1237 as high as 36% as late as April 18th according to the best simulations. (My gut feel had it higher, at 60%, but the numeric simulations were a better guide.) Now, that still meant Trump was probably going to get to 1237, but there was a decent shot at stopping it.
But then the anti-Trump forces essentially collapsed and gave up. It is just too hard to make the case that people should vote for you in order to help stop someone else, even after it is very clear you can’t win yourself. In my Curmudgeon’s Corner 2016 predictions show I essentially predicted exactly that. But in the heated days of March and April, I allowed myself to get a little too excited about the news nerd’s dream of a contested convention, as did a lot of people looking at the race. In the end though, it is really hard to stop someone who has led from beginning to end.
And so we have Trump.
It has been a lot of fun watching this primary process play out. The Democratic side should be winding up very shortly as well.
And then it is full speed ahead to the general election. If you have enjoyed my coverage of the Republican delegate race, I hope you’ll stay around for the Electoral College analysis.
164.7 days until polls start to close on the general election. The next few months will be quite a ride. Stay tuned!
* For those who want the specifics, in the last few days there were updates to the preferences from uncommitted delegates in North Dakota, Oklahoma, Colorado, Pennsylvania, the Virgin Islands, and Louisiana. Added up, the net change was Trump +23, Kasich +1, Cruz -3.
Update 2016-05-30 16:44 UTC – Change from Colorado: Trump +1, Cruz -1.
Update 2016-06-03 14:40 UTC – Change from Oregon: Trump -1, Kasich +1.
Note: This post is an update based on the data on ElectionGraphs.com. Election Graphs tracks both a poll based estimate of the Electoral College and a numbers based look at the Delegate Races. All of the charts and graphs seen in this post are from that site. Additional graphs, charts and raw data can be found there. All charts above are clickable to go to the current version of the detail page the chart is from, which may contain more up to date information than the snapshots on this page, which were current as of the time of this post. Follow @ElectionGraphs on Twitter or like Election Graphs on Facebook to see announcements of updates or to join the conversation. For those interested in individual general election poll updates, follow @ElecCollPolls on Twitter for all the polls as they are added.
Edit 14:00 UTC to add the * with the delegate changes from the last few days.
Edit 2016-06-04 04:04 UTC to fix the title from Electoral College to Republicans. Sigh.
With the final results all but inevitable, these updates will be somewhat mechanical absent something unexpected happening.
After Oregon, Trump needed 18.13% of the remaining delegates to win.
In Washington, Trump got 41 of 44 delegates. Nobody else got those last three, they will be officially uncommitted. No word yet on who those three delegates actually are and who they will support.
Also since the initial post on Oregon, updates there moved one delegate from Kasich to Cruz, plus an update in the Virgin Islands moved all but one uncommitted delegate there to Trump. Between these two places, the net change was Trump +7, Kasich -1, Rubio -2.
So total change since Oregon: Trump +48, Kasich -1, Rubio -2.
So Trump got over 100% of the new delegates since Oregon, since he got all of the actual new delegates, plus stole some from the others.
Updated graphs:
New delegate totals: Trump 1215, Cruz 574, Rubio 166, Kasich 162, Carson 7, Bush 4, Fiorina 1, Huckabee 1, Paul 1.
There are 341 delegates left. Trump only needs 22 of them.
As a note, there are currently 32 uncommitted delegates who have not yet expressed a preference by my count. There doesn’t seem to be an effort going on to push these folks to do so, but we’re now at the point where these uncommitted delegates could push Trump over the edge at any time if a bunch of them were to come out and say they were supporting him.
Trump now needs 6.45% of the remaining delegates to win.
That could be done with the uncommitted delegates sooner, but it is most probable this will come shortly after New Jersey closes their polls on June 7th. It is unlikely we will need to wait for the four Western states whose polls close later that evening.
Update 2016-05-26 14:51 UTC – AP says they have found enough uncommitted delegates to put Trump over 1237. I’ll update totals here as I get information on specific uncommitted delegates and state counts. Depending on how forthcoming AP is with the list of actual delegates that told them they support Trump, I may or may not be able to confirm 22 more uncommitted delegates before June 7th when the pledged delegates should push Trump over the edge anyway.
Update 2016-05-28 05:29 UTC – Uncommitted delegate update: Trump +20, Kasich +1, Cruz -3. I’ve done my best using all my usual sources to match AP’s conclusion. So far I have only been able to get up to Trump 1235… two delegates short… AP called various of these uncommitted delegates to get their count, but only released the totals and a few of the names, not all of the names, so it is impossible to confirm their total delegate by delegate. I’ll keep looking for more info on the remaining 18 uncommitted delegates on my list. If I find the remaining two before the next votes on June 7th, I’ll of course update.
Update 2016-05-28 05:54 UTC – I kept searching, and eventually found 3 more Trump delegates. That puts Trump at 1238 and therefore over the top. New blog post from me soon.
Note: This post is an update based on the data on ElectionGraphs.com. Election Graphs tracks both a poll based estimate of the Electoral College and a numbers based look at the Delegate Races. All of the charts and graphs seen in this post are from that site. Additional graphs, charts and raw data can be found there. All charts above are clickable to go to the current version of the detail page the chart is from, which may contain more up to date information than the snapshots on this page, which were current as of the time of this post. Follow @ElectionGraphs on Twitter or like Election Graphs on Facebook to see announcements of updates or to join the conversation. For those interested in individual general election poll updates, follow @ElecCollPolls on Twitter for all the polls as they are added.
Edit 15:21 to not imply the Virgin Islands are a state.
Edit 2016-05-28 13:57: Corrected the Trump delegate update not he first 2016-05-28 update to be Trump +20. The 1235 at that point was correct. I’d missed counting two Louisiana delegates in the delta.
With the final results all but inevitable, these updates will be somewhat mechanical absent something unexpected happening.
After Nebraska and West Virginia, Trump needed 22.57% of the remaining delegates to win.
In Oregon, Trump got 19 delegates, while Kasich picked up 5 and Cruz picked up 4, even though neither of them are actively running any more.
In other changes since Nebraska and West Virginia due to uncommitted delegate preference changes in Guam, finalization of the West Virginia results taking into account geographic restrictions, and an update from New York, there was a net change of Trump +6, Kasich +2, Cruz -1
So total change since Nebraska and West Virginia: Trump +25, Kasich +7, Cruz +3
So Trump actually got 71.43% of the delegates since Nebraska and West Virginia.
So while he didn’t completely sweep the delegates this week, he is still far ahead of the target pace he needs to get to 1237.
Updated graphs:
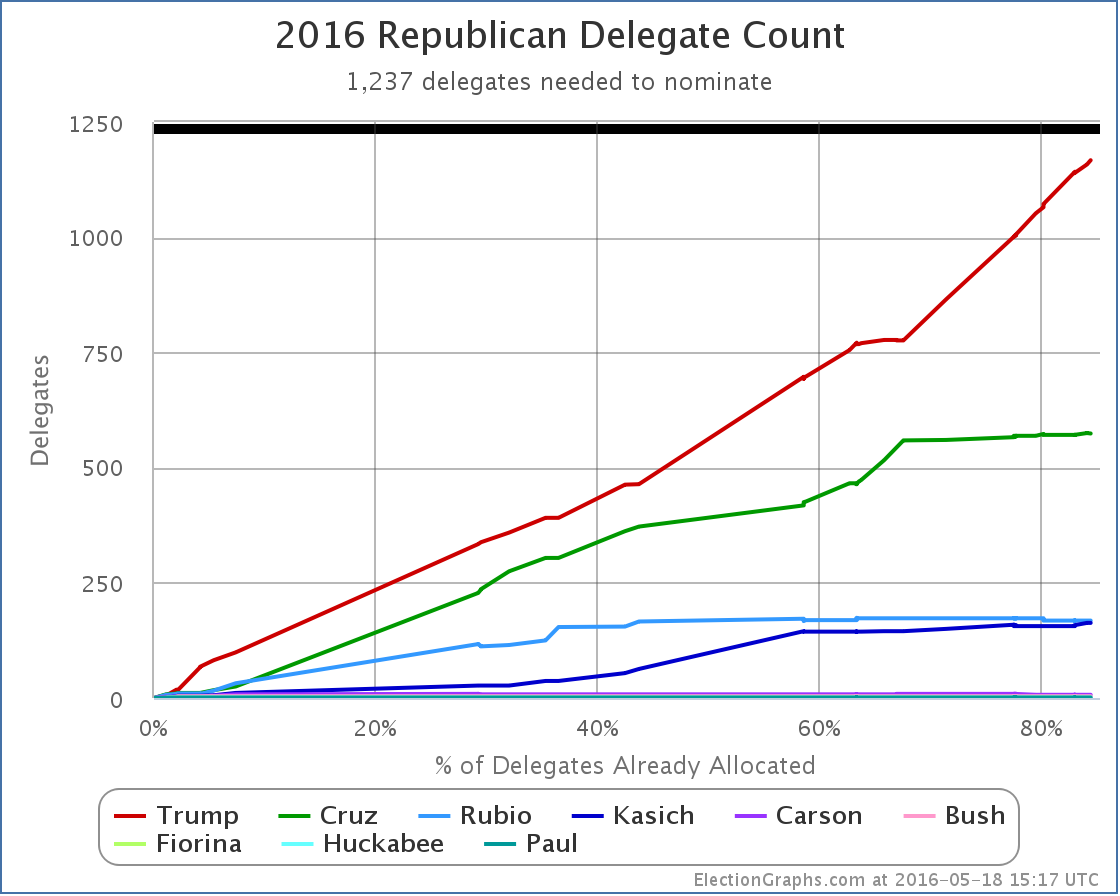
New delegate totals: Trump 1167, Cruz 574, Rubio 168, Kasich 163, Carson 7, Bush 4, Fiorina 1, Huckabee 1, Paul 1.
There are 386 delegates left. Trump needs 70 of them.
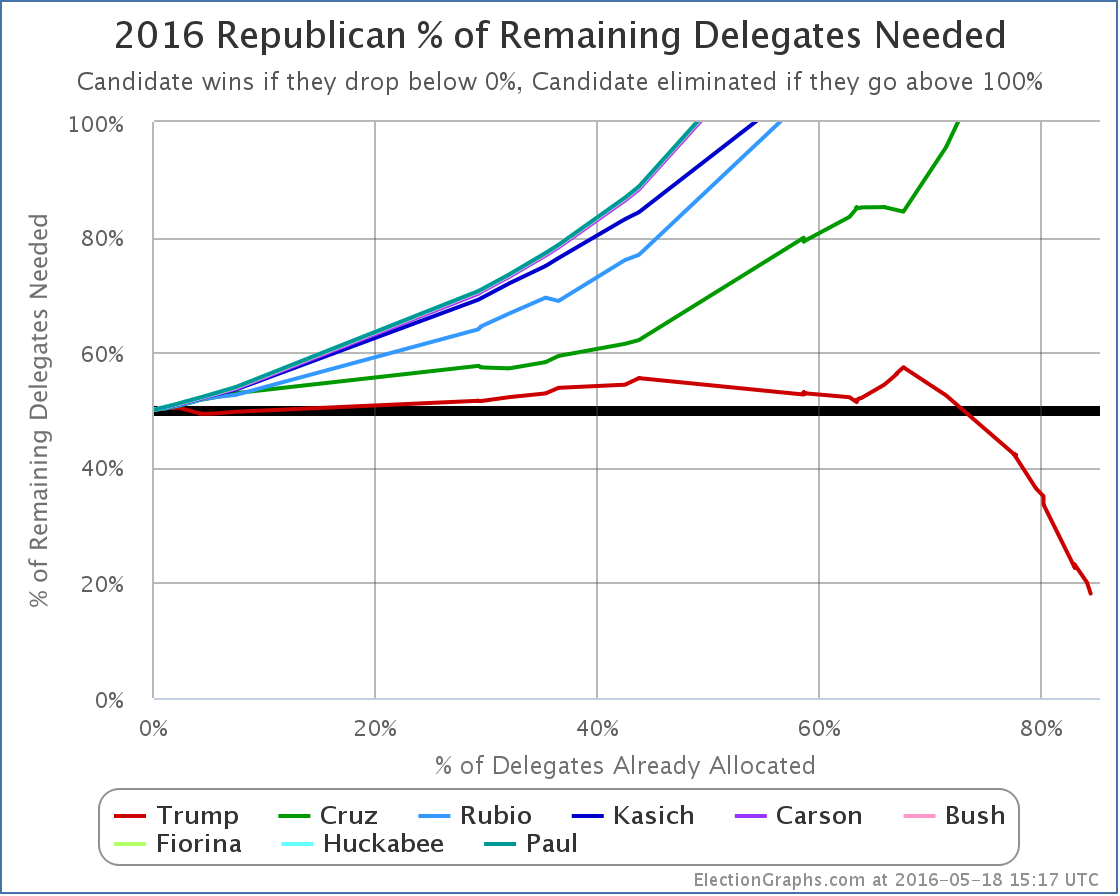
Trump now needs 18.13% of the remaining delegates to win.
Update 2016-05-22 16:12 UTC – Oregon update: Cruz +1, Kasich -1.
Update 2016-05-25 14:30 UTC – Virgin Islands update: Trump +7, Cruz -1, Rubio -2.
Note: This post is an update based on the data on ElectionGraphs.com. Election Graphs tracks both a poll based estimate of the Electoral College and a numbers based look at the Delegate Races. All of the charts and graphs seen in this post are from that site. Additional graphs, charts and raw data can be found there. All charts above are clickable to go to the current version of the detail page the chart is from, which may contain more up to date information than the snapshots on this page, which were current as of the time of this post. Follow @ElectionGraphs on Twitter or like Election Graphs on Facebook to see announcements of updates or to join the conversation. For those interested in individual general election poll updates, follow @ElecCollPolls on Twitter for all the polls as they are added.
With the final results all but inevitable, these updates will be somewhat mechanical absent something unexpected happening.
After West Virginia, Sanders needed 84.90% of the remaining delegates to win, Clinton only needed 15.29%.
In Oregon and Kentucky, Sanders got 62, Clinton got 54.
In other changes since West Virginia due to superdelegate updates, there was a net change of Clinton +1, Sanders -1.
So total change since West Virginia: Sanders +61, Clinton +55.
That is Sanders 52.59%, Clinton 47.41%.
So Clinton met her target, Sanders did not.
Updated graphs:
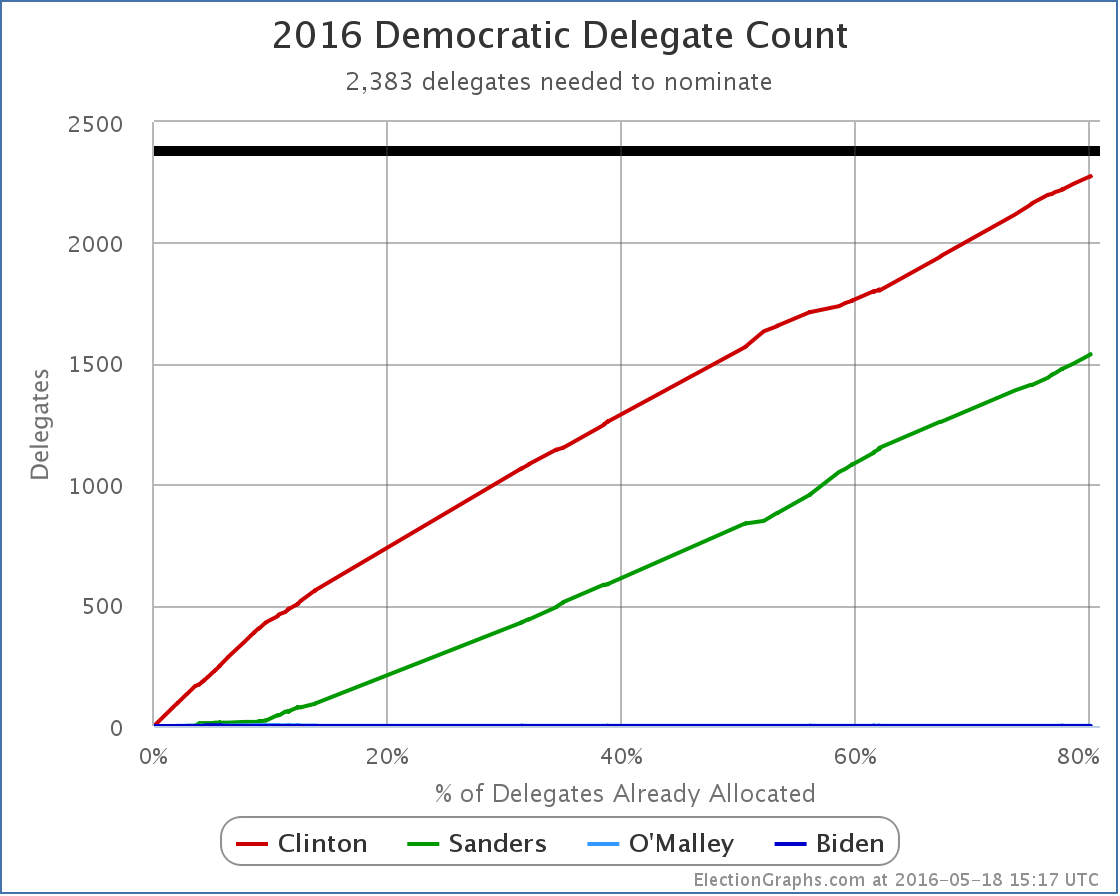
New delegate totals: Clinton 2275, Sanders 1539, O’Malley 1.
There are 950 delegates left. Clinton needs 108 of them. Sanders needs 844 of them.
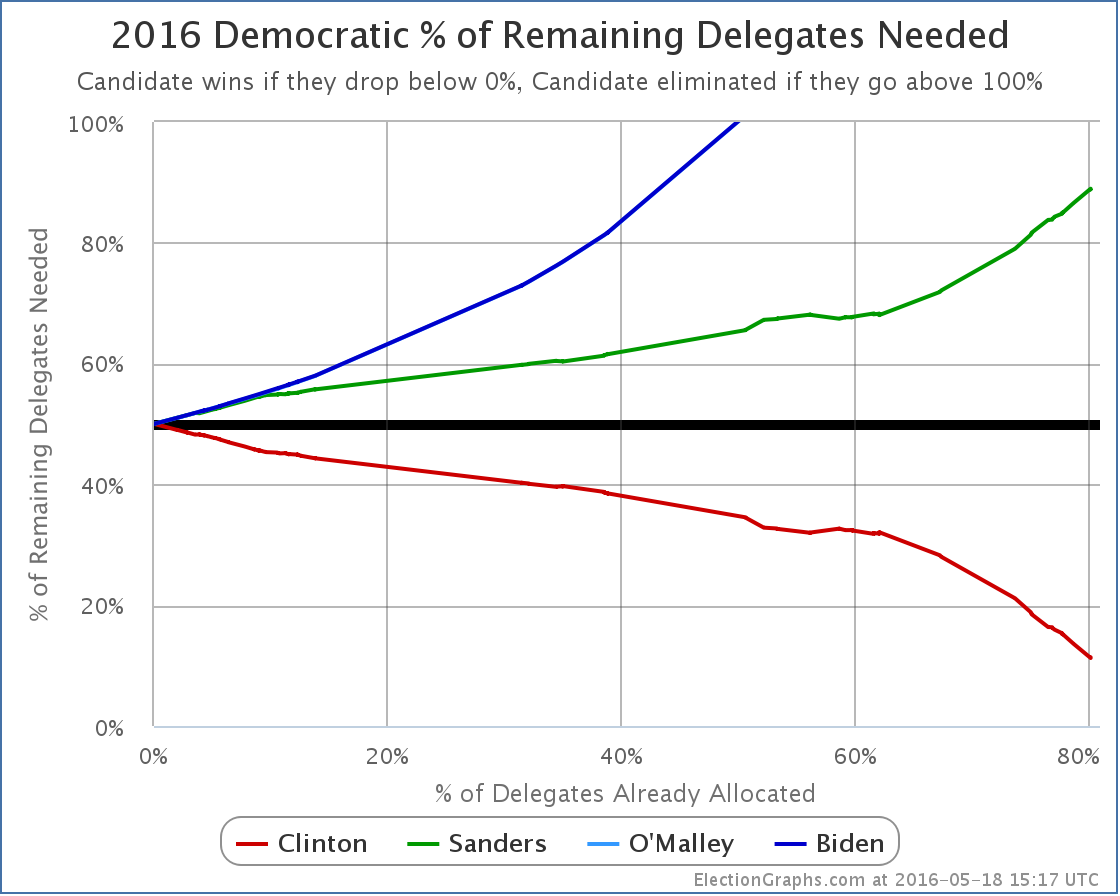
Clinton now needs 11.37% of the remaining delegates to win. Sanders needs 88.84%.
Update 2016-05-20 16:33 UTC: Superdelegate scan – Clinton +2, Sanders +2.
Update 2016-05-25 02:26 UTC: Superdelegate scan – Clinton +3.
Update 2016-05-25 02:28 UTC: Change from Maryland – Sanders +1, Clinton -1.
Update 2016-05-27 17:05 UTC: Superdelegate scan – Clinton +7, Sanders +1.
Update 2016-05-30 16:06 UTC: Superdelegate scan – Clinton +4, Sanders -1.
Update 2016-06-03 14:20 UTC: Superdelegate scan – Clinton +4, Sanders +3
Update 2016-06-03 14:22 UTC: There was a one delegate adjustment from Clinton to Sanders in Oregon as results were finalized there. I also discovered one Sanders delegate in Michigan I was missing due to a math error on my part which is now fixed. Net change: Sanders +2, Clinton -1.
Update 2016-06-05 03:25 UTC: Superdelegate scan – Clinton -1
Note: This post is an update based on the data on ElectionGraphs.com. Election Graphs tracks both a poll based estimate of the Electoral College and a numbers based look at the Delegate Races. All of the charts and graphs seen in this post are from that site. Additional graphs, charts and raw data can be found there. All charts above are clickable to go to the current version of the detail page the chart is from, which may contain more up to date information than the snapshots on this page, which were current as of the time of this post. Follow @ElectionGraphs on Twitter or like Election Graphs on Facebook to see announcements of updates or to join the conversation. For those interested in individual general election poll updates, follow @ElecCollPolls on Twitter for all the polls as they are added.
Edit 2016-06-05 05:44 UTC: Corrected a couple details of the list of superdelegate updates to match my logs of the changes that were made. I’d missed logging a couple of the updates here on this post. Dated the updates to approximately when I made the changes.
With the final results all but inevitable, these updates will be somewhat mechanical absent something unexpected happening.
After Indiana, Trump needed 36.02% of the remaining delegates to win.
In Nebraska and West Virginia, Trump seems to have gotten all 70 of the available delegates. (There may end up being some oddness due to West Virginia geographic restrictions on delegate allocation that shifts this slightly.)
In other changes since Indiana due to uncommitted delegate preference changes in American Samoa and Louisiana as well as Louisiana’s Rubio delegates moving to Trump, there were net changes of: Trump +14, Cruz -3, Rubio -5.
So total change since Indiana: Trump +84, Cruz -3, Rubio -5
So Trump actually got 111% of the delegates since Indiana. (Over 100% is possible since he actually took delegates from his opponents as well as collecting “new” delegates.)
So Trump obviously well exceeded the required numbers to be on pace for a win.
Updated graphs:
New delegate totals: Trump 1142, Cruz 571, Rubio 168, Kasich 156, Carson 7, Bush 4, Fiorina 1, Huckabee 1, Paul 1.
There are 421 delegates left. Trump needs 95 of them.
Trump now needs 22.57% of the remaining delegates to win.
Update 2016-05-14 14:31 UTC: Once the geographic restrictions on delegates was finalized and factored in, the final results in West Virginia were officially Trump 30, Kasich 1, Uncommitted 3. Two of the three uncommitted delegates have stated they are for Trump though, so we count this as Trump 32, Kasich 1, TBD 1. Net change from before: Trump -2, Kasich +1.
Update 2016-05-17 17:03 UTC: Update from New York. Net change: Trump -1, Kasich +1.
Update 2016-05-18 17:26 UTC: Update from Guam uncommitted delegates. Net Change Trump +9, Cruz -1.
Note: This post is an update based on the data on ElectionGraphs.com. Election Graphs tracks both a poll based estimate of the Electoral College and a numbers based look at the Delegate Races. All of the charts and graphs seen in this post are from that site. Additional graphs, charts and raw data can be found there. All charts above are clickable to go to the current version of the detail page the chart is from, which may contain more up to date information than the snapshots on this page, which were current as of the time of this post. Follow @ElectionGraphs on Twitter or like Election Graphs on Facebook to see announcements of updates or to join the conversation. For those interested in individual general election poll updates, follow @ElecCollPolls on Twitter for all the polls as they are added.
|
|